From 10G to Tbps: The Evolution of Optical Transmission Systems
Introduction
The evolution of optical transmission systems from 10 Gb/s to multi-terabit per second capacities represents one of the most significant technological achievements in telecommunications history. This transformation has been driven by relentless demand for bandwidth, fueled by cloud computing, video streaming, 5G networks, artificial intelligence, and the Internet of Things. What began with simple on-off keying modulation has evolved into sophisticated coherent detection systems using advanced digital signal processing and high-order modulation formats.
This article provides a comprehensive technical analysis of this evolution, examining the key technological breakthroughs, the driving forces behind each generation, and the practical implications for modern optical networks. We trace the journey from the first 10G systems in the 1990s through the current deployment of 800G systems and 1.6T technologies entering commercial production in 2026, and look ahead to the industry roadmap extending to 2035.
1. Historical Timeline: The Path from 10G to Tbps
Key Observation: Exponential Growth Pattern
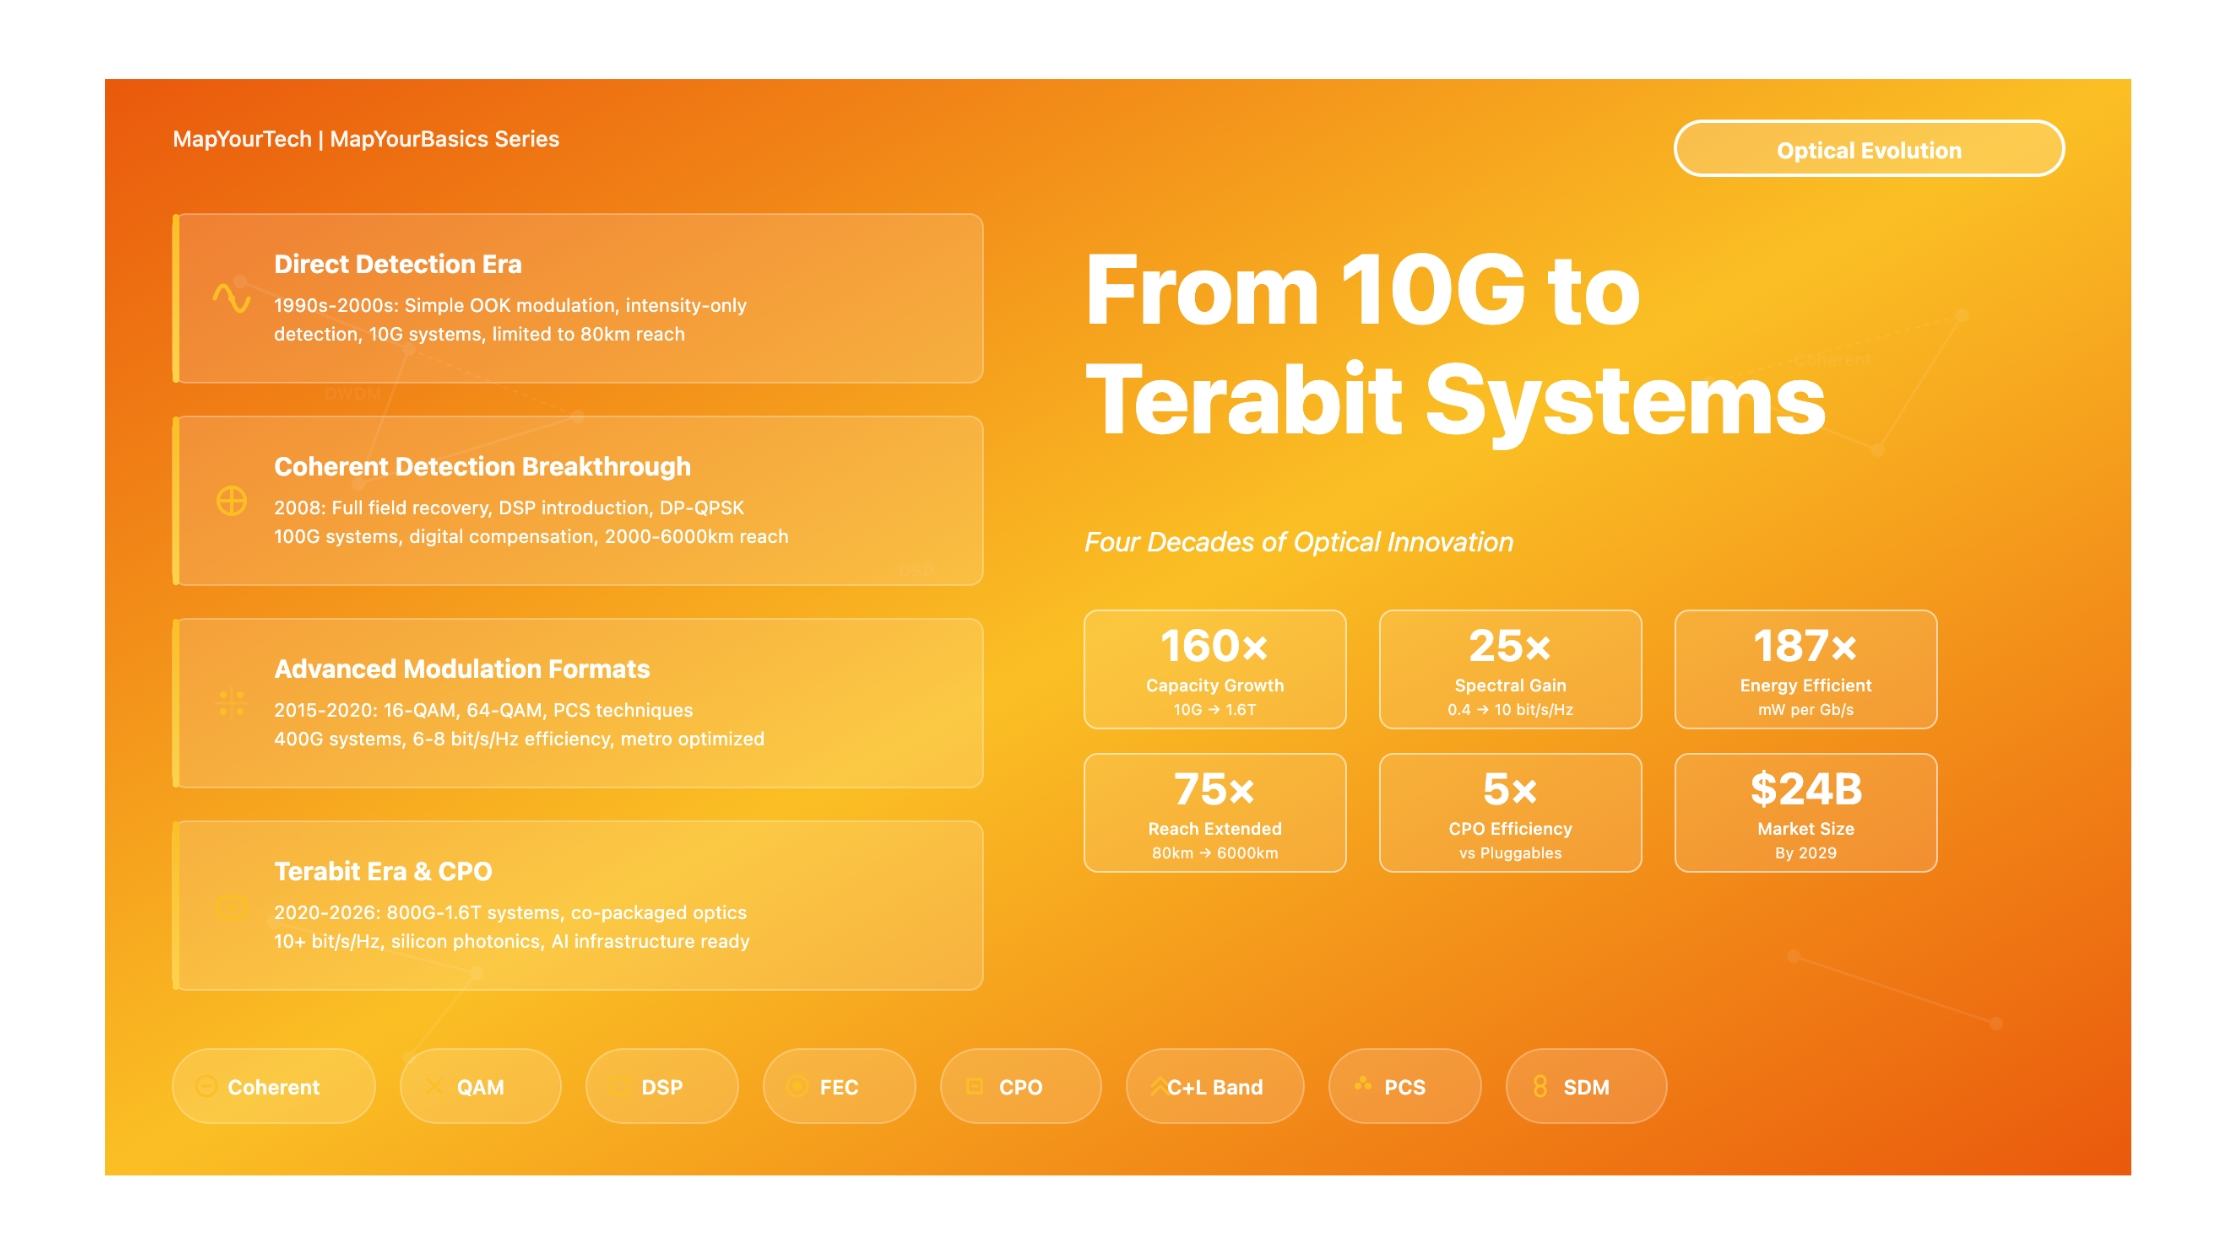
The capacity of optical transmission systems has grown exponentially, doubling approximately every 18-24 months. This growth has been enabled by three major technological transitions: the introduction of DWDM in the late 1990s, the coherent detection revolution in 2008, and the deployment of higher-order modulation formats from 2015 onwards. As of 2026, we are witnessing the massive deployment of 800G systems and the commercial entry of 1.6T technologies.
2. Why Was This Evolution Needed?
2.1 Exponential Traffic Growth
Global IP traffic has experienced sustained exponential growth, driven by multiple factors that emerged over the past three decades. Understanding these drivers helps explain why optical transmission systems needed to evolve from 10G to Tbps capacities.
Primary Traffic Drivers (1997-2026)
1990s-2000s: Internet Adoption Era
The dot-com boom and widespread internet adoption created the first major demand surge. Email, web browsing, and early e-commerce required significantly more bandwidth than traditional voice services. Total global IP traffic grew from a few terabits per month in 1997 to petabits per month by 2005.
2005-2015: Video Streaming Revolution
The introduction of YouTube (2005), Netflix streaming (2007), and mobile video fundamentally transformed traffic patterns. By 2015, video accounted for over 70 percent of all internet traffic. High-definition video streaming requires sustained bandwidth of 5-8 Mb/s per user, far exceeding earlier applications.
2015-2020: Cloud Computing and Mobile Data
Cloud services (AWS, Azure, Google Cloud) created massive data center interconnect requirements. The shift from on-premises to cloud infrastructure meant data was constantly moving between users and remote data centers. Simultaneously, 4G LTE mobile networks generated unprecedented wireless data traffic, requiring extensive fiber backhaul capacity.
2020-2026: AI, 5G, and Generative Models
5G networks promise ultra-low latency and multi-gigabit speeds, requiring dense fiber infrastructure with Tbps capacities. Artificial Intelligence, particularly large language models and generative AI, has created unprecedented demand for data center interconnects. Training a single large AI model can require moving petabytes of data between thousands of GPUs. Internet of Things deployments generate continuous sensor data streams. This AI-driven demand has become the primary driver of optical capacity increases in 2024-2026.
2.2 Economic and Technical Imperatives
Beyond traffic growth, several economic and technical factors made the evolution from 10G to Tbps transmission essential for network operators.
Cost Per Bit Reduction
Network operators face constant pressure to reduce the cost per transmitted bit. A 10G system from 2000 might have cost $100,000 per Gb/s of capacity. Modern 800G systems achieve costs below $1,000 per Gb/s. This 100-fold reduction was only possible through higher-capacity per-wavelength transmission, which amortizes the cost of optical amplifiers, fiber, and right-of-way across more traffic.
Spectrum Scarcity
The C-band spectrum (approximately 4.8 THz bandwidth) is finite. Early 10G systems used 100 GHz or 50 GHz channel spacing, supporting perhaps 40-80 wavelengths. Modern systems achieve 6-10 bits/s/Hz spectral efficiency through advanced modulation, allowing 400G-800G channels in the same or even narrower spectrum slots. This spectral efficiency improvement was necessary to avoid spectrum exhaustion.
Energy Efficiency
Power consumption in optical networks is a significant operational expense and environmental concern. A 10G transponder might consume 150-200 watts, yielding 0.05 Gb/s per watt. Modern 800G coherent transponders consume 65-80W total, achieving 10-12 Gb/s per watt - a 200-fold improvement. According to industry projections, by 2026, AI data centers alone will consume approximately 40 GW of power globally, making energy-efficient optical interconnects critical.
Submarine Cable Economics
Submarine cables cost $20,000-50,000 per kilometer to deploy. A new cable system represents a billion-dollar investment with a 25-year design life. Maximizing capacity per fiber through advanced modulation and wider spectral bands (C+L) is essential to justify these investments. Modern submarine systems achieve 20-30 Tb/s per fiber pair, compared to 1-2 Tb/s in early 2000s systems.
3. Technological Enablers: How We Got Here
3.1 The Coherent Detection Revolution (2008)
The most significant technological breakthrough in optical transmission was the introduction of practical coherent detection with digital signal processing. This transition fundamentally changed what was possible in optical communications.
The DSP Revolution
Digital Signal Processing enabled coherent systems to digitally compensate for chromatic dispersion (CD), polarization mode dispersion (PMD), and even some nonlinear effects. A coherent DSP can correct for thousands of kilometers of accumulated dispersion that would require complex and expensive dispersion compensating fiber (DCF) modules in direct detection systems. This single innovation reduced system cost while simultaneously increasing capacity and reach.
3.2 Modulation Format Evolution
The transition from simple on-off keying to sophisticated multi-level modulation formats represents the second major technological enabler of capacity growth.
| Modulation Format | Bits/Symbol | Era | Typical Capacity | Spectral Efficiency | OSNR Requirement | Reach |
|---|---|---|---|---|---|---|
| OOK/NRZ | 1 | 1990s-2000s | 10G | 0.4 bit/s/Hz | Low (~12 dB) | 80 km (unregenerated) |
| DPSK | 1 | 2005-2010 | 10G-40G | 0.8 bit/s/Hz | Medium (~15 dB) | 600 km |
| DP-QPSK | 4 (2×2) | 2008-2015 | 100G | 2 bit/s/Hz | Medium (~17 dB) | 2,000-6,000 km |
| DP-8QAM | 6 (2×3) | 2012-2018 | 150G-200G | 3 bit/s/Hz | High (~20 dB) | 1,000-2,000 km |
| DP-16QAM | 8 (2×4) | 2015-2022 | 200G-400G | 6-8 bit/s/Hz | High (~24 dB) | 500-800 km |
| DP-64QAM | 12 (2×6) | 2020-Present | 400G-800G | 10+ bit/s/Hz | Very High (~28 dB) | 80-300 km |
| PCS (Probabilistic) | Variable | 2022-Present | 800G-1.6T | 8-12 bit/s/Hz | Optimized per link | Application-specific |
3.3 Energy Efficiency Evolution
Energy efficiency has become a critical concern as network traffic continues growing exponentially. The evolution to Tbps transmission has delivered remarkable improvements in energy per bit.
4. Industry Roadmap: 2026-2035
Based on recent industry announcements, standardization efforts, and deployment plans from major vendors and hyperscale cloud providers, the optical networking industry has a clear roadmap extending through 2035. This section synthesizes information from leading equipment manufacturers, cloud service providers, and industry analysts to provide a comprehensive view of the evolution beyond current 800G and 1.6T systems.
4.1 Near-Term Roadmap (2026-2028)
2026: The Year of 800G Maturity and 1.6T Commercial Entry
800G Deployment Status:
2026 represents the massive deployment phase for 800G optical transceivers. Industry data shows 800G shipments achieving 100 percent year-over-year growth, with the technology now displacing 400G as the preferred choice for data center network upgrades. Market size for high-speed optical transceivers is projected to reach $16 billion in 2026, with 800G systems accounting for the majority of new deployments.
1.6T Commercial Production:
1.6T transceivers entered commercial production in 2025-2026, primarily for NVIDIA GPU clusters and hyperscale applications. Major vendors including Accelink Technologies have launched 1.6T OSFP224 DR8 modules supporting 8×200G rates. Coherent's 1.6T-DR8 module using OSFP packaging integrates NVIDIA DSP to meet AI network requirements. However, volumes remain limited in 2026 (under one million units), with broader adoption expected in 2027.
Form Factor Standardization:
The industry has standardized on OSFP-XD as the primary 1.6T carrier, with 92 percent of 2026 hyperscale data center contracts specifying this form factor for its 224G SerDes readiness. This standardization provides procurement clarity for organizations planning multi-year infrastructure programs.
2026-2027: Co-Packaged Optics (CPO) Commercial Deployment
NVIDIA Silicon Photonics Switches:
NVIDIA announced at GTC 2025 two revolutionary networking platforms incorporating co-packaged optics. Quantum-X Photonics for InfiniBand became available in the second half of 2025, delivering up to 115.2 Tb/s capacity with 144 ports at 800 Gb/s using silicon photonics. Spectrum-X Photonics for Ethernet will be available in the second half of 2026, delivering up to 409.6 Tb/s capacity with 512 ports at 800 Gb/s.
These systems integrate optical engines directly onto the switch ASIC using TSMC's System on Integrated Chips (SoIC) technology with 3D hybrid bonding. By eliminating pluggable transceivers, NVIDIA's CPO platform achieves 5× better power efficiency by reducing per-port power from 30W to approximately 9W, 10× higher network resiliency resulting in 5× sustained application runtime, 1.3× faster time to insight through simplified installation and serviceability, and reduced latency by eliminating DSP retimers in the signal path.
Market Impact and Adoption:
Hyperscale cloud providers including AWS, Microsoft Azure, Google, and Meta are actively evaluating or developing CPO technology for deployment beginning in 2026-2027. These companies collectively invest tens of billions of dollars annually in data center infrastructure. Leading data center operators including Texas Advanced Computing Center, CoreWeave, and Lambda have announced adoption of NVIDIA CPO in their next-generation infrastructures.
Initial CPO deployments will target scale-up AI networks (GPU-to-GPU interconnects) before expanding to broader scale-out infrastructure (traditional Ethernet/InfiniBand switching). The CPO market is projected to exceed $20 billion by 2036, growing at 37 percent CAGR from 2026 to 2036.
2027-2028: 3.2T Systems and Advanced Technologies
3.2T Transceiver Development:
The industry transition to 3.2T per wavelength is expected to accelerate starting in 2027, with estimated commercial need by 2028. This will require 200G per channel electrical/optical lanes (16 × 200G). The IEEE 802.3 working groups are developing the 200G electrical signaling standards required to support these speeds.
TSMC COUPE Roadmap:
TSMC's COUPE (Compact Universal Photonic Engine) platform is evolving in three stages that align with industry capacity needs. The first generation (2025-2026) provides optical engines for OSFP connectors, offering 1.6 Tb/s with reduced power consumption. The second generation (2027-2028) uses CoWoS packaging with co-packaged optics, enabling 6.4 Tb/s at the motherboard level. The third generation (2029-2030) will deliver 12.8 Tb/s within processor packages with further power and latency reductions.
Linear-Drive Pluggable Optics (LPO):
LPO technology achieves 30-50 percent reduction in power consumption by eliminating DSP and using linear driver/TIA chips directly with switch ASICs. LPO modules reduce power consumption from 12W to approximately 6.5W for 800G-FR4, while cutting end-to-end latency to under 2ns. This technology is particularly suitable for short-range, high-speed scenarios in AI clusters.
4.2 Mid-Term Roadmap (2028-2032)
Multi-Terabit Per Wavelength Systems
2028-2030: 3.2T to 6.4T Deployment
Based on current technology trajectories, the industry expects 3.2T systems to see mainstream deployment in hyperscale data centers using 200G SerDes technology, while 6.4T prototypes begin early demonstrations using advanced photonic integration. Modulation advances will include enhanced probabilistic constellation shaping (PCS) and geometric shaping techniques to optimize spectral efficiency versus reach trade-offs. Nonlinear compensation will employ advanced DSP algorithms for digital backpropagation and machine learning-based equalization.
C+L Band Becomes Standard:
By 2028-2030, C+L band amplification (combining C-band 1530-1565 nm with L-band 1565-1625 nm) will become standard in submarine cables and ultra-long-haul terrestrial systems. Combined C+L systems achieve 80-120 Tb/s per fiber pair, approximately doubling available capacity versus C-band only systems.
Space Division Multiplexing (SDM) Introduction:
Multi-core fiber (MCF) systems with 4-12 independent cores per fiber strand will begin commercial deployment. Submarine cables will see the first MCF submarine systems deployed, achieving 200-400 Tb/s per cable. Data center interconnects will use MCF for campus and metro links where fiber count is constrained. Manufacturing maturity will bring MCF production costs down to 2-3× single-core fiber, down from 5-10× in early deployments.
Power and Cooling Innovations
Energy Crisis Mitigation:
By 2030, AI data centers are projected to consume over 1,000 TWh annually globally. Optical networking must contribute to energy efficiency improvements. CPO will see widespread adoption with 30 percent of hyperscale data center ports using CPO by 2030, reducing network power by 40-50 percent versus pluggables. Photonic integration will enable direct laser integration on silicon photonics, reducing power from 15 pJ/bit for pluggables to under 5 pJ/bit for CPO. Optical engines will be designed for direct liquid cooling integration in high-density racks exceeding 100 kW.
Optical Circuit Switching (OCS):
Google and other hyperscalers are demonstrating 40 percent power savings through optical circuit switching, which bypasses electrical packet switching for scheduled, high-volume data transfers between data centers. OCS deployment accelerates in the 2028-2032 timeframe as AI training workloads with predictable communication patterns become dominant.
4.3 Long-Term Vision (2032-2035)
Beyond 10T Per Wavelength
Capacity Scaling Limits:
The single-mode fiber Shannon limit (theoretical maximum capacity) is approximately 100-150 Tb/s per fiber in the C-band using all available technologies. By 2032-2035, industry will approach this limit through multi-band operation with C+L+S band systems (S-band: 1460-1530 nm) achieving 150-200 Tb/s per fiber, SDM maturity with 12-24 core fibers in production multiplying per-cable capacity to 1-3 Pb/s, and few-mode fiber using multiple spatial modes with MIMO processing achieving an additional 5-10× capacity increase.
Hollow-Core Fiber Commercial Deployment:
Hollow-core photonic bandgap fiber, which guides light through air rather than glass, will enter commercial deployment. This technology offers 30 percent lower latency critical for financial trading and real-time applications, virtually eliminates fiber nonlinear effects enabling higher launch powers, and will be initially deployed in metro finance networks before expanding to long-haul by 2035. Manufacturing advances are expected to achieve cost parity with conventional fiber by 2033-2035.
Quantum and Classical Convergence
Quantum Key Distribution (QKD) Integration:
By 2035, quantum communication will coexist with classical DWDM traffic on common fiber infrastructure. Security applications will see government, financial, and critical infrastructure networks adopt QKD. Wavelength allocation will provide dedicated wavelengths for QKD channels alongside classical 3.2-10T channels. Distance extension through quantum repeaters will enable QKD over 1,000+ km, previously limited to approximately 100 km. Post-quantum cryptography will integrate quantum-safe algorithms with optical layer encryption.
4.4 Technology Ecosystem Evolution
4.5 Market Dynamics and Investment Trends
Investment and Market Size Projections
Optical Module Market Growth:
The optical transceiver market is experiencing explosive growth driven by AI infrastructure. The 2024 market reached $9 billion with 22.5 million units shipped. For 2026, the market is projected to reach $12 billion with 34.5 million units. By 2029, the market is forecast to reach $24 billion with sustained 40+ percent CAGR. Looking ahead to 2030, pluggable optics alone are forecast to reach $9.9 billion.
Technology Mix Evolution:
The market will see coexistence of multiple technologies serving different needs. Pluggable modules will remain dominant for flexibility and compatibility, accounting for 60-70 percent of the market through 2028. CPO systems will grow from under 5 percent in 2026 to 30 percent by 2030, focused on hyperscale AI clusters. LPO modules will capture 10-15 percent of the short-reach market by 2028 with power and latency advantages. Networks will deploy hybrid solutions with mixed architectures optimized for each link type.
Geographic Distribution:
North America and APAC lead deployment, with North America accounting for 45 percent of 800G/1.6T deployments, dominated by hyperscale cloud and AI clusters. APAC accounts for 35 percent and is experiencing explosive growth across multiple markets. China is leading a massive state-backed data center buildout and is leading in volume. India represents the fastest-growing data center market in APAC, driven by digital explosion with 1.4 billion population transitioning to digital services. Annual data consumption is surging from 12GB per user in 2020 to over 25GB per user in 2026. Major hyperscalers including AWS, Microsoft Azure, Google Cloud, and Oracle are establishing large-scale DCI hubs in Mumbai, Chennai, Hyderabad, and Pune. The government's Digital India initiative is accelerating 5G deployment and edge computing infrastructure. The Indian market is projected to reach $17 billion by 2027 with 18-20 percent CAGR. Singapore, Japan, and Australia represent established markets with submarine cable landing stations. EMEA accounts for 20 percent, focused on 5G backhaul and enterprise upgrades.
Critical Success Factors for 2026-2035
The successful evolution to multi-terabit systems depends on several critical factors.
Manufacturing Ecosystem: TSMC's leadership in advanced packaging (CoWoS, SoIC) and photonic integration is enabling CPO at scale. Multiple foundries (Global Foundries, Tower Semiconductor) are developing silicon photonics capabilities to avoid single-source dependency.
Supply Chain Resilience: Diversification of laser sources, photonic components, and high-speed electronics across North America, Europe, and Asia to mitigate geopolitical risks.
Standards Convergence: IEEE 802.3, OIF, and MSA consortia must align on 200G and 400G SerDes specifications to enable multi-vendor interoperability.
Power Infrastructure: Data centers must invest in massive power delivery upgrades (10-100 MW per facility) and advanced cooling (liquid cooling, immersion) to support AI workloads.
Skilled Workforce: Training optical engineers in silicon photonics, advanced DSP, and photonic packaging to support industry growth.
5. Significance for Modern Networks
5.1 Economic Impact
The evolution from 10G to Tbps transmission has fundamentally transformed the economics of telecommunications networks. The cost per transmitted bit has decreased by more than two orders of magnitude while simultaneously increasing capacity by similar margins.
Network Infrastructure Cost Reduction
A network designed to carry 1 Tb/s total capacity in 2000 using 10G technology would have required 100 wavelengths, each with dedicated transponders, multiplexers, and potentially regeneration. The total equipment cost might have exceeded $50 million, with substantial power and space requirements.
The same 1 Tb/s capacity in 2026 can be achieved with just 1-2 wavelengths using 800G-1.6T technology. Equipment costs are under $300,000, representing a 150-fold reduction in capital expenditure. Power consumption decreased from perhaps 50-100 kW to under 1 kW. This dramatic cost reduction enabled the explosive growth of internet services, cloud computing, and AI applications.
Submarine Cable Economics
Submarine cables represent billion-dollar investments with 25-year design lives. Early 2000s cables using 10G technology might achieve 1-2 Tb/s per fiber pair. Modern cables using 400G-800G technology with C+L band amplification achieve 20-30 Tb/s per fiber pair, a 15-20× increase. Future cables incorporating SDM could reach 100-400 Tb/s per cable.
This capacity increase allows cable consortia to serve exponentially growing demand without building proportionally more cables. The cost per bit transmitted across oceans has decreased by over 98 percent since 2000, enabling global services like video streaming, cloud computing, and international AI model training.
Conclusion
The evolution from 10 Gb/s optical transmission systems in the 1990s to multi-terabit systems entering commercial deployment in 2026 represents one of the great technological achievements of the information age. This transformation has been driven by relentless demand for bandwidth, enabled by breakthrough innovations in coherent detection, digital signal processing, advanced modulation formats, and forward error correction.
As of 2026, we stand at an inflection point in optical networking history. The massive deployment of 800G systems and commercial entry of 1.6T technologies mark the culmination of decades of research and development. Looking ahead, the industry roadmap extending to 2035 is clearer than ever before, with well-defined paths to 3.2T (2028), 6.4T (2030), and beyond.
The introduction of co-packaged optics by NVIDIA and other industry leaders represents a fundamental architectural shift comparable to the coherent detection revolution of 2008. By integrating photonics directly with switch ASICs, CPO achieves 5× power efficiency improvements and 10× resiliency gains required for million-GPU AI clusters. This technology will reshape data center networking over the next decade.
Beyond individual wavelength capacity increases, the industry is pursuing parallel paths through space division multiplexing, multi-band operation (C+L+S), and hollow-core fiber. The combination of these technologies will enable petabit-per-second cable capacities by the mid-2030s, ensuring optical infrastructure can support exponentially growing AI and cloud traffic.
For optical networking professionals in 2026, understanding this evolution - the why, how, and what next - is essential for designing, deploying, and operating modern networks. The technologies that enabled the transition from 10G to Tbps will continue evolving, presenting both challenges and opportunities. Those who master coherent optics, silicon photonics, and advanced DSP techniques will be well-positioned to lead the next phase of optical innovation.
The future of optical communications is bright, powered by light itself.
References
[1] ITU-T Recommendation G.709 - Interfaces for the optical transport network
[2] IEEE 802.3bs - 200 Gb/s and 400 Gb/s Ethernet
[3] Zhou, X. and Xie, C., "Digital Signal Processing in High-Speed Optical Fiber Communication"
[4] OIF Implementation Agreements for 400G and Beyond
[5] NVIDIA GTC 2025, "Quantum-X and Spectrum-X Silicon Photonics Platforms"
[6] LightCounting Market Research, "Optical Transceivers for Data Centers and AI"
[7] Omdia, "Optical Components Market Update"
[8] IDTechEx, "Co-Packaged Optics Market Report 2026-2036"
[9] Ethernet Alliance, "Ethernet Roadmap 2026"
[10] Sanjay Yadav, "Optical Network Communications: An Engineer's Perspective" - Bridge the Gap Between Theory and Practice in Optical Networking
Book Link: https://www.amazon.com.au/Optical-Network-Communications-Engineers-Perspective-ebook/dp/B0DSB6J7B3/
Developed by MapYourTech Team
For educational purposes in Optical Networking Communications Technologies
Feedback Welcome: If you have any suggestions, corrections, or improvements to propose, please feel free to write to us at [email protected]

Optical Communications & Network Automation Expert | Author of 3 Books for Optical Engineers | Founder, MapYourTech
Optical networking engineer with nearly two decades of experience across DWDM, OTN, coherent optics, submarine systems, and cloud infrastructure. Founder of MapYourTech. Read full bio →
Follow on LinkedInRelated Articles on MapYourTech