68 min read

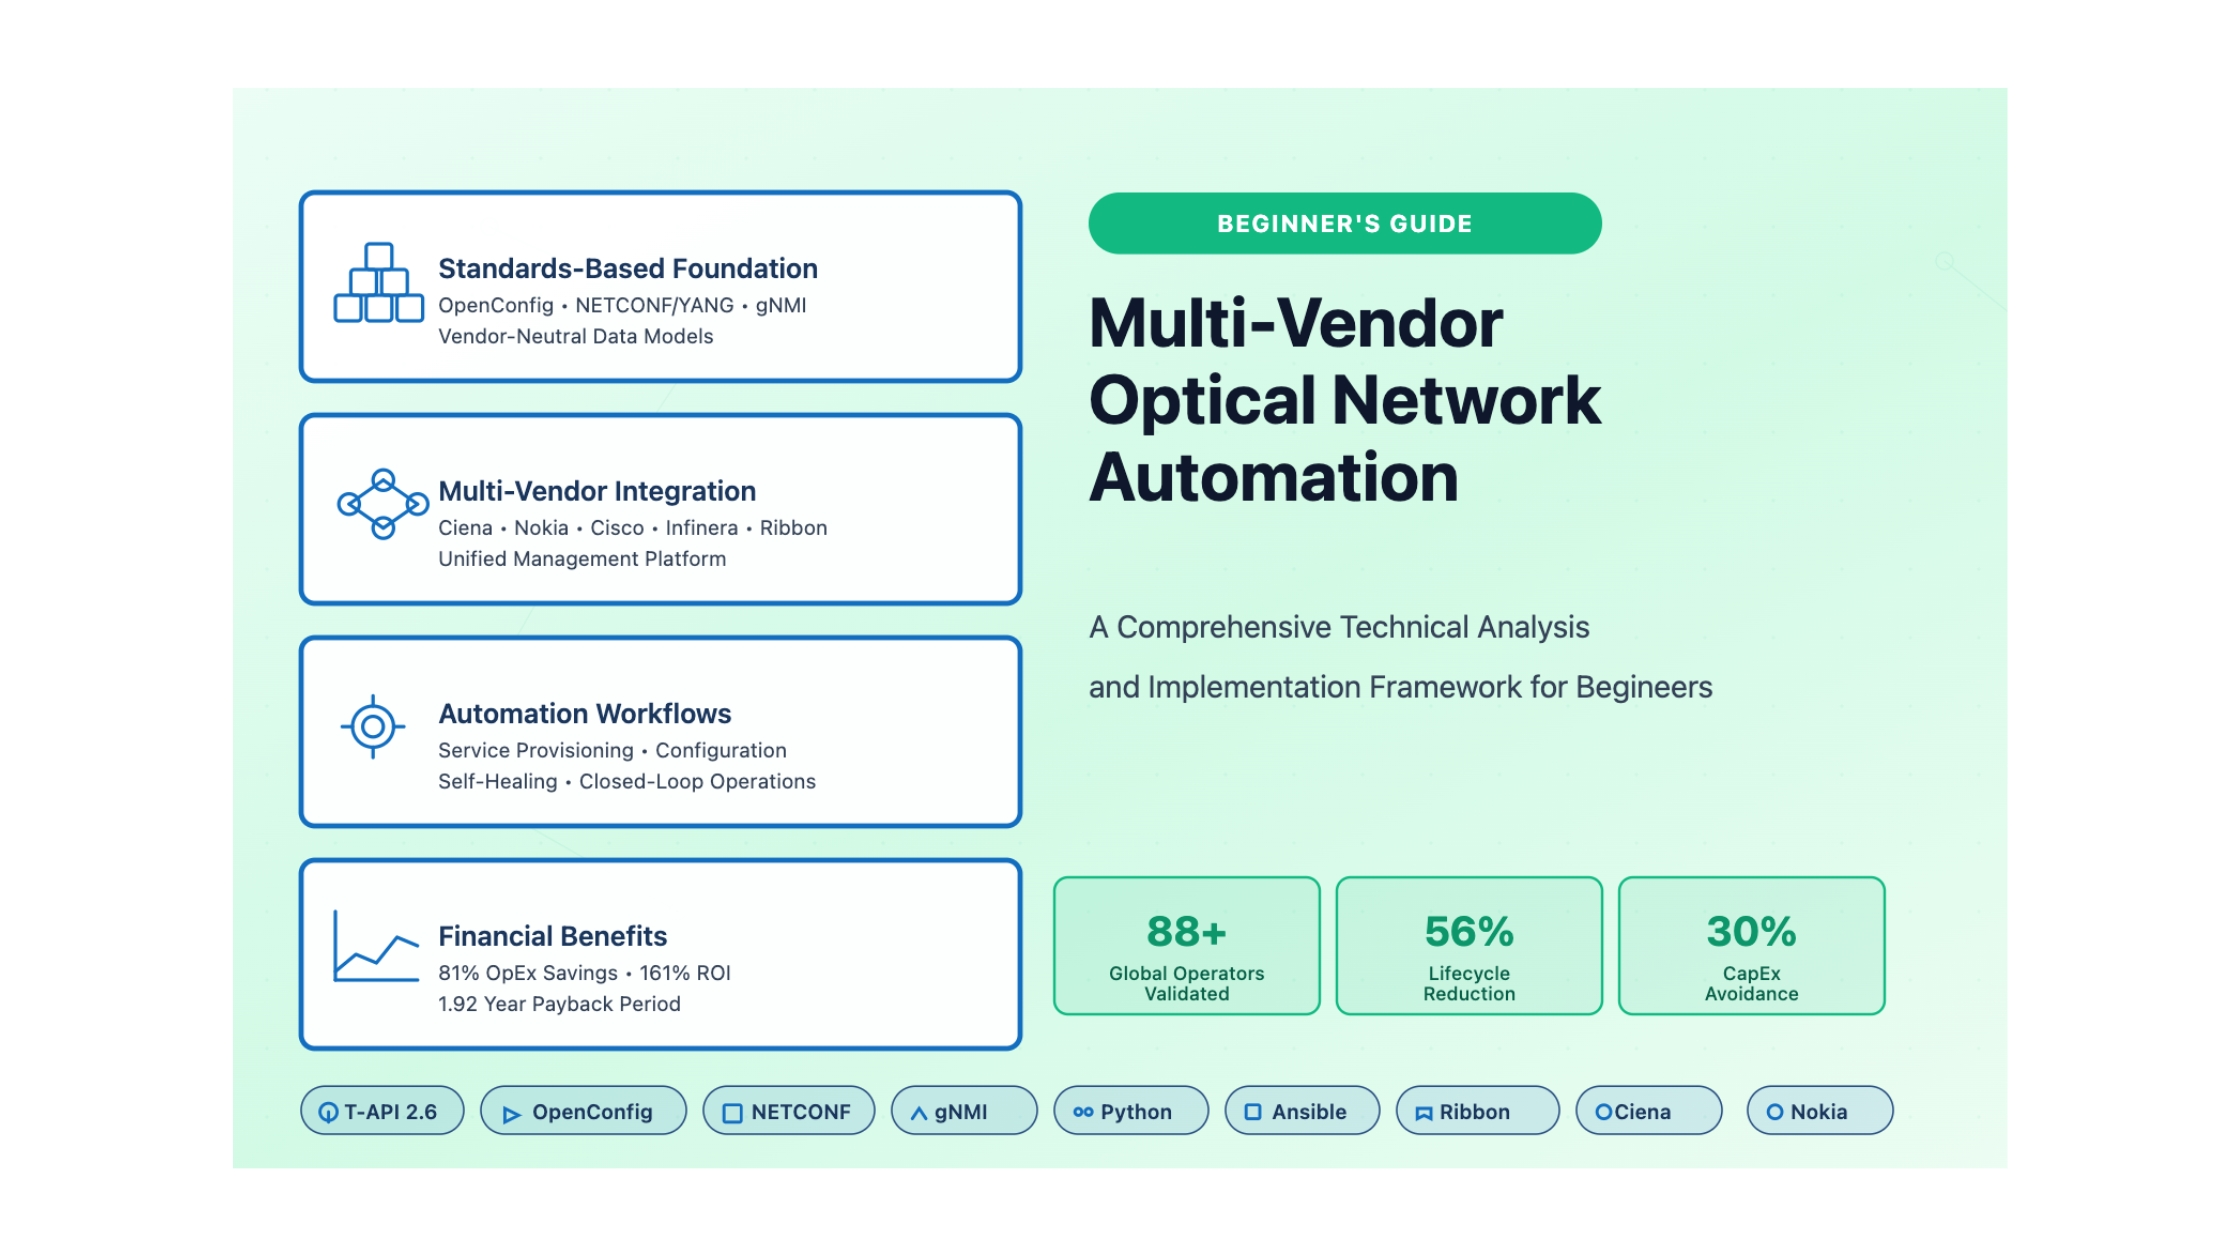
Begineers Multi-Vendor Optical Network Automation
A Comprehensive Technical Analysis and Implementation Framework
⚡ TL;DR -Too Long; Didn't Read
Multi-vendor optical network automation transitioned from experimental vision to operational imperative between 2022-2025. Standards maturity (OpenConfig, NETCONF/YANG, T-API) enables genuine interoperability. Financial case is compelling: 50-81% OpEx savings, 30-35% CapEx reduction, sub-2-year ROI payback. Success requires phased crawl-walk-run deployment, hybrid network/software teams, and executive commitment to 24-36 month transformation journey.
📊 Financial Impact
81% OpEx savings in provisioning, 161% 5-year ROI, 1.92 year payback period for mid-sized operators
🏗️ Architecture
Hierarchical SDN with orchestrator above domain controllers. T-API northbound, OpenConfig/NETCONF southbound
⏱️ Timeline
24-36 months crawl-walk-run deployment. Quick wins in 90 days, production automation by month 18
👥 Team Structure
Start with 3-5 person core team, scale to 10-15+ FTEs. Balance 40% network, 40% software, 20% DevOps skills
Key Metrics at a Glance
Comprehensive Value Creation Framework
Platform Comparison: Quick Selection Guide
Ciena Blue Planet
- 150+ clients, 15 Tier-1 providers
- T-API 2.1.3, official Ansible Collection
- Best for: Optical/packet transport focus
- 10-20% proven operational savings
Nokia NSP
- 1,000+ operator deployments globally
- Unified IP+Optical platform (NFM + WaveSuite)
- Best for: Large multi-technology networks
- TM Forum Level 4 autonomy
Cisco Crosswork / NSO
- RON architecture: 35% CapEx, 57% OpEx savings
- Hierarchical Controller + domain controllers
- Best for: IP-optical convergence
- Acacia 400G/800G/1.6T coherent technology
Infinera Transcend (Nokia)
- Open standards, disaggregation focus
- GX Series alien wavelength support
- Best for: Multi-vendor open architectures
- Now integrated with Nokia NSP
Ribbon Muse & Apollo
- 1,000+ customers globally, tier-1 deployments (AT&T, Verizon, BT, Airtel)
- 25.6T industry-leading density, 140Gbaud 5nm technology
- AI Muse Agent conversational interface + low-code automation
- Native comprehensive TDM/SDH/SONET support (critical differentiator)
- Best for: Multi-vendor IP-optical, legacy TDM migration, high-density metro
ADTRAN Mosaic & Ensemble
- Migration-focused: legacy to modern
- Hybrid NMS/SDN dual operation modes
- Best for: Smooth operational transition
- TIP OOPT MUST compliance (FSP 3000)
Implementation Phases: Your Roadmap
| Phase | Duration | Team Size | Key Deliverables | Success Metrics |
|---|---|---|---|---|
| CRAWL: Foundation | Months 0-6 | 3-5 FTEs | Platform deployed, unified inventory, config backup, read-only compliance | Complete topology visibility, 100% backup coverage, quick win demonstrated |
| WALK: Active Config | Months 6-18 | 5-8 FTEs | SDN controllers, automated provisioning, pre/post validation, ITSM integration | 75% provisioning time reduction, 50% error rate decrease, pilot success |
| RUN: Closed-Loop | Months 18-36 | 10-15+ FTEs | Intent-based networking, self-healing, AI/ML optimization, self-service portal | <2 min MTTR, 90%+ proactive prevention, >50% self-service, full ROI |
Standards & Technology Stack
Southbound Interfaces (Device Level)
| Standard | Purpose | Maturity Status | Key Versions |
|---|---|---|---|
| OpenConfig | Vendor-neutral YANG models for optical devices | Production-grade (95% adoption) | terminal-device 1.9.2, transport-types 1.1.0, platform-transceiver 0.17.0 |
| NETCONF | Transactional configuration management | Industry standard (95% maturity) | RFC 6241, XML encoding, SSH transport, candidate datastore |
| gNMI | Streaming telemetry & high-performance config | Rapidly maturing (95% adoption) | gRPC/HTTP2, Protobuf, 100x better than NETCONF for telemetry |
| RESTCONF | RESTful configuration APIs | Mature (90% adoption) | RFC 8040, HTTP/HTTPS, JSON/XML encoding |
Northbound Interfaces (Orchestration Level)
| Standard | Purpose | Organization | Status |
|---|---|---|---|
| T-API 2.6.0 | Multi-domain service orchestration | ONF (Open Networking Foundation) | Production-ready, OIF validated |
| TMF Open APIs | OSS/BSS integration (API 641 Service Ordering, 632 Party Mgmt) | TM Forum | Industry standard for service providers |
| MEF LSO | Lifecycle Service Orchestration (Legato, Presto interfaces) | MEF (Metro Ethernet Forum) | Carrier Ethernet automation standard |
🎯 Immediate Action Items for Network Operations Leaders
- Week 1-2: Conduct skills assessment of current team. Identify network vs. software development capabilities. Document gap between current state and required NetDevOps competencies.
- Month 1: Deploy read-only monitoring (network discovery, config backup, compliance checking). Prove automation value without production risk. Select high-visibility quick win use case deliverable in 90 days.
- Month 2-3: Build 3-5 person automation core team (Network Architect + Service Developer + Product Owner). Secure executive sponsorship. Define measurable KPIs (provisioning time, error rate, MTTR, OpEx savings).
- Month 3-6: Evaluate automation platforms (attend vendor demos, conduct POCs in lab). Shortlist 2-3 platforms aligned to architecture strategy. Complete initial platform deployment in non-production environment.
- Month 6-12: Implement first production automation workflow in pilot network segment. Measure results rigorously. Document lessons learned. Begin scaling to additional use cases based on ROI priority.
Critical Success Factors
| Success Factor | Why It Matters | How to Achieve |
|---|---|---|
| Executive Sponsorship | 24-36 month transformation requires sustained funding and political support | Quantify ROI in business terms. Monthly progress demonstrations. Celebrate early wins publicly. |
| Phased Approach | Big-bang deployments overwhelm teams and generate resistance when failures occur | Follow crawl-walk-run methodology. Non-disruptive monitoring first. Controlled pilot before production scale. |
| Hybrid Skills | Success requires both deep network domain expertise AND modern software development capabilities | Build diverse teams (40% network, 40% software, 20% DevOps). $5K-$10K annual training per engineer. |
| Standards Adherence | Proprietary approaches create vendor lock-in and limit future flexibility | Prioritize OpenConfig, T-API, NETCONF/YANG. Validate multi-vendor interoperability through testing. |
| Change Management | Cultural transformation proves harder than technology deployment | Comprehensive training (40+ hours per engineer). Pilot champions. Transparent communication. Document everything. |
| Rigorous Testing | Multi-vendor complexity introduces failure modes absent in single-vendor environments | Dedicated lab infrastructure. Pre-change validation. Post-change verification. Automated rollback capabilities. |
Common Pitfalls to Avoid
| Pitfall | Impact | Mitigation |
|---|---|---|
| Attempting full end-to-end automation immediately | Overwhelming complexity, team burnout, project failure | Start with read-only monitoring. Build one workflow completely before scaling horizontally. |
| Underestimating multi-vendor integration complexity | Budget overruns, timeline delays, feature compromises | Apply 25-50% integration premium for multi-vendor scenarios. Extensive pre-deployment testing. |
| Neglecting legacy system integration | Incomplete automation coverage, manual workarounds persist | Budget for custom adapters. Accept that some legacy equipment may require CLI automation. |
| Insufficient training investment | Team lacks confidence, automation quality suffers, errors increase | Allocate $5K-$10K per engineer annually. Certifications (DevNet, JNCIA-DevOps). External training. |
| Spreading resources across too many processes | Nothing reaches production quality, credibility suffers | Focus on one operational workflow at a time. Complete it fully before moving to next use case. |
| Poor documentation practices | Knowledge silos, turnover impact, maintenance difficulties | Mandate comprehensive documentation for all workflows. Code comments. Architecture diagrams. Runbooks. |
1. Executive Summary
1.1 Research Overview & Methodology
This comprehensive analysis synthesizes insights from extensive industry research, real-world deployment case studies from tier-one operators, and detailed technical documentation from leading optical networking vendors including Ciena, Nokia, Infinera, and Cisco. The research methodology employed multi-source validation across three dimensions: quantitative financial impact analysis from studies by Analysys Mason and Nokia involving 88 global operators, technical architecture validation through standards bodies including ONF, OIF, and IETF, and operational validation through documented field deployments by AT&T, Verizon, Deutsche Telekom, BT Group, and NTT.
The analysis framework examined six critical domains that collectively determine automation success in multi-vendor optical environments: integration architecture patterns ranging from centralized to hierarchical control models, technical standards maturity across OpenConfig, NETCONF/YANG, and Transport API specifications, financial justification methodologies encompassing total cost of ownership and return on investment calculations, phased deployment strategies following crawl-walk-run maturity progression, team composition and skill development requirements balancing network and software engineering expertise, and vendor technology selection criteria evaluating commercial platforms against open-source alternatives.
1.2 Key Discoveries & Critical Findings
The research reveals transformative financial impacts that fundamentally alter the business case for optical network operations. Operators implementing comprehensive automation achieve operational expenditure reductions reaching 81 percent in service provisioning and fulfillment workflows, 56 percent in network lifecycle management processes, and capital expenditure avoidance of 30 percent through optimized planning and resource utilization. Service provisioning timelines collapse from industry-standard 5 to 7 weeks down to 24 hours, representing a 90 percent operational cost reduction in order fulfillment processes. Revenue uplift reaches 10 percent through accelerated service delivery enabling improved competitive positioning, with one tier-one North American operator documenting a five-fold improvement in win rates for competitive service offerings.
Financial Impact of Automation Implementation
The quantified economic benefits translate into compelling return on investment profiles. A representative mid-sized operator investing 800,000 dollars initially plus 300,000 dollars annually faces a five-year total cost of ownership of 2.3 million dollars. Annual benefits totaling 1.2 million dollars from labor savings reducing 30 percent of 2 million dollar annual operations costs, truck roll reduction eliminating 125 preventable dispatches at comprehensive 1,000 dollar cost per incident including opportunity cost and customer dissatisfaction impacts, network utilization improvements reclaiming stranded capacity worth 150,000 dollars annually, and new revenue opportunities generating 200,000 dollars from accelerated service delivery accumulate to 6 million dollars over five years. This yields net benefit of 3.7 million dollars and 161 percent return on investment with payback occurring within 1.92 years of full deployment.
1.3 Strategic Impact Assessment
The strategic imperative for multi-vendor optical network automation stems from operational necessity rather than technological fashion. Network complexity grows exponentially driven by coherent pluggable optics scaling from 400 gigabits to 800 gigabits and 1.6 terabits, C-plus-L band spectrum expansion enabling capacity doubling without new fiber deployment, artificial intelligence and machine learning traffic patterns creating unpredictable demand spikes, and 5G transport requirements demanding sub-millisecond latency with carrier-grade reliability. This complexity exceeds human-scale manual operations capability, shifting automation from competitive advantage to competitive requirement for operational viability.
The transition from manual to automated operations fundamentally transforms the network operations cost-capacity relationship. Rather than eliminating positions, automation enables existing teams to manage networks four times larger as documented in industry research on artificial intelligence driven network management. Advanced automation research quantified 67 percent reduction in design, provisioning, and maintenance time, freeing 40 percent of worker capacity for strategic initiatives rather than repetitive tasks. This capacity liberation allows operators to absorb traffic growth and service complexity without proportional staffing increases, fundamentally changing the economics of network scaling. The staffing reality counters misconceptions about headcount reduction demonstrating that network automation changes the cost-capacity curve rather than eliminating positions, with training investments of 5,000 to 10,000 dollars per employee annually enabling this transition through comprehensive programs requiring 50,000 to 100,000 dollars for ten-person teams.
| Strategic Dimension | Traditional Manual Operations | Automated Multi-Vendor Operations | Impact Magnitude |
|---|---|---|---|
| Service Provisioning | 5-7 weeks average timeline | 24 hours automated delivery | 90% time reduction |
| Operational Cost | Manual configuration and troubleshooting | Automated workflows and remediation | 56-81% OpEx savings |
| Capital Efficiency | Manual planning with overprovisioning | AI-driven optimization and utilization | 30% CapEx avoidance |
| Network Capacity Management | Linear staffing with network growth | 4x capacity without proportional staffing | Fundamentally changed economics |
| Competitive Positioning | Standard service delivery timelines | Accelerated time-to-market | 5x win rate improvement |
| Revenue Growth | Constrained by manual processes | Enabled by service agility | 10% revenue uplift |
2. The Multi-Vendor Optical Challenge: Deconstructing Operational Inefficiency
2.1 Current State Analysis: The Siloed Management Paradigm
The contemporary optical transport landscape emerged through best-of-breed vendor selection strategies that optimized hardware performance while inadvertently creating management fragmentation. Operators deployed Ciena's WaveLogic coherent optics for long-haul transmission efficiency, Nokia's photonic service engines for metro aggregation, Infinera's intelligent transport platforms for submarine applications, and Cisco's routed optical networking solutions for IP-optical convergence. Each vendor delivered exceptional performance within their domain, yet provided proprietary network management systems operating as isolated islands with incompatible data models and closed application programming interfaces.
This architectural fragmentation manifests in measurable operational inefficiency. Industry research quantifies that manual configuration and troubleshooting directly attributable to siloed management accounts for 62.5 percent of total network operating costs. Service implementation timelines averaging 5 to 7 weeks reflect the sequential coordination required across multiple vendor-specific management platforms. Network engineers expend 42.3 percent of their time performing routine maintenance tasks that represent prime automation candidates, yet the lack of unified interfaces prevents systematic workflow optimization. Organizations maintain separate teams of vendor-specific specialists, leading to knowledge fragmentation where optical expertise fails to transfer across technology domains despite underlying physical principles remaining constant.
Operational Cost Distribution in Siloed Multi-Vendor Environments
2.2 Operational Inefficiency Quantification: The True Cost of Fragmentation
The financial burden of multi-vendor management fragmentation extends beyond obvious labor inefficiencies into hidden costs that compound operational overhead. Manual processes introduce error rates averaging 2 to 5 percent in configuration changes, with each error triggering rework cycles consuming 4 to 8 hours of engineering time for diagnosis and correction. Service provisioning delays translate directly into revenue delay, with each week of deferred service activation representing lost revenue equivalent to 1.5 to 2 percent of annual contract value. Truck roll economics demonstrate particular impact, with industry standards citing 200 to 300 dollars per dispatch for direct costs, yet comprehensive analysis including opportunity cost, customer dissatisfaction, and lost revenue pushing actual impact toward 1,000 dollars per dispatch. Over 25 percent of truck rolls are considered unnecessary or preventable through enhanced remote diagnostics capabilities that siloed management systems fail to provide.
The knowledge fragmentation penalty manifests in extended mean time to repair metrics and reduced first-time fix rates. When network alarms arise in multi-vendor environments, troubleshooting becomes a laborious multi-layered process requiring manual correlation across separate management systems. An issue detected at the IP routing layer may originate in the optical transport domain, requiring engineers from different teams using different tools to manually piece together information for fault isolation. This process extends mean time to repair from industry-leading 2 to 4 hours achievable in unified environments to 8 to 16 hours typical in fragmented operations. The extended outage duration multiplies customer impact and service level agreement penalties while consuming disproportionate engineering resources.
| Inefficiency Category | Measurement Metric | Siloed Environment Impact | Annual Cost (Mid-size Operator) |
|---|---|---|---|
| Manual Configuration Labor | Engineer hours per service activation | 16-24 hours across multiple systems | $850,000 - $1,200,000 |
| Configuration Error Rework | Error rate and correction time | 2-5% error rate, 4-8 hours per incident | $180,000 - $350,000 |
| Extended MTTR | Mean time to repair | 8-16 hours vs. 2-4 hour target | $420,000 - $680,000 |
| Unnecessary Truck Rolls | Preventable dispatches | 25% of 500 annual rolls at $1,000 each | $125,000 |
| Delayed Service Revenue | Provisioning timeline excess | 4-6 week delay vs. 1 week target | $280,000 - $450,000 |
| Knowledge Fragmentation | Cross-training and turnover cost | Vendor-specific expertise silos | $220,000 - $380,000 |
| Total Annual Impact | Aggregate inefficiency cost | Quantified operational overhead | $2,075,000 - $3,260,000 |
2.3 The IP/Optical Layer Disconnect: A Source of Latent Risk
The operational challenges magnify through the persistent disconnect between IP/MPLS overlay networks and optical transport underlay infrastructure. In typical multi-vendor architectures, IP routing layers operate with no direct insight into real-time performance or operational status of the optical paths they traverse. This separation of IP and optical operations teams, management tools, and data models creates a critical visibility gap that extends beyond inefficiency into direct service impact. When network degradation occurs, the IP layer detects symptoms through packet loss or latency increase, yet lacks visibility into root causes residing in the optical domain such as fiber degradation, amplifier aging, or wavelength interference.
The industry trend toward IP-optical convergence through coherent pluggable optics paradoxically exacerbates this management challenge before unified automation can resolve it. IPoDWDM architectures physically merge IP and optical layers into single router chassis by deploying 400 gigabit, 800 gigabit, and emerging 1.6 terabit coherent pluggables directly into router line cards. While this convergence eliminates dedicated transponder shelves and reduces power consumption, it does not automatically unify management domains. The critical optical performance instrumentation resides within the pluggable optic itself, yet problems frequently originate in the photonic line system managed by separate optical teams using different controllers. This creates an internal failure point where IP operations teams lack tools and expertise to troubleshoot issues originating in the optical layer, while optical teams lack visibility into how their infrastructure impacts higher-layer services.
The visibility gap manifests in extended fault diagnosis timelines and reduced service reliability. When optical signal-to-noise ratio degrades due to fiber aging or amplifier drift, traditional siloed management requires sequential investigation. IP monitoring systems detect increased bit error rates or packet loss. Operations teams must manually correlate these symptoms with optical performance metrics by logging into separate optical management systems, identifying the affected wavelength, correlating it with the service instance, and determining whether the degradation warrants proactive rerouting. This manual correlation process consumes 30 to 90 minutes during which service quality remains degraded. Automated multi-layer correlation through unified management platforms reduces this timeline to seconds by automatically associating IP service instances with their optical transport paths and triggering automated remediation workflows when optical performance thresholds are exceeded.
3. Architectural Blueprint for Unified Automation Ecosystem
3.1 Hierarchical SDN Control Model: The Foundation Architecture
The unified automation ecosystem rests upon a hierarchical Software-Defined Networking control model that addresses the fundamental challenge of multi-vendor integration through systematic abstraction layers. This architecture does not attempt to replace existing vendor-specific network management systems or domain controllers, recognizing that these platforms provide deep functionality optimized for their respective equipment. Instead, the hierarchical model positions a Multi-Domain Service Controller or orchestrator above existing systems, functioning as a manager of managers that maintains unified end-to-end network visibility while leveraging vendor-specific capabilities for detailed device control.
The hierarchical structure consists of four distinct tiers, each serving specific purposes within the automation ecosystem. At the apex resides the Operations Support System and Business Support System layer, where service requests originate from customer portals, enterprise resource planning systems, or network operations center workflows. This OSS/BSS layer communicates service intent using business-level abstractions such as bandwidth on demand, point-to-point private line services, or network slice requirements without concern for underlying implementation details.
The second tier hosts the Multi-Domain Service Orchestrator, which represents the intelligence layer translating business service requests into technical workflows spanning multiple technology domains. This orchestrator maintains a unified network topology model aggregating IP, optical transport, and access domains regardless of vendor equipment deployed in each segment. When receiving a service request for a 100 gigabit Ethernet private line between two data centers, the orchestrator determines the optimal path considering IP routing constraints, optical wavelength availability, and physical fiber topology. It decomposes this high-level service into domain-specific provisioning tasks and coordinates their execution across lower-tier controllers.
Hierarchical Multi-Domain SDN Architecture
The third tier comprises Domain Controllers specific to each technology domain. The IP domain controller manages routing protocols, MPLS label-switched paths, and segment routing configurations across Cisco, Juniper, Nokia, or other IP equipment. The optical domain controller handles wavelength provisioning, ROADM configuration, optical power management, and transponder modulation across Ciena, Nokia, Infinera, or other optical vendors. Each domain controller possesses deep expertise in its technology area, exposing standardized northbound interfaces to the orchestrator while managing vendor-specific nuances in southbound communication with network elements.
The fourth tier contains the actual Network Elements: IP routers, MPLS provider edge devices, coherent transponders, reconfigurable optical add-drop multiplexers, optical amplifiers, and optical channel monitors. These devices receive configuration commands and return operational telemetry through domain controllers using standardized protocols including NETCONF, RESTCONF, and gNMI for modern equipment, with legacy CLI and SNMP interfaces managed through protocol translation layers for older infrastructure.
3.2 Practical Architecture Benefits: Abstraction Enabling Agility
This hierarchical separation delivers concrete operational advantages that justify its architectural complexity. Vendor abstraction at the orchestrator layer allows operations teams to request services using business terminology without requiring detailed knowledge of each vendor's implementation specifics. A service request for 100 gigabit Ethernet private line connectivity receives identical treatment whether implemented using Ciena WaveLogic 5 coherent optics, Nokia PSE-3 photonic service engines, or Infinera ICE6 technology. The orchestrator maintains service-level awareness while delegating vendor-specific configuration to specialized domain controllers.
The architecture enables independent technology evolution within each layer provided interfaces remain stable. The optical domain controller can upgrade to support new modulation formats like probabilistic constellation shaping or time-domain hybrid modulation without requiring changes to the orchestrator or OSS/BSS layers. Similarly, the orchestrator can add new service types or optimization algorithms without modifying domain controller functionality. This separation accelerates innovation velocity by confining changes to appropriate architectural tiers.
3.3 Multi-Domain Orchestration Workflows: Service Lifecycle Automation
The hierarchical architecture enables sophisticated multi-domain workflows that previously required extensive manual coordination. Consider the complete lifecycle for provisioning a 100 gigabit Ethernet private line service between two customer sites separated by 800 kilometers requiring both IP and optical domain resources. The workflow begins when the OSS receives a service request either through customer self-service portal, enterprise sales order management, or network operations center ticket system. This request specifies service endpoints, bandwidth requirements, service level agreement parameters including latency and availability targets, and desired activation timeline.
The multi-domain orchestrator receives this service request through TMF Open API 641 for service ordering and begins decomposition. Path computation analyzes the unified topology model spanning IP and optical layers, identifying feasible routes considering multiple constraints: physical fiber paths with sufficient optical spectrum availability, IP routing domain connectivity between customer sites, latency accumulation across optical regeneration points and IP routing hops, and diversity requirements for protected service configurations. The path computation element selects optimal primary and secondary paths, potentially spanning multiple administrative domains if the service crosses carrier boundaries.
Service decomposition translates the high-level service request into domain-specific provisioning tasks. For the IP domain, this includes configuring Layer 2 or Layer 3 VPN instances on provider edge routers, establishing MPLS label-switched paths with appropriate traffic engineering constraints, and configuring quality of service policies for the customer traffic class. For the optical domain, tasks include provisioning wavelength channels on the DWDM system, configuring transponder operating modes selecting appropriate modulation formats and forward error correction, programming ROADM add/drop ports and wavelength routing paths, and setting optical power levels across amplifier spans to achieve target optical signal-to-noise ratio margins.
The orchestrator invokes domain controllers through standardized northbound interfaces, with each controller translating service intent into vendor-specific device configurations. The optical domain controller might use T-API to request a bidirectional photonic media channel, which it then fulfills by generating device-specific configurations using OpenConfig YANG models for transponders and proprietary models for legacy ROADM equipment. Transaction management ensures atomic service activation where all configuration elements succeed or collectively rollback if any component fails, preventing partial service states that create operational complexity.
| Workflow Phase | Orchestrator Actions | Domain Controller Interactions | Standards/Protocols Used |
|---|---|---|---|
| 1. Service Request | Receive order from OSS/BSS Validate service parameters Check resource availability |
Query inventory systems Retrieve topology data |
TMF API 641 (Service Ordering) TMF API 632 (Party Management) |
| 2. Path Computation | Multi-domain path calculation Constraint evaluation Diversity analysis |
Request topology from controllers Verify spectrum availability |
T-API topology services IETF TE-Topology YANG |
| 3. Service Decomposition | Create domain-specific tasks Generate configuration intent Sequence provisioning steps |
Translate to domain models Prepare device configurations |
TOSCA service templates MEF LSO Legato/Presto |
| 4. IP Domain Config | Request L2/L3 VPN setup MPLS LSP establishment QoS policy application |
IP controller configures PE routers Validates routing convergence |
NETCONF/YANG OpenConfig network-instance Segment Routing models |
| 5. Optical Domain Config | Request wavelength provisioning Specify transponder modes ROADM path setup |
Optical controller configures: • Transponders • ROADMs • Amplifiers |
T-API connectivity service OpenConfig terminal-device OpenConfig optical-transport |
| 6. Validation & Testing | End-to-end connectivity test SLA parameter verification Performance baseline |
Controllers report status Retrieve telemetry data |
gNMI subscriptions NETCONF operational state Y.1731 OAM protocols |
| 7. Service Activation | Update inventory records Enable customer traffic Notify OSS/BSS completion |
Transition to active monitoring Enable alarm correlation |
TMF API 641 state update TMF API 632 party notification |
Post-activation monitoring integrates multi-layer telemetry streams to provide unified service health visibility. The orchestrator subscribes to performance metrics from both IP and optical domains through gNMI streaming telemetry, correlating packet loss rates observed at the IP layer with optical signal-to-noise ratio degradation in the underlying wavelength path. When optical performance degrades below threshold, automated workflows can proactively reroute IP traffic to backup paths before optical signal quality reaches service-affecting levels. This closed-loop automation transforms reactive failure response into proactive service assurance.
4. Standards and Open Interfaces: The Interoperability Foundation
4.1 Standards Landscape Evolution: From Proprietary to Open
The standardization landscape for optical network automation transformed dramatically between 2022 and 2025, evolving from experimental proof-of-concepts into production-grade implementations validated across multiple vendor combinations. This maturation reflects coordinated industry effort through standards development organizations including the Open Networking Foundation, Optical Internetworking Forum, Internet Engineering Task Force, and operator-led initiatives through the OpenConfig consortium and TelecomInfra Project. The convergence on common data models and application programming interfaces enables the multi-vendor automation strategies that were theoretically possible but practically unachievable in earlier timeframes.
OpenConfig emerged as the de facto standard for device-level optical network management through sustained operator investment and vendor adoption. The project defines vendor-neutral YANG data models covering coherent transponders, optical amplifiers, optical channel monitors, wavelength selective switches, and related photonic components. These models reached production maturity with continuous refinement: openconfig-terminal-device version 1.9.2 released June 2024 adds enhanced coherent optics parameters, openconfig-transport-types version 1.1.0 from November 2024 expands optical tributary signal classifications, and openconfig-platform-transceiver version 0.17.0 in July 2025 incorporates 800 gigabit and 1.6 terabit pluggable specifications.
Standards Maturity Timeline and Adoption
Vendor support for OpenConfig optical models progressed from selective implementation to comprehensive coverage across major platforms. Cisco implemented OpenConfig across NCS series platforms including NCS 540, NCS 560, and NCS routers integrating 400ZR coherent pluggables. Ciena's WaveLogic 5 Nano coherent pluggables support OpenConfig terminal device models enabling management through third-party controllers. Nokia's 1830 PSS platforms expose OpenConfig interfaces for both dedicated transponders and router-integrated coherent optics. Infinera's ICE-6 technology and GX Series open line systems provide native OpenConfig and OpenROADM compliance. Juniper's MX and PTX router families support OpenConfig for integrated coherent interfaces. This broad vendor adoption validates OpenConfig as the southbound standard for multi-vendor optical automation.
4.2 Protocol Stack Analysis: NETCONF, RESTCONF, and gNMI
The transport protocols carrying YANG-modeled configuration and telemetry data stratified by use case, with NETCONF, RESTCONF, and gNMI each occupying distinct niches within the automation ecosystem. Understanding their respective strengths guides appropriate protocol selection for specific automation scenarios.
NETCONF provides the foundation protocol for transactional configuration management, defined by IETF RFC 6241 and widely implemented across network equipment. The protocol operates over SSH providing secure transport, uses XML encoding for configuration data and RPC operations, and critically supports candidate configuration datastores enabling operators to prepare complete configurations, validate their correctness, and atomically commit or rollback changes. This transactional capability proves essential for complex multi-element service provisioning where partial configuration states create operational hazards. NETCONF's structured error reporting through RPC error responses enables automated validation and retry logic compared to unstructured CLI parsing.
RESTCONF emerged as a lighter-weight alternative optimized for web-based integration scenarios, defined by IETF RFC 8040. The protocol uses HTTP/HTTPS transport with standard RESTful semantics where GET operations retrieve configuration or state data, POST creates new resources, PUT replaces existing resources, PATCH modifies partial configurations, and DELETE removes resources. RESTCONF supports both XML and JSON encoding, with JSON preferred for modern web applications and microservices architectures. The protocol's HTTP-based approach simplifies integration for developers familiar with web service patterns, though it sacrifices NETCONF's candidate datastore and transaction rollback capabilities for simpler operational semantics.
| Protocol Feature | NETCONF | RESTCONF | gNMI |
|---|---|---|---|
| Primary Use Case | Transactional configuration management | RESTful configuration APIs | Streaming telemetry & config |
| Transport Protocol | SSH (port 830) | HTTP/HTTPS | gRPC over HTTP/2 |
| Encoding | XML | JSON or XML | Protobuf (binary) |
| Data Modeling | YANG | YANG | YANG (with gNMI path notation) |
| Candidate Datastore | ✓ Full support with validate/commit | ✗ Direct commits only | ✗ Direct commits only |
| Atomic Rollback | ✓ Transaction-based | Limited (depends on server) | Limited (depends on target) |
| Streaming Telemetry | Limited (notification subscriptions) | ✗ Polling-based only | ✓ Native streaming with sample/on-change |
| Performance | Moderate (XML overhead) | Moderate (HTTP overhead) | High (binary encoding, HTTP/2 multiplexing) |
| Telemetry Efficiency | Poor for high-frequency polling | Poor for high-frequency polling | Excellent (100x better than NETCONF) |
| Best Application | Service provisioning, bulk config changes | Web app integration, simple config updates | Real-time monitoring, performance telemetry |
gNMI represents the modern evolution optimized for streaming telemetry and high-performance configuration operations, developed by Google and standardized through OpenConfig. The protocol uses gRPC remote procedure call framework over HTTP/2, providing multiplexed bidirectional streaming over a single TCP connection. Binary protocol buffer encoding dramatically reduces message size compared to XML or JSON, while HTTP/2 multiplexing eliminates per-request connection overhead. For telemetry, gNMI delivers performance approximately 100 times better than NETCONF for equivalent data retrieval, making it the preferred protocol for real-time performance monitoring of optical parameters including optical power, pre-FEC and post-FEC bit error rates, chromatic dispersion, and optical signal-to-noise ratio.
gNMI supports multiple subscription modes tailored to different monitoring scenarios. Sample subscriptions deliver telemetry at fixed intervals, appropriate for trending analysis where 10-second or 60-second granularity suffices. On-change subscriptions push updates only when values change, dramatically reducing bandwidth for parameters that update infrequently such as alarm states or administrative configurations. Target-defined subscriptions allow network elements to determine optimal update frequency based on internal change detection, balancing timeliness with efficiency. These flexible subscription models enable operators to optimize telemetry collection for each parameter class rather than applying uniform polling intervals across diverse metrics.
4.3 Transport API (T-API): Northbound Service Abstraction
While OpenConfig and associated protocols address southbound device-level management, the Transport API developed by the Open Networking Foundation provides complementary northbound abstraction for multi-domain service orchestration. T-API defines technology-agnostic models for network topology, connectivity services, and path computation, enabling higher-level orchestrators to request services without detailed knowledge of underlying optical implementations.
T-API version 2.6.0 represents the current production specification, validated through extensive Optical Internetworking Forum demonstrations at OFC conferences during 2024 and 2025. The specification organizes functionality into logical modules: topology service provides network-wide views aggregating nodes, links, and available connectivity across domains; connectivity service enables creation, modification, and deletion of end-to-end connections abstracting underlying provisioning complexity; path computation service calculates optimal routes considering multiple constraints; notification service delivers asynchronous event updates for topology changes or service state transitions; and virtual network service enables creation of overlay topologies for network slicing applications.
The practical value of T-API emerges in multi-domain and multi-vendor scenarios where service requests must span administrative or technology boundaries. Consider a wavelength service provisioned across three operator domains: ingress domain using Ciena optical equipment, middle domain using Nokia infrastructure, and egress domain using Infinera platforms. Without T-API, the originating operator must maintain detailed knowledge of each downstream domain's provisioning interfaces and coordinate service setup through bilateral integrations with each domain controller. With T-API, each domain controller exposes standard connectivity service interfaces, enabling the orchestrator to request service segments using identical API calls regardless of underlying vendor equipment. The domains coordinate end-to-end provisioning through T-API connectivity and notification services, abstracting vendor-specific implementation details.
5. Navigating the Vendor Landscape: Platform Integration Analysis
5.1 Strategic Integration Approach: Leveraging Domain Controllers
The practical implementation of multi-vendor optical network automation requires detailed understanding of how to integrate specific management and control platforms from major optical equipment vendors. The strategic approach does not attempt to replace these vendor platforms, which embody decades of engineering investment and provide deep functionality optimized for their respective hardware. Instead, the integration strategy positions vendor platforms as powerful domain controllers within the broader hierarchical architecture, leveraging their feature-rich capabilities while exposing standardized northbound interfaces for orchestration layer integration.
This pragmatic two-tiered strategy reflects vendor evolution toward openness. Major optical vendors have recognized that network automation teams represent a distinct customer segment requiring programmatic interfaces and developer-friendly tooling. Consequently, vendors now invest heavily in their proprietary platforms for deep hardware-specific functionality while simultaneously opening these platforms through standardized northbound interfaces including Transport API, RESTCONF, and vendor-specific REST APIs. The availability of DevOps toolkits such as Ansible collections, Python libraries, and public developer portals signals a fundamental cultural shift where vendors actively facilitate integration rather than defending proprietary ecosystems.
The domain controller landscape encompasses both modern cloud-native platforms and proven legacy systems with established operational track records. Many operators manage heterogeneous environments where mature legacy management systems including Ribbon's LightSoft, Ciena's OneControl, Nokia's legacy NetAct, and Cisco's legacy CTC coexist with modern automation platforms. These legacy systems often manage mission-critical production services where operational stability and institutional knowledge represent significant value that wholesale replacement risks disrupting. Progressive vendors address this reality through federation architectures enabling coexistence strategies where modern orchestration layers like Ribbon Muse, Ciena Blue Planet, Nokia NSP, or Cisco Crosswork integrate with existing legacy domain controllers through standardized interfaces. This allows operators to preserve stable legacy workflows for mature infrastructure while deploying modern automation for new services and equipment, enabling gradual migration at organizational pace rather than forcing disruptive forklift upgrades that introduce unnecessary operational risk.
🔷 Ciena Blue Planet Intelligent Automation Platform
Market Position: Ciena's Blue Planet portfolio represents a comprehensive OSS automation platform serving 150+ clients globally including 15 Tier-1 service providers. The platform generates projected revenue of 100 to 120 million dollars by 2024, reflecting 55 to 64 percent compound annual growth rate and validating market acceptance of integrated automation solutions.
Architecture: Blue Planet employs cloud-native microservices architecture using TOSCA modeling natively with over 30 open-source components. The platform provides distinct functional modules including Blue Planet Manage Control and Plan for domain control, Blue Planet Orchestration for intent-driven multi-vendor services, Blue Planet Assurance with AI-based analytics and digital twin capabilities, and Blue Planet Inventory for federated data management across multiple systems.
Multi-Vendor Capabilities: The platform exposes T-API version 2.1.3 northbound interface providing network discovery, topology management, and service provisioning capabilities for optical services including OTN-Line and OCH Link services. This standards-based interface has been validated in production integrations with Cisco Crosswork Hierarchical Controller, proving genuine multi-vendor orchestration capability rather than theoretical compatibility.
Automation Tooling: Ciena actively supports DevOps community integration through official Ansible Collection for Blue Planet MCP, enabling programmatic automation of management tasks including discovery, domain management, and T-API interactions. This dual support for both formal service API through T-API and popular automation tool through Ansible makes Blue Planet highly integrable into existing operational workflows.
Analytics Applications: Liquid Spectrum analytics applications automate wavelength provisioning through Wave-Line Synchronizer, capacity adjustment through Liquid Restoration, and performance monitoring across multi-vendor equipment. Field-proven deployments across 150+ clients document 10 to 20 percent operational savings in initial deployments, providing empirical validation of automation value.
Best Fit Scenarios: Service providers focusing on optical and packet transport automation, WAN connectivity services, enterprise managed services, and multi-cloud connectivity find Blue Planet particularly suitable. Notable customers including BT, CenturyLink, Colt, Orange Business Services, Windstream, and Zayo demonstrate the platform's carrier-grade credentials.
🔷 Ribbon Communications Muse & LightSoft
Market Position: Ribbon Communications serves 1,000+ customers across 136 countries through dual portfolio strategy combining modern Muse SDN Domain Orchestrator with proven LightSoft legacy management systems. Major customers including AT&T, Bharti Airtel, BT, Verizon, and Rogers Communications validate carrier-grade capabilities across both legacy and modern network domains.
Muse SDN Domain Orchestrator: Cloud-native platform with containerized microservices delivers complete network and service lifecycle management for multi-layer IP and optical networks. Core applications include Network Controller for real-time topology and service deployment with GMPLS control plane, Network Planner for topology design with CapEx optimization, Network Insights for analytics and performance monitoring, and Network Designer featuring low-code UI enabling network operations teams to create automation workflows without extensive programming through pre-defined Layer 0-3 service catalog. AI Muse Agent innovation enables conversational network querying through natural language processing for intelligent real-time management.
LightSoft Legacy Integration: LightSoft NMS and Vision platforms provide mature network management for SDH/SONET/OTN networks with decades of carrier deployment experience. Ribbon's integration strategy positions Muse as orchestration layer above LightSoft domain controllers, enabling operators to preserve LightSoft expertise for legacy TDM services while gaining modern automation capabilities through Muse for new packet-optical infrastructure. This coexistence approach allows gradual migration at organizational pace rather than forcing disruptive replacements.
Apollo Platform Capabilities: Apollo 9408 delivers industry-leading 25.6 terabit capacity in 2RU with 140 Gbaud 5nm coherent technology achieving exceptional 0.07W/G power efficiency. Native comprehensive TDM support including SDH/SONET hierarchies enables consolidation of legacy and modern services onto unified platforms. Deployment flexibility supports management through either LightSoft or Muse matching operator preferences.
Best Fit Scenarios: Operators with existing LightSoft deployments seeking modern automation without disrupting proven workflows, service providers managing substantial legacy TDM services alongside new packet-optical infrastructure, networks pursuing gradual automation evolution rather than big-bang transformations, and organizations requiring unified management spanning SDH/SONET through 400G/800G coherent optical find Ribbon's portfolio well-suited to transformation requirements.
🔷 Nokia Network Services Platform (NSP)
Market Position: Nokia NSP reaches 1,000+ operator deployments globally, representing the most widely deployed multi-domain network automation platform. Release 24.11 from December 2024 provides unified service automation and network optimization through modular architecture with feature packages enabling customized deployments tailored to operator requirements.
IP-Optical Coordination: NSP manages both IP/MPLS and optical domains through single integrated platform. Network Function Manager handles IP/MPLS domain while WaveSuite NOC manages optical networks, with integrated user interface available since Release 23.11 providing unified operational experience. This tight IP-optical coordination differentiates NSP for operators managing converged transport infrastructure.
Open Integration: The platform supports REST, NETCONF, and RESTCONF APIs for third-party integration, with comprehensive NSP API Programmer Guide detailing platform REST/JSON interfaces. Nokia provides public developer portal with sample code and resources bootstrapping integration efforts, following industry trend toward developer-friendly automation platforms.
Deployment Flexibility: NSP offers modular deployment options spanning IP-only, Optical-only, Control Plane, WAN SDN, or combined IP-plus-Optical configurations. This flexibility allows operators to start with single domain and progressively expand to multi-domain automation as organizational maturity develops.
June 2024 Infinera Acquisition Impact: Nokia's acquisition of Infinera strengthens optical capabilities significantly. Infinera contributed GX G42 TIP Bronze Badge certification, strong NETCONF/YANG/gNMI implementation, ICEX intelligent coherent pluggables supporting 400 gigabit and 800 gigabit, and host-independent management capabilities. This acquisition positions Nokia to offer comprehensive multi-vendor optical portfolio under unified NSP management.
Automation Maturity: NSP reaches Level 4 autonomy on TM Forum automation maturity scale with event-driven architecture supporting closed-loop operations. This maturity level enables self-healing workflows and proactive optimization exceeding basic configuration automation.
Best Fit Scenarios: Service providers with large IP/MPLS plus optical networks, multi-technology environments spanning IP, optical, and microwave, 5G transport automation requirements, and particularly operators with significant Nokia equipment deployments while supporting multi-vendor scenarios find NSP optimal.
🔷 Cisco Crosswork & Network Services Orchestrator (NSO)
Routed Optical Networking Focus: Cisco's automation strategy centers on Converged SDN Transport architecture and Routed Optical Networking convergence delivering documented 35 percent CapEx savings and 57 percent OpEx reduction through IP-optical layer collapse. This value proposition targets operators pursuing architectural transformation rather than automation of existing multi-layer infrastructure.
Hierarchical Architecture: Crosswork Hierarchical Controller powered by Sedona NetFusion acquisition provides multi-domain orchestration above specialized domain controllers. Crosswork Network Controller manages IP domain with segment routing and L2/L3 VPN services. Optical Network Controller handles optical SDN with T-API compliance. This hierarchical separation mirrors the architectural blueprint while maintaining tight integration for converged operations.
NSO Transaction Engine: Network Services Orchestrator provides unique transaction engine enabling atomic changes with rollback capability even for non-transactional devices. This sophisticated state management prevents partial configuration failures that plague simple script-based automation. Network Element Drivers develop in 6 to 8 weeks versus months for traditional adaptors, accelerating multi-vendor integration velocity.
Acacia Coherent Technology: Cisco's 4.5 billion dollar Acacia Communications acquisition in 2021 brought industry-leading coherent DSP technology. CIM 8 modules operating at 130 GBaud achieve 2.4 terabit transponder capacity. 400G ULH QSFP-DD coherent pluggables reach 3,000 kilometer transmission distance. 800G ZR and ZR+ pluggables with 1.6 terabit in development position Cisco at coherent optics forefront, enabling true IP-optical convergence through router-integrated coherent interfaces.
Multi-Vendor Adaptation: Crosswork integration adapters support Nokia NSP and Ciena MCP, enabling heterogeneous optical orchestration even in Cisco-focused environments. This recognizes that greenfield single-vendor deployments remain rare, with most operators managing legacy multi-vendor infrastructure requiring backward-compatible automation strategies.
Best Fit Scenarios: Large service providers modernizing transport networks, converged IP-optical architectural initiatives, multi-vendor environments requiring unified orchestration, and organizations with existing Cisco ecosystem investments find Crosswork and NSO particularly suitable. Strong standards compliance and proven RON deployments provide implementation confidence.
🔷 Infinera Transcend Software Suite
Disaggregation Focus: Infinera Transcend portfolio built around openness and disaggregation principles encompasses Network Automation Suite and Open Optical Toolkit specifically designed for multi-vendor environments. This philosophical commitment to open architectures differentiates Infinera's automation approach from traditional integrated vendor platforms.
Standards Compliance: Transcend controller offers open standards-based RESTful and RESTCONF northbound interfaces for seamless third-party orchestrator integration. Device-level platforms including GX Series provide native NETCONF and gNMI support utilizing standard YANG data models from OpenConfig and OpenROADM. This comprehensive standards support at both controller and device layers maximizes automation flexibility.
Open Line System Architecture: GX Series open line systems enable alien wavelength support where third-party transponders operate over Infinera optical infrastructure. This disaggregation allows operators to select best-of-breed coherent technology while leveraging Infinera's photonic line system engineering, fundamentally changing procurement dynamics from vertically-integrated systems to horizontally-integrated component selection.
Real-World Deployment: NBN Co Australia adopted Infinera Transcend Network Automation Solution to enhance their open-access broadband network, demonstrating production-scale validation of the platform's multi-vendor automation capabilities. This deployment proves that disaggregated automation approaches scale beyond proof-of-concept into carrier-grade operations.
Note on Nokia Acquisition: Following Nokia's June 2024 acquisition of Infinera, the Transcend portfolio integration into Nokia NSP ecosystem progresses. Operators should evaluate whether standalone Infinera Transcend or integrated Nokia NSP deployment better suits their architectural requirements and vendor relationship strategies.
| Platform Feature | Ciena Blue Planet | Nokia NSP | Cisco Crosswork/NSO | Infinera Transcend | Ribbon Muse | ADTRAN Mosaic |
|---|---|---|---|---|---|---|
| T-API Support | ✓ v2.1.3 | ✓ Available | ✓ (as client) | ✓ (via REST NBI) | ✓ Available | ✓ Available |
| OpenConfig Support | ✓ (on devices) | ✓ (on devices) | ✓ (via Data Gateway) | ✓ (native device support) | ✓ (on devices) | ✓ (FSP 3000) |
| Primary NBI Protocol | RESTCONF | RESTCONF / REST | RESTCONF | RESTCONF / REST | REST / RESTCONF | RESTCONF / NETCONF |
| Streaming Telemetry | ✓ gNMI | ✓ gNMI | ✓ gNMI (via Data Gateway) | ✓ gNMI/gRPC | ✓ gNMI | ✓ gNMI |
| DevOps Toolkit | Official Ansible Collection | Developer Portal | SDK, Postman Collections | Open APIs | REST APIs | API Documentation |
| Global Deployments | 150+ clients, 15 Tier-1 | 1,000+ operators | Large Cisco customer base | Growing (post-Nokia acquisition) | 1,000+ customers, 15+ deployments | Strong EMEA/regional presence |
| Key Differentiator | Multi-domain orchestration | Unified IP+Optical platform | RON converged architecture | Open multi-vendor focus | AI/ML + Native TDM + Low-code | Migration-focused approach |
| AI/ML Capabilities | Agentic AI, Liquid Spectrum | ML fiber sensing, predictive | Multi-agentic AI framework | QoT prediction, analytics | AI Muse Agent, what-if analysis | AI radar for at-risk connections |
| TDM Support | Limited legacy support | Via legacy platforms | Limited | Limited | ✓ Native comprehensive SDH/SONET | Legacy migration support |
| Max Line Capacity | Industry-leading per platform | High-capacity solutions | Converged IP-optical | 14.4T compact transponder | 25.6T in 2RU (industry-leading density) | High-density transport |
| Low-Code Automation | Developer-focused | Developer portal | SDK, APIs | Standard APIs | ✓ Muse Network Designer graphical UI | User-friendly interface |
| Best Use Case | Optical/packet transport focus | Large multi-technology networks | IP-optical convergence | Disaggregated architectures | Metro/regional automation | Legacy to automated migration |
5.2 Platform Selection Strategy: Matching Requirements to Capabilities
Strategic platform selection demands careful alignment between operator requirements and vendor platform capabilities. The decision framework considers multiple dimensions beyond simple feature checklists, incorporating network architecture strategy, existing vendor relationships, organizational skill profiles, and long-term technology roadmaps.
For brownfield networks with established multi-vendor optical infrastructure, evaluating Nokia NSP or Ciena Blue Planet for comprehensive multi-vendor management provides highest probability of successful integration. Both platforms demonstrate production-grade multi-vendor support with documented customer deployments and established third-party integrations. Operators prioritizing IP-optical convergence and willing to adopt Cisco's Routed Optical Networking architectural vision should evaluate Crosswork Hierarchical Controller, recognizing this path involves both software automation and architectural transformation delivering combined benefits.
Greenfield deployments and data center network scenarios afford greater architectural flexibility. Cisco RON architecture with Acacia coherent pluggables maximizes integration and delivers vendor-validated CapEx and OpEx savings. For AI/ML interconnect applications requiring 400 gigabit to 1.6 terabit coherent pluggables, standards-based approaches utilizing Lumentum or Coherent Corp transceivers with OpenConfig management enable multi-vendor flexibility from initial deployment.
6. Economic Benefits and ROI Modeling: Quantifying Automation Value
6.1 Total Cost of Ownership Framework: CAPEX and OPEX Analysis
Building credible business cases for multi-vendor optical network automation requires comprehensive total cost of ownership analysis spanning 3 to 5 year horizons. The financial model must account for both initial capital expenditures and ongoing operational expenditures while quantifying both tangible cost savings and strategic business value creation.
Capital expenditure for mid-sized operators implementing comprehensive automation ranges from 400,000 to 1.8 million dollars encompassing multiple cost categories. Software licenses for orchestration platforms range from 200,000 to over 1 million dollars depending on feature scope and network scale. Hardware infrastructure including servers, storage, and networking equipment for hosting automation platforms costs 50,000 to 200,000 dollars. Professional services for initial deployment, integration development, and platform customization range from 100,000 to 500,000 dollars. Initial training programs preparing operations teams for new tools and workflows require 50,000 to 100,000 dollar investment.
Multi-vendor environments command 25 to 50 percent integration premium compared to single-vendor deployments due to protocol diversity requiring multiple adapter development, custom workflow logic accommodating vendor-specific operational modes, and comprehensive testing validating cross-vendor interactions. This premium reflects the additional complexity burden but remains economically justified when compared to vendor lock-in costs and reduced procurement leverage in single-vendor scenarios.
| Cost Category | Mid-Size Operator Range | Large Tier-1 Operator Range | Cost Drivers & Scaling Factors |
|---|---|---|---|
| INITIAL CAPITAL EXPENDITURE (CAPEX) | |||
| Software Licenses | $200,000 - $1,000,000 | $1,500,000 - $5,000,000 | Platform capability, device count, feature modules |
| Hardware Infrastructure | $50,000 - $200,000 | $300,000 - $800,000 | Server/storage capacity, redundancy requirements |
| Professional Services | $100,000 - $500,000 | $800,000 - $2,500,000 | Integration complexity, custom development needs |
| Initial Training | $50,000 - $100,000 | $150,000 - $400,000 | Team size, skill gap magnitude, certification programs |
| Multi-Vendor Premium | +25% - +50% | +25% - +50% | Additional adapter development and testing |
| TOTAL INITIAL CAPEX | $400,000 - $1,800,000 | $2,750,000 - $8,700,000 | Before multi-vendor premium adjustment |
| ANNUAL OPERATIONAL EXPENDITURE (OPEX) | |||
| Software Maintenance | $50,000 - $200,000 | $300,000 - $1,000,000 | Typically 20-25% of license cost annually |
| Continuous Training | $50,000 - $100,000 | $150,000 - $350,000 | $5,000-$10,000 per engineer annually |
| Support Contracts | $25,000 - $75,000 | $100,000 - $250,000 | Vendor support tiers, SLA requirements |
| QA & Testing | $50,000 - $100,000 | $150,000 - $400,000 | Lab infrastructure, testing automation development |
| TOTAL ANNUAL OPEX | $175,000 - $475,000 | $700,000 - $2,000,000 | Scales with network size and complexity |
6.2 Operational Expenditure Savings: Quantifying Efficiency Gains
The compelling financial case for automation emerges primarily through operational expenditure reduction across multiple dimensions. Labor savings from reduced manual effort represent the most immediate and quantifiable benefit category. Industry research indicates network engineers spend approximately 42.3 percent of their time on routine automatable maintenance including configuration backups, compliance checking, and basic provisioning tasks. Automation eliminating 75 percent of this non-value-added work liberates 31.7 percent of engineering capacity for strategic initiatives.
For a mid-sized operator with 20 network engineers at fully-loaded cost of 100,000 dollars annually each, this translates to 634,000 dollars in annual labor savings. Large tier-one operators with 100 engineers realize 3.17 million dollars annual savings from equivalent efficiency gains. These engineers redeploy toward network optimization, architecture planning, and new service development rather than repetitive configuration tasks.
Annual OpEx Savings Breakdown by Category
Truck roll economics deserve particular emphasis given their substantial impact on operational costs. Direct costs of 200 to 300 dollars per truck roll include technician labor, vehicle costs, and travel time. However, comprehensive analysis incorporating indirect expenses including opportunity cost from delayed service activation impacting customer satisfaction and competitive positioning, customer dissatisfaction impact on churn rates with lifetime value implications, and lost revenue during extended outages plus service level agreement penalties pushes true truck roll cost toward 1,000 dollars per dispatch. With over 25 percent of truck rolls considered unnecessary or preventable through enhanced remote diagnostics and proactive monitoring capabilities that siloed management systems fail to provide, automation delivering these capabilities directly attacks this substantial cost center.
A mid-sized operator dispatching 500 truck rolls annually with 25 percent preventable through automation saves 125,000 dollars annually at 1,000 dollar true cost per roll. When site visits remain necessary, automated pre-diagnostics ensure first-time fix rates approaching 95 percent compared to 70 to 80 percent typical with manual diagnosis, eliminating costly repeat dispatches that compound customer frustration and operational expense. The four-metric framework for structured return on investment calculation encompasses acceleration measuring business benefit from time reduction, productivity tracking increased engineer capacity enabling network growth without proportional staffing, efficiency quantifying percentage reduction in effort freeing resources for strategic initiatives, and value calculation accounting for task frequency and volume where high-volume tasks like wavelength provisioning deliver exponentially greater value than low-frequency operations, preventing optimization for rare events while ignoring daily operational friction.
ROI (%) = [(Financial Gain - Investment Cost) / Investment Cost] × 100
where:
Financial Gain = Annual OpEx Savings + CapEx Avoidance + New Revenue
Investment Cost = Initial CapEx + (Annual OpEx × Years)
6.3 Five-Year ROI Projection: Representative Case Study
A representative mid-sized operator case study demonstrates comprehensive financial modeling methodology and typical return characteristics. The operator manages 2,000 optical network elements across multi-vendor infrastructure including Ciena, Nokia, and Infinera equipment. Initial capital investment totals 800,000 dollars encompassing automation platform licenses, hardware infrastructure, professional services for integration, and initial team training. Annual operating expenditure for platform maintenance, continuous training, and quality assurance totals 300,000 dollars.
Hidden Costs and Benefits Impacting Total Value
Comprehensive financial modeling must account for often-overlooked expenses and benefits that significantly impact net return calculations. Hidden costs frequently underestimated in initial business cases include data migration effort requiring dedicated resources for extracting configurations and operational data from legacy systems and transforming to new data models, backup infrastructure maintaining parallel manual capabilities during transition periods creating temporary double-running expenses, temporary performance degradation during learning curves where initial automation attempts may execute slower than experienced manual operators until workflows mature, change management overhead including stakeholder communication and resistance mitigation consuming management attention, and vendor selection time where evaluation processes spanning 6 to 12 months delay benefit realization while consuming evaluation team capacity.
Conversely, overlooked benefits that strengthen automation business cases but resist precise quantification include improved staff morale from eliminating repetitive manual tasks reducing turnover costs averaging 50 to 150 percent of annual salary for specialized network engineers, better compliance posture through consistent automated policy enforcement avoiding regulatory fines that in telecommunications sectors average 2 to 8 million dollars per incident, enhanced security preventing breach costs averaging 4 million dollars per incident through automated vulnerability scanning and rapid patch deployment, knowledge preservation through comprehensive documentation and infrastructure-as-code practices preventing knowledge loss when experienced staff depart, and scalability enabling growth without proportional staffing increases fundamentally changing network economics at scale.
5-Year Financial Projection and ROI Evolution
Annual benefits accumulate across four categories totaling 1.2 million dollars. Labor savings from 30 percent reduction in 2 million dollar annual operations cost yields 600,000 dollars annually. Truck roll reduction eliminating 125 preventable dispatches at 1,000 dollar true cost saves 125,000 dollars annually. Network utilization improvements through AI-driven capacity optimization deferring 150,000 dollars in equipment purchases contributes 150,000 dollars annual benefit. New revenue opportunities from accelerated service delivery and improved win rates generate 200,000 dollars incremental annual revenue.
The five-year total cost of ownership calculation combines initial capital investment of 800,000 dollars plus cumulative operating expenditure of 1.5 million dollars over five years, totaling 2.3 million dollars investment. Cumulative benefits of 6 million dollars over the same period yield net benefit of 3.7 million dollars and 161 percent return on investment. Payback occurs within 1.92 years when cumulative benefits exceed cumulative costs, providing strong justification for executive approval and investment prioritization.
7. Implementation Roadmap: Phased Deployment Strategy
7.1 The Crawl-Walk-Run Methodology: Progressive Maturity Development
Successful automation deployment spans 24 to 36 months across three distinct phases following the crawl-walk-run maturity model. This progressive approach builds organizational capability while delivering measurable value at each stage, preventing the overwhelming complexity and stakeholder resistance that plague comprehensive big-bang automation attempts. Deutsche Telekom's multi-vendor O-RAN deployment experience emphasizes that integration complexity requires tight alignment between vendors with designated system integrators providing essential end-to-end understanding, validating the phased approach necessity.
The crawl-walk-run progression represents more than temporal sequencing; it reflects fundamental transformation in operational mentality from ad-hoc reactive tasks toward proactive building of reusable automation assets. Each phase establishes prerequisite capabilities and organizational confidence enabling subsequent phase complexity. Attempting to implement closed-loop AI-driven optimization without first establishing reliable configuration management and telemetry collection infrastructure creates technical debt that undermines automation program credibility when early failures occur.
| Phase | Timeline | Primary Objectives | Key Deliverables | Success Metrics |
|---|---|---|---|---|
| Phase 1: CRAWL Foundation & Visibility |
Months 0-6 | • Establish infrastructure • Build core team • Prove automation value • Non-disruptive monitoring |
• Automation platform deployed • Unified inventory database • Configuration backup system • Read-only compliance checks |
• Complete topology visibility • 100% config backup coverage • Team skills baseline established • Quick win demonstrated |
| Phase 2: WALK Configuration Control |
Months 6-18 | • Activate configuration mgmt • Automate provisioning • Integrate with ITSM • Deploy guardrails |
• SDN controller hierarchy • Automated service provisioning • Pre/post-change validation • ITSM workflow integration |
• 75% provisioning time reduction • 50% error rate decrease • ITSM integration complete • Pilot domain successful |
| Phase 3: RUN Closed-Loop Automation |
Months 18-36 | • Implement intent-based networking • Enable self-healing • Deploy AI/ML optimization • Offer self-service |
• Closed-loop remediation • Predictive maintenance • AI-driven optimization • Service catalog portal |
• <2 min mean time to repair • 90%+ proactive incident prevention • Self-service adoption >50% • Full ROI achievement |
7.2 Phase 1: Crawl - Foundation Establishment (Months 0-6)
The crawl phase focuses on building automation infrastructure and achieving quick wins without touching production configurations, minimizing risk while demonstrating value. Network inventory audits document existing multi-vendor equipment comprehensively including all transponders, ROADMs, amplifiers, and management systems currently deployed. Skills assessment evaluates team capabilities across SDN concepts, API programming, Python scripting, and optical domain knowledge, identifying gaps requiring targeted training investment.
Business objectives translate into specific measurable key performance indicators. Target 50 to 81 percent provisioning cost reduction based on Nokia-Analysys Mason benchmarks. Aim for 10 percent revenue increase from faster service delivery. Improve service level agreement compliance metrics reducing penalty exposure. These quantified objectives justify investment and provide success measurement framework.
Infrastructure preparation deploys read-only monitoring and telemetry systems observing network state without modification risk. Source-of-truth databases using NetBox or Git repositories establish version control for configurations providing rollback reference. Initial automation orchestration platforms install in laboratory environments for team familiarization without production impact. Basic automation delivers automated discovery for comprehensive network topology mapping, configuration backup with versioning preventing configuration loss, read-only compliance checking identifying configuration drift, and automated network health reporting providing operational visibility dashboard.
7.3 Phase 2: Walk - Active Configuration Management (Months 6-18)
The walk phase introduces active configuration changes through controlled automation workflows, building on the visibility foundation established during crawl phase. SDN controller deployment follows hierarchical architecture with domain controllers for IP and optical domains coordinated by hierarchical controller for multi-layer optimization. IP domain controller might be Cisco Crosswork or Nokia NSP managing routing protocols and MPLS. Optical domain controller could be Cisco ONC or Nokia WaveSuite managing wavelength provisioning and ROADM configuration.
Standards adoption implements Transport API for northbound orchestrator-to-controller interfaces and OpenConfig for device-level southbound control. Controllers connect to existing vendor EMS and NMS platforms through standard APIs where available, with custom adapters developed for legacy systems lacking standard interfaces. This pragmatic approach balances standards adherence with brownfield reality of managing installed equipment base.
Automated service provisioning begins with template-based configuration generation for common services including Layer 2 VPN, wavelength provisioning, and optical channel setup. Pre-change validation runs automatically verifying configuration syntax, checking resource availability, and confirming no conflicts with existing services. Post-change validation executes automatically after provisioning, testing end-to-end connectivity and verifying service level agreement parameters. Predefined failure conditions trigger automated rollback to last known-good state, preventing partial service configurations that create operational complexity.
Pilot deployment strategy selects stable non-critical network segments for initial automation rollout. Test laboratory or single metro region with 5 to 10 sites provides controlled environment for workflow validation. Parallel operation runs automated and manual processes simultaneously during validation period, measuring success through provisioning time reduction targeting 75 percent improvement and error rate decrease. Integration testing demands dedicated laboratory infrastructure or virtual network instances preventing production impact during development cycles.
7.4 Phase 3: Run - Closed-Loop Optimization (Months 18-36)
The run phase implements intent-based networking where administrators define service intent and systems determine optimal implementation automatically. Self-healing capabilities automate fault detection, diagnosis, and remediation without human intervention. Dynamic optimization performs real-time traffic engineering based on network conditions. Predictive maintenance uses machine learning models for component failure prediction, with Verizon documenting prevention of hundreds of incidents through this proactive approach.
AI and machine learning integration targets quality-of-transmission estimation using trained models for optical path feasibility assessment, reducing design time from hours to minutes as demonstrated by NTT and NEC in COSMOS testbed deployment. Anomaly detection employs pattern recognition for network behavior deviations identifying issues before service impact. Capacity planning leverages predictive analytics for bandwidth requirement forecasting. Automated QoT margin management adjusts link capacity based on real-time signal-to-noise ratio measurements, with Microsoft Research documenting potential 75 percent capacity increases through dynamic margin optimization.
8. Building the Automation Team: Structure, Skills, and Sizing
8.1 The NetDevOps Paradigm: Cultural and Methodological Transformation
Successful network automation implementation depends as much on people and processes as on technology platforms. The transition from traditional manual network operations to modern automated paradigms requires deliberate and strategic approach to building teams with appropriate structure, skills, and culture. The biggest challenge in this transformation frequently resides not in technology complexity but in fostering new organizational culture and developing necessary hybrid skills bridging network engineering and software development domains.
The NetDevOps methodology applies DevOps principles including continuous integration, continuous delivery, and infrastructure-as-code to network infrastructure management. This approach breaks down traditional silos separating network engineering, software development, and IT operations teams, creating collaborative environment where network infrastructure can be managed programmatically as code. The fundamental goal transforms network operations from manual configuration through command-line interfaces toward programmatic management through application programming interfaces, enabling version control, automated testing, and rapid deployment workflows familiar to software development but revolutionary for network operations.
8.2 Evolving Team Structure: From Core Team to Formal Organization
Successful team structure evolution parallels the phased implementation progression from crawl to walk to run maturity levels. The initiative begins with small agile highly-skilled Automation Core Team of 3 to 5 individuals acting as catalyst for entire program. This core team requires strong decision-making authority and clear executive sponsorship to overcome initial organizational inertia and political resistance from teams comfortable with traditional operational models.
The Automation Core Team comprises three essential roles with distinct responsibilities and skill profiles. The Network Architect provides deep domain expertise on multi-vendor optical network infrastructure, defines architectural standards governing automation implementation, and validates technical feasibility of automation use cases ensuring workflows align with network operational reality. The Service Developer or Software Engineer brings software development proficiency including Python programming, API integration expertise, and data modeling capability, taking responsibility for building and testing automation workflows that translate network operations into executable code. The Product Owner represents critical but often overlooked role borrowed from agile software development methodologies, managing automation backlog by prioritizing use cases based on business value, acting as liaison between technical team and internal customers including network operations teams, and ensuring the team remains focused on delivering tangible business outcomes rather than pursuing technically interesting but low-value automation projects.
| Team Evolution Phase | Team Size | Key Roles | Primary Focus |
|---|---|---|---|
| Phase 1: Core Team (Months 0-6) |
3-5 FTEs | • Network Architect • Service Developer • Product Owner • Part-time DevOps support |
• Prove automation value • Build initial workflows • Establish credibility • Create foundation |
| Phase 2: Automation Group (Months 6-18) |
5-8 FTEs | • Automation Architect • 2-3 Automation Engineers • DevOps Engineer • QA/Test Lead • Business Analyst |
• Scale automation scope • Expand use cases • Formalize processes • Build CI/CD pipeline |
| Phase 3: Mature Organization (Months 18-36+) |
10-15+ FTEs | • Senior Automation Architect • Domain Lead Engineers (IP, Optical) • 4-6 Automation Engineers • 2 DevOps Engineers • SRE Engineers • Technical PM |
• Closed-loop automation • Self-service enablement • AI/ML integration • Continuous innovation |
8.3 Essential Skills Matrix: Balancing Network and Software Expertise
Building successful NetDevOps team requires recognizing that attempting to retrain all network engineers as expert software developers represents unrealistic goal. Instead, the strategic approach creates team with diverse and complementary skill mix where deep network domain expertise combines with modern software development capabilities. The skills matrix balances three domains with network engineering forming 40 to 50 percent of essential skillset, software development contributing 30 to 40 percent, and DevOps and automation tools comprising remaining 30 percent.
Network engineering foundation remains critical providing deep understanding of IP/MPLS routing and switching architectures, optical transport technologies including DWDM and OTN, Ethernet protocols and quality of service mechanisms, network protocols encompassing BGP, OSPF, IS-IS, RSVP-TE, and Segment Routing, multi-vendor equipment operational knowledge covering Ciena, Nokia, Infinera, Cisco platforms, and traditional command-line interface experience enabling engineers to validate automated configurations against manual reference implementations.
Software development capabilities center on Python as primary automation language with 3 to 6 months minimum experience for entry-level positions and 2 plus years for senior roles. Understanding REST APIs including HTTP methods, JSON and XML payloads, and authentication mechanisms enables integration with vendor platforms and orchestration systems. Git version control represents mandatory skill for collaborative development and configuration versioning. Data format proficiency across YAML, JSON, and XML allows engineers to work effectively with configuration templates and API payloads.
Skill Distribution Across Team Maturity Phases
Advanced team members master data modeling through YANG and OpenConfig for multi-vendor network management, NETCONF and RESTCONF protocols for configuration operations, TOSCA service modeling for orchestration platforms, and TMF APIs for service provider operations. This specialized knowledge differentiates senior engineers capable of architecting solutions from junior engineers implementing established patterns.
Role definitions clarify responsibilities and compensation expectations across team hierarchy. Automation Architects commanding 150,000 to 200,000 dollar plus compensation design end-to-end architecture, select tools and platforms for multi-vendor strategy, define automation standards and best practices, and interface with business stakeholders, requiring 7 plus years network engineering experience combined with 3 plus years automation expertise and deep multi-vendor knowledge. Network Automation Engineers spanning entry level at 90,000 to 110,000 dollars, mid-level at 125,000 to 175,000 dollars, and senior positions at 175,000 to 215,000 dollars develop automation scripts and workflows, implement orchestration platform integrations, build and maintain automation frameworks, and create configuration templates, requiring strong Python and Ansible skills, REST API proficiency, 2 plus years software development experience, and comprehensive network protocol knowledge. DevOps Engineers with network focus earning 120,000 to 180,000 dollars build CI/CD pipelines for network automation, manage automation platform infrastructure, implement monitoring and logging systems, and develop testing frameworks, requiring Linux administration expertise, Git proficiency, CI/CD tool experience, Python and Ansible skills, and foundational networking knowledge.
8.4 Training Investment and Career Development Paths
Training investments prove essential for capability building with recommended allocation of 5,000 to 10,000 dollars per employee annually for training, certifications, and continuous learning. This substantial investment demonstrates organizational commitment to skill transformation while accelerating team capability development beyond what on-the-job experience alone provides.
Cisco DevNet certifications span multiple levels providing structured learning path. DevNet Associate certification exam 200-901 DEVASC covers entry-level topics including Python programming, API fundamentals, and Ansible basics providing foundation for automation beginners. DevNet Professional certification requires passing 350-901 DEVCOR core exam plus concentration exam in specific domain, targeting advanced automation practitioners with substantial hands-on experience. DevNet Expert represents pinnacle certification requiring 8-hour laboratory exam demonstrating comprehensive automation mastery across design, development, and troubleshooting domains.
Juniper's automation certification path includes JNCIA-DevOps Associate level covering Junos automation fundamentals, Python scripting, REST APIs, and YANG data models, plus JNCIS-DevOps Specialist level for advanced practitioners demonstrating deeper automation expertise. Both certifications maintain 3-year validity requiring recertification demonstrating continued skills currency.
Kirk Byers' Python for Network Engineers courses provide vendor-neutral practical training widely regarded as industry best practice. The 8-week Netmiko course teaches SSH library fundamentals for CLI automation. The 6-week Nornir framework course covers advanced Python automation framework delivering superior performance compared to Ansible for complex workflows. The 8-week Ansible Network Automation course provides comprehensive foundation in most popular network automation tool.
9. Risk Assessment and Mitigation Strategies
9.1 Multi-Vendor Specific Risks: Complexity and Coordination Challenges
Multi-vendor automation introduces failure modes and operational risks absent in homogeneous single-vendor environments. Interoperability issues between vendors create scenarios where individually-conformant implementations fail when integrated due to subtle differences in standards interpretation or feature support variations. Inconsistent feature availability across platforms forces automation workflows to implement conditional logic accommodating vendor-specific capabilities, increasing code complexity and maintenance burden. Complex troubleshooting spanning vendor boundaries requires engineers to correlate symptoms across multiple management systems when root cause diagnosis spans equipment from different manufacturers. Coordination overhead for software upgrades multiplies when ensuring compatibility across multi-vendor automation stack requires synchronized vendor release planning and extensive integration testing.
The August 2024 OIF demonstrations at OFC conferences tested multi-vendor interoperability across critical operational scenarios providing empirical validation of standards maturity. Test cases included network discovery operations aggregating topology from heterogeneous equipment, end-to-end service provisioning with state management across vendor boundaries, inventory management spanning physical and logical layers from multiple vendors, maintenance operations with service modification through standardized interfaces, subscription-based notifications for events across multi-vendor infrastructure, and OAM performance monitoring for troubleshooting using common data models. These demonstrations proved production-readiness of standards-based multi-vendor automation while revealing edge cases requiring vendor-specific handling.
9.2 Comprehensive Testing Framework: Pre-Deployment Validation
Systematic risk mitigation addresses multi-vendor complexity through structured testing regimen spanning multiple validation layers before production deployment. Pre-deployment testing mirrors production environments in dedicated laboratories with minimum 3 to 5 representative nodes from each vendor. Virtual testing using vendor simulators and open-source tools including GNS3 and Containerlab validates automation logic before hardware touchpoints, enabling rapid iteration during development without consuming physical lab resources or risking production impact.
| Risk Category | Specific Threats | Mitigation Strategies | Validation Methods |
|---|---|---|---|
| Interoperability Failures | • Standards interpretation differences • Feature support variations • API version incompatibilities |
• Multi-vendor lab testing • OIF demonstration participation • Vendor certification programs |
• End-to-end service tests • Cross-vendor topology discovery • Multi-domain provisioning validation |
| Configuration Errors | • Incorrect syntax generation • Resource conflicts • State inconsistencies |
• Pre-change validation • Automated syntax checking • Configuration templates • Peer review processes |
• Template unit testing • Dry-run validation • Rollback testing • Golden config comparison |
| Performance Degradation | • API rate limiting • Scale limitations • Latency accumulation |
• Load testing at scale • Performance monitoring • Capacity planning • Gradual rollout |
• Stress testing tools • Production-scale simulations • KPI baseline comparison • Canary deployments |
| Security Vulnerabilities | • API credential exposure • Unauthorized access • Code injection attacks |
• Secrets management (Vault) • Role-based access control • Code security scanning • Network segmentation |
• Penetration testing • Vulnerability scanning • Access audit logs • Security code review |
| Skill Gaps | • Insufficient automation expertise • Knowledge fragmentation • Turnover impact |
• Comprehensive training programs • Documentation standards • Knowledge transfer sessions • Redundant skill coverage |
• Skills assessments • Code review quality • Documentation completeness • Cross-training validation |
| Vendor Lock-in Risk | • Proprietary extensions dependency • Migration difficulty • Reduced negotiating leverage |
• Standards-first architecture • Abstraction layers • Multi-vendor testing • Contractual protections |
• Portability testing • Vendor substitution exercises • Architecture reviews • Standards compliance audits |
9.3 Automated Rollback and Recovery Mechanisms
Post-deployment validation and automated rollback capabilities provide critical safety net when automation changes produce unexpected results. Automated golden signal monitoring tracks four essential service health metrics: latency measuring end-to-end delay characteristics, error rates quantifying packet loss and bit errors, saturation indicating resource utilization approaching capacity limits, and traffic volume confirming expected service usage patterns. Service-level validation verifies SLA parameters including committed bandwidth, maximum latency thresholds, and jitter specifications remain within contractual bounds.
Automated rollback triggers activate when predefined failure conditions occur including failed post-change validation where automated tests detect configuration errors or service disruption, service KPI degradation beyond acceptable thresholds such as latency increase exceeding 5 percent or error rate elevation above baseline, alarm storms indicating systemic issues when more than X alarms generate within Y seconds window, or manual operator intervention when engineers observing anomalous behavior invoke emergency rollback procedures.
Rollback implementation mechanisms provide configuration reversion to last known-good state targeting 1 to 3 minute recovery timelines. Version control integration through Git enables instant revert capability by checking out previous configuration commits and reapplying to affected devices. Database decoupling deploys schema changes hours or days before application changes enabling 3-minute recovery strategies where database rollback proceeds independently from application configuration restoration. Canary deployments roll changes to 5 percent of network infrastructure first, monitoring results for predetermined validation period, then proceeding with full rollout if successful or aborting if issues manifest, preventing widespread impact from problematic changes.
10. Strategic Recommendations for Network Operations Leaders
10.1 Immediate Action Items: Initiating the Automation Journey
Network operations leaders should commence automation initiatives immediately rather than waiting for perfect conditions that never materialize. The strategic imperative stems from operational necessity as network complexity exceeds human-scale manual management capability. Operators lacking automation capabilities cannot match service velocity, operational efficiency, or cost structures of automated competitors, transforming automation from competitive advantage to competitive survival requirement.
Begin with non-disruptive monitoring and read-only operations proving automation value without production configuration risk. Deploy automated network discovery and topology mapping providing unified visibility across multi-vendor infrastructure. Implement automated configuration backup with version control preventing configuration loss and enabling change tracking. Establish read-only compliance checking identifying configuration drift from standards without modifying device state. These foundational capabilities demonstrate immediate value while building organizational confidence and technical expertise for subsequent active configuration management phases.
10.2 Platform and Vendor Selection Guidance
Platform selection demands alignment between operator requirements and vendor platform capabilities considering network architecture strategy, existing vendor relationships, organizational skill profiles, and long-term technology roadmaps. For brownfield networks with established multi-vendor optical infrastructure, evaluate Nokia NSP or Ciena Blue Planet for comprehensive multi-vendor management with production-validated deployments. Operators prioritizing IP-optical convergence should assess Cisco Crosswork recognizing this involves both software automation and architectural transformation toward Routed Optical Networking delivering combined benefits.
Standards-based approaches prioritize vendors with TIP OOPT MUST badges including Infinera/Nokia and Adtran, comprehensive OpenConfig YANG model support across terminal devices and optical transport components, and OIF compliance for coherent pluggables enabling alien wavelength and open line system strategies. Greenfield deployments afford architectural flexibility where Cisco RON with Acacia coherent pluggables maximizes integration, while Lumentum or Coherent Corp transceivers with OpenConfig management enable multi-vendor flexibility from initial deployment.
Regional considerations influence vendor selection with North American operators traditionally favoring Cisco, Ciena, and Nokia platforms, European operators adding Adtran strength particularly in access and aggregation domains, and Asian markets seeing strong Huawei, ZTE, and Fujitsu presence domestically though export restrictions limit some vendors' global reach. Understanding regional vendor ecosystems and support capabilities informs realistic deployment planning and risk assessment.
10.3 Industry Participation and Standards Development
Active participation in industry organizations accelerates individual operator automation success while strengthening ecosystem-wide standardization. TIP OOPT (Telecom Infra Project Open Optical Packet Transport) working group develops disaggregated optical networking specifications with MUST requirement compliance badges validating multi-vendor interoperability. OpenROADM MSA (Multi-Source Agreement) defines open interfaces for ROADM networks enabling alien wavelength support and vendor-neutral optical line systems. OIF (Optical Internetworking Forum) conducts live multi-vendor demonstrations validating standards implementation across SDN controllers, optical equipment, and orchestration platforms.
Operators should share lessons learned and operational experiences through industry forums preventing duplicate effort across operator community and influencing standards development toward practical operational requirements rather than theoretical ideals. Publishing case studies, participating in interoperability demonstrations, and contributing to open-source automation projects accelerates ecosystem maturation benefiting all participants through improved vendor implementations and reduced integration costs.
Strategic Priority Roadmap: 2025-2028
10.4 Key Performance Indicators and Success Measurement
Rigorous measurement through defined KPIs demonstrates automation ROI to stakeholders and guides continuous improvement. Provisioning time reduction from baseline 5 to 7 weeks targeting 75 to 90 percent improvement reaching 24 to 48 hour service activation provides direct service delivery impact measurement. Mean time to repair reduction from baseline 8 to 16 hours targeting sub-2-hour fault resolution through automated diagnosis and remediation quantifies operational efficiency gains. Configuration error rate decrease from 2 to 5 percent baseline targeting below 0.5 percent through automated validation demonstrates quality improvement. OpEx reduction measuring 30 to 56 percent savings across labor, truck rolls, and operational overhead validates financial business case. New revenue enablement tracking incremental revenue from accelerated time-to-market and improved competitive positioning quantifies top-line business impact.
Establish baseline metrics before automation implementation enabling accurate improvement quantification. Implement automated KPI collection and reporting preventing manual measurement overhead. Review metrics monthly with stakeholders demonstrating progress and maintaining program momentum. Adjust automation priorities based on KPI trends focusing effort on highest-impact opportunities.
11. Conclusion and Future Directions
11.1 Key Contributions and Strategic Findings
This comprehensive analysis synthesized insights from 88 global operator deployments, real-world field trials, and detailed vendor platform documentation establishing that multi-vendor optical network automation transitioned from experimental vision to production imperative between 2022 and 2025. The research validates that standards maturity through OpenConfig, NETCONF/YANG, and ONF Transport API enables genuine multi-vendor interoperability as demonstrated by BT Group's August 2024 validation with Ciena and continuous OIF demonstrations at OFC conferences.
Financial analysis proves compelling business case with documented 50 to 81 percent operational expenditure savings, 30 to 35 percent capital expenditure reduction, and ROI payback periods under 2 years for representative mid-sized operators. The five-year projection modeling 161 percent return on investment with 1.92-year payback provides quantitative justification for executive investment approval. These benefits stem from labor savings through automated provisioning, truck roll reduction via remote diagnostics, network utilization improvements deferring equipment purchases, and new revenue opportunities from accelerated service delivery.
Phased implementation following crawl-walk-run methodology mitigates risk while building organizational capability. Attempting comprehensive big-bang deployment risks overwhelming teams and generating stakeholder resistance when early failures occur. The progressive approach starting with non-disruptive monitoring, advancing to controlled provisioning automation, then achieving closed-loop optimization with AI/ML proves successful across operator deployments from Deutsche Telekom to AT&T to NTT.
11.2 Implications for Network Operations Practice
The transition to automated operations fundamentally transforms network operations department role from reactive cost center to strategic business enabler. Rather than eliminating positions, automation changes the cost-capacity curve enabling existing teams to manage networks four times larger as documented in AI-driven network management studies. Cisco's DNA automation research quantified 67 percent reduction in design, provisioning, and maintenance time freeing 40 percent of worker capacity for strategic initiatives rather than repetitive tasks.
This capacity liberation allows operators to absorb traffic growth and service complexity without proportional staffing increases. The skills transformation from traditional NetOps to NetDevOps methodologies requires sustained training investment of 5,000 to 10,000 dollars per engineer annually but delivers workforce capable of implementing software-driven network operations. Organizations successfully navigating this transformation build hybrid teams where deep network domain expertise combines with modern software development capabilities rather than attempting unrealistic goal of retraining all network engineers as expert software developers.
11.3 Future Research Directions and Technology Evolution
Several critical areas warrant continued research and industry focus as multi-vendor automation matures. AI and machine learning integration for optical networks remains in early stages with significant potential for quality-of-transmission prediction, automated capacity optimization, and predictive maintenance. Cloud provider surveys cite lack of mature open AI products and persistent interoperability challenges as major barriers requiring industry collaboration to develop vendor-neutral AI platforms aggregating and analyzing data from entire multi-vendor ecosystem.
Coherent pluggable optics evolution toward 800 gigabit and 1.6 terabit capacities demands corresponding automation advancement to manage increasing complexity of modulation formats, forward error correction schemes, and power optimization across ultra-high-speed interfaces. The OpenConfig terminal-device model continuous enhancement incorporating new coherent specifications ensures standards keep pace with technology evolution.
IPv6 transition and SRv6 (Segment Routing over IPv6) deployment create opportunities for tighter IP-optical integration where segment routing policies can directly influence optical path selection and optimization. Standards development addressing this multi-layer optimization including IETF work on ACTN (Abstraction and Control of TE Networks) optical transport management enables sophisticated cross-layer automation scenarios.
Quantum networking and quantum-safe encryption integration into optical networks introduces new automation requirements for quantum key distribution management, quantum channel provisioning, and post-quantum cryptography deployment across multi-vendor infrastructure. Early standards development in these emerging areas positions operators to automate quantum-enabled services from initial deployment rather than retrofitting automation to manually-managed quantum infrastructure.
Developed by MapYourTech Professional Solutions