Tag

Optical signal integrity

Browsing

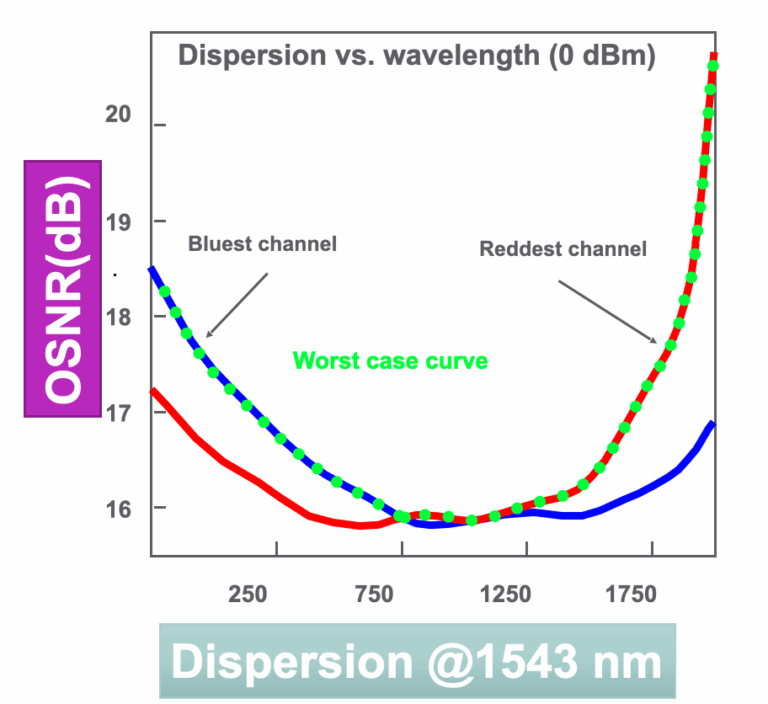
In a non-coherent WDM system, each optical channel on the line side uses only one binary channel to carry service information. The service transmission rate on each optical channel is called bit rate while the binary channel rate is called baud rateIn this sense, the baud rate was equal to the bit rate. The spectral width of an optical signal is determined by the baud rate. Specifically, the spectral width is linearly proportional to the baud rate, which means a higher baud rate generates a larger spectral width.

  • Baud (pronounced as /bɔ:d/ and abbreviated as “Bd”) is the unit for representing the data communication speed. It indicates the signal changes occurring in every second on a device, for example, a modulator-demodulator (modem). During encoding, one baud (namely, the signal change) actually represents two or more bits. In the current high-speed modulation techniques, each change in a carrier can transmit multiple bits, which makes the baud rate different from the transmission speed.

In practice, the spectral width of the optical signal cannot be larger than the frequency spacing between WDM channels; otherwise, the optical spectrums of the neighboring WDM channels will overlap, causing interference among data streams on different WDM channels and thus generating bit errors and a system penalty.

For example, the spectral width of a 100G BPSK/DPSK signal is about 50 GHz, which means a common 40G BPSK/DPSK modulator is not suitable for a 50 GHz channel spaced 100G system because it will cause a high crosstalk penalty. When the baud rate reaches 100 Gbaud/s, the spectral width of the BPSK/DPSK signal is greater than 50 GHz. Thus, it is impossible to achieve 50 GHz channel spacing in a 100G BPSK/DPSK transmission system.

(This is one reason that BPSK cannot be used in a 100G coherent system. The other reason is that high-speed ADC devices are costly.)

A 100G coherent system must employ new technology. The system must employ more advanced multiplexing technologies so that an optical channel contains multiple binary channels. This reduces the baud rate while keeping the line bit rate unchanged, ensuring that the spectral width is less than 50 GHz even after the line rate is increased to 100 Gbit/s. These multiplexing technologies include quadrature phase shift keying (QPSK) modulation and polarization division multiplexing (PDM).

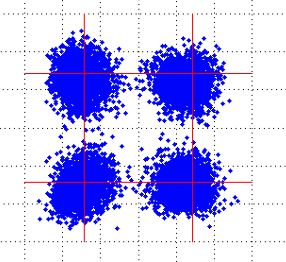
For coherent signals with wide optical spectrum, the traditional scanning method using an OSA or inband polarization method (EXFO) cannot correctly measure system OSNR. Therefore, use the integral method to measure OSNR of coherent signals.

Perform the following operations to measure OSNR using the integral method:

1.Position the central frequency of the wavelength under test in the middle of the screen of an OSA.
2.Select an appropriate bandwidth span for integration (for 40G/100G coherent signals, select 0.4 nm).
3.Read the sum of signal power and noise power within the specified bandwidth. On the OSA, enable the Trace Integ function and read the integral value. As shown in Figure 2, the integral optical      power (P + N) is 9.68 uW.
4.Read the integral noise power within the specified bandwidth. Disable the related laser before testing the integral noise power. Obtain the integral noise power N within the signal bandwidth      specified in step 2. The integral noise power (N) is 29.58 nW.
5.Calculate the integral noise power (n) within the reference noise bandwidth. Generally, the reference noise bandwidth is 0.1 nm. Read the integral power of central frequency within the bandwidth of 0.1 nm. In this example, the integral noise power within the reference noise bandwidth is 7.395 nW.
6.Calculate OSNR. OSNR = 10 x lg{[(P + N) – N]/n}

In this example, OSNR = 10 x log[(9.68 – 0.02958)/0.007395] = 31.156 dB

osnr


We follow integral method because Direct OSNR Scanning Cannot Ensure Accuracy because of the following reason:

A 40G/100G signal has a larger spectral width than a 10G signal. As a result, the signal spectrums of adjacent channels overlap each other. This brings difficulties in testing the OSNR using the traditional OSA method, which is implemented based on the interpolation of inter-channel noise that is equivalent to in-band noise. Inter-channel noise power contains not only the ASE noise power but also the signal crosstalk power. Therefore, the OSNR obtained using the traditional OSA method is less than the actual OSNR. The figure below shows the signal spectrums in hybrid transmission of 40G and 10G signals with 50 GHz channel spacing. As shown in the figure, a severe spectrum overlap has occurred and the tested ASE power is greater than it should be .As ROADM and OEQ technologies become mature and are widely used, the use of filter devices will impair the noise spectrum. As shown in the following figure, the noise power between channels decreases remarkably after signals traverse a filter. As a result, the OSNR obtained using the traditional OSA method is greater than the actual OSNR..


Q is the quality of a communication signal and is related to BER. A lower BER gives a higher Q and thus a higher Q gives better performance. Q is primarily used for translating relatively large BER differences into manageable values.

Pre-FEC signal fail and Pre-FEC signal degrade thresholds are provisionable in units of dBQ so that the user does not need to worry about FEC scheme when determining what value to set the thresholds to as the software will automatically convert the dBQ values to FEC corrections per time interval based on FEC scheme and data rate.

The Q-Factor, is in fact a metric to identify the attenuation in the receiving signal and determine a potential LOS and it is an estimate of the Optical-Signal-to-Noise-Ratio (OSNR) at the optical receiver.   As attenuation in the receiving signal increases, the dBQ value drops and vice-versa.  Hence a drop in the dBQ value can mean that there is an increase in the Pre FEC BER, and a possible LOS could occur if the problem is not corrected in time.

The Quality of an Optical Rx signal can be measured by determining the number of “bad” bits in a block of received data.  The bad bits in each block of received data are removed and replaced with “good” zero’s or one’s such that the network path data can still be properly switched and passed on to its destination.  This strategy is referred to as Forward Error Correction (FEC) and prevents a complete loss of traffic due to small un-important data-loss that can be re-sent again later on.  The process by which the “bad” bits are replaced with the “good” bits in an Rx data block is known as Mapping.  The Pre FEC are the FEC Counts of “bad” bits before the Mapper and the FEC Counts (or Post FEC Counts) are those after the Mapper.

The number of Pre FEC Counts for a given period of time can represent the status of the Optical Rx network signal; An increase in the Pre FEC count means that there is an increase in the number of “bad” bits that need to be replaced by the Mapper.  Hence a change in rate of the Pre FEC Count (Bit Erro Rate – BER) can identify a potential problem upstream in the network.  At some point the Pre FEC Count will be too high as there will be too many “bad” bits in the incoming data block for the Mapper to replace … this will then mean a Loss of Signal (LOS).

As the normal number of Pre FEC Counts are high (i.e. 1.35E-3 to 6.11E-16) and constantly fluctuate, it can be difficult for an network operator to determine whether there is a potential problem in the network.  Hence a dBQ value, known as the Q-Factor, is used as a measure of the Quality of the receiving optical signal.  It should be consistent with the Pre FEC Count Bit Error Rate (BER).

The standards define the Q-Factor as Q = 10log[(X1 – X0)/(N1 – N0)] where Xj and Nj are the mean and standard deviation of the received mark-bit (j=1) and space-bit (j=0)  …………….  In some cases Q = 20log[(X1 – X0)/(N1 – N0)]

For example, the linear Q range 3 to 8 covers the BER range of 1.35E-3 to 6.11E-16.

Nortel defines dBQ as 10xlog10(Q/Qref) where Qref is the pre-FEC raw optical Q, which gives a BER of 1E-15 post-FEC assuming a particular error distribution. Some organizations define dBQ as 20xlog10(Q/Qref), so care must be taken when comparing dBQ values from different sources.

The dBQ figure represents the dBQ of margin from the following pre-FEC BERs (which are equivalent to a post-FEC BER of 1E-15). The equivalent linear Q value for these BERs are  Qref in the above formula.

Pre-FEC signal degrade can be used the same way a car has an “oil light” in that it states that there is still margin left but you are closer to the fail point than expected so action should be taken.