Understanding Baud Rate, Bit Rate, and Spectral Width in Optical Communications
A Comprehensive Guide to Key Parameters in Modern Fiber Optic Networks
In modern optical fiber communications, maximizing data transmission efficiency while minimizing signal degradation is crucial. Several key parameters such as baud rate, bit rate, and spectral width play a critical role in determining the performance of optical networks. I have seen we discuss these parameters so many time during our technical discussion and still there is lot of confusion, so I thought of compiling all the information which is available in bits and pieces. This article will deep dive into all these concepts, their dependencies, and how modulation schemes influence their behavior in optical systems.
Baud Rate vs. Bit Rate
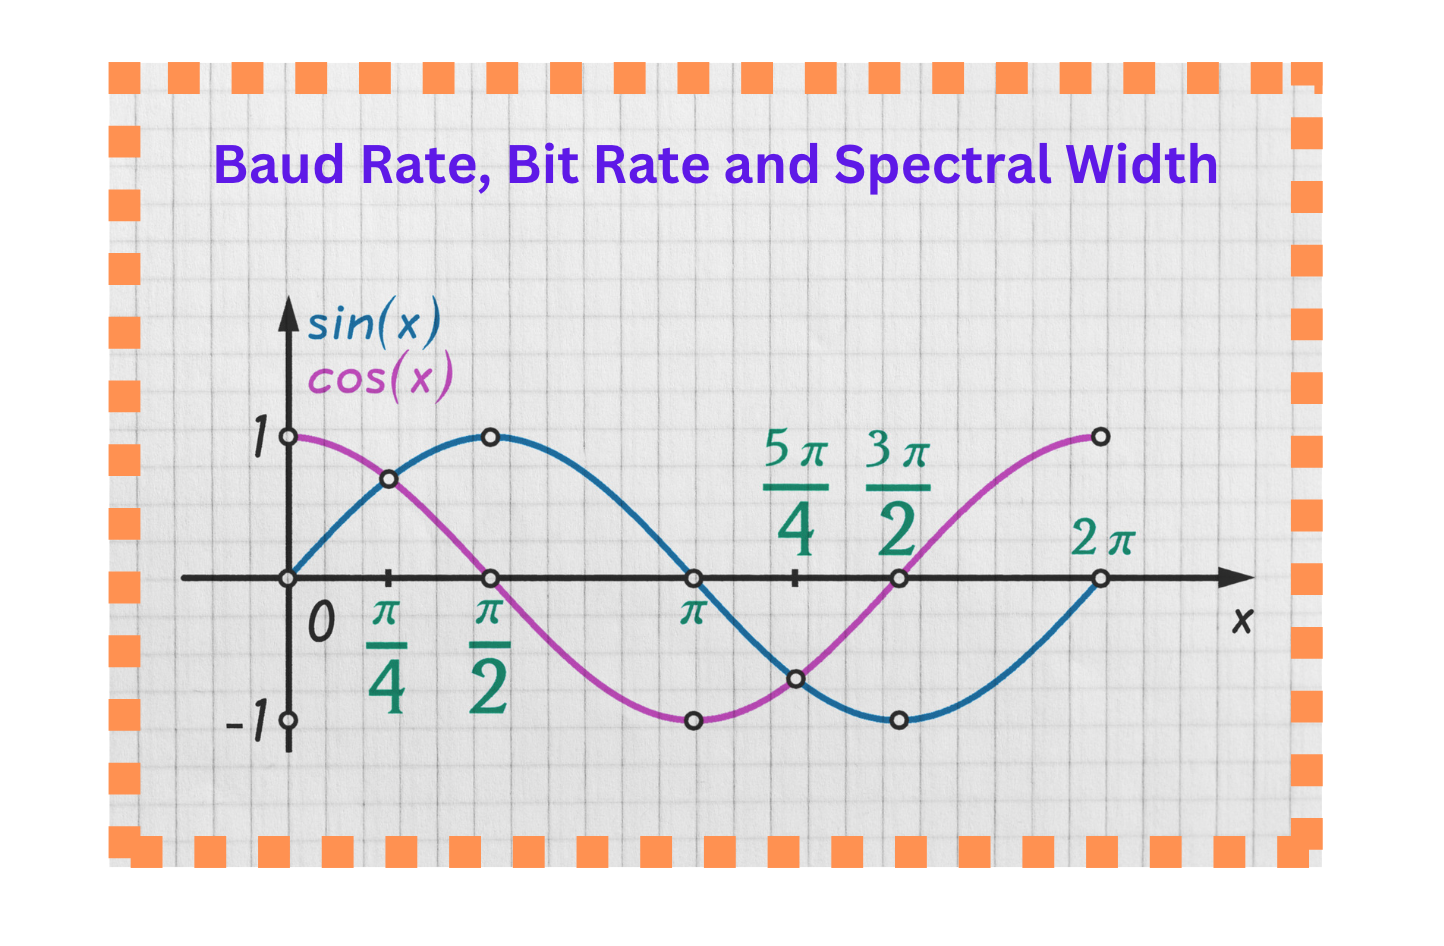
At the core of digital communication, the bit rate represents the amount of data transmitted per second, measured in bits per second (bps). The baud rate, on the other hand, refers to the number of symbol changes or signaling events per second, measured in symbols per second (baud). While these terms are often used interchangeably, they describe different aspects of signal transmission.
In systems with simple modulation schemes, such as Binary Phase Shift Keying (BPSK), where one bit is transmitted per symbol, the baud rate equals the bit rate. However, as more advanced modulation schemes are introduced (e.g., Quadrature Amplitude Modulation or QAM), multiple bits can be encoded in each symbol, leading to situations where the bit rate exceeds the baud rate. The relationship between baud rate, bit rate, and the modulation order (number of bits per symbol) is given by:
Where:
B = Bit rate (bps)
S = Baud rate (baud)
m = Modulation order (number of symbols)
The baud rate represents the number of symbols transmitted per second, while the bit rate is the total number of bits transmitted per second. Engineers often need to choose an optimal balance between baud rate and modulation format based on the system's performance requirements. For example:
- High baud rates can increase throughput, but they also increase the spectral width and require more sophisticated filtering and higher-quality optical components.
- Higher-order modulation formats (e.g., 16-QAM, 64-QAM) allow engineers to increase the bit rate without expanding the spectral width. However, these modulation formats require a higher Signal-to-Noise Ratio (SNR) to maintain acceptable Bit Error Rates (BER).
Design Consideration: Choosing the right baud rate and modulation format depends on factors such as available bandwidth, distance, and power efficiency. For example, in a long-haul optical system, engineers may opt for lower-order modulation (like QPSK) to maintain signal integrity over vast distances, while in shorter metro links, higher-order modulation (like 16-QAM or 64-QAM) might be preferred to maximize data throughput.
Spectral Width
The spectral width of a signal defines the range of frequencies required for transmission. In the context of coherent optical communications, spectral width is directly related to the baud rate and the roll-off factor used in filtering. It can be represented by the formula:
The spectral width of an optical signal determines the amount of frequency spectrum it occupies, which directly affects how efficiently the system uses bandwidth. The roll-off factor (α) in filters impacts the spectral width:
- Lower roll-off factors reduce the bandwidth required but make the signal more susceptible to inter-symbol interference (ISI).
- Higher roll-off factors increase the bandwidth but offer smoother transitions between symbols, thus reducing ISI.
In systems where bandwidth is a critical resource such as Dense Wavelength Division Multiplexing (DWDM), engineers need to optimize the roll-off factor to balance spectral efficiency and signal integrity. For example, in a DWDM system with closely spaced channels, a roll-off factor of 0.1 to 0.2 is typically used to avoid excessive inter-channel crosstalk.
Practical Example: Bandwidth Calculation
If a signal is transmitted at a baud rate of 64 GBaud with a roll-off factor of 0.2, the actual bandwidth required for transmission becomes:
This relationship is crucial in Dense Wavelength Division Multiplexing (DWDM) systems, where spectral width must be tightly controlled to avoid interference between adjacent channels.
The Nyquist Theorem and Roll-Off Factor
The Nyquist theorem sets a theoretical limit on the minimum bandwidth required to transmit data without ISI. According to this theorem, the minimum bandwidth Bmin for a signal is half the baud rate:
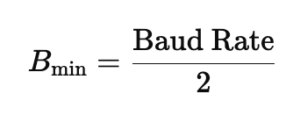
In practical systems, the actual bandwidth exceeds this minimum due to imperfections in filters and other system limitations. The roll-off factor r typically ranging from 0 to 1, defines the excess bandwidth required beyond the Nyquist limit. The actual bandwidth with a roll-off factor is:
Choosing an appropriate roll-off factor involves balancing bandwidth efficiency with system robustness. A higher roll-off factor results in smoother transitions between symbols and reduced ISI but at the cost of increased bandwidth consumption.
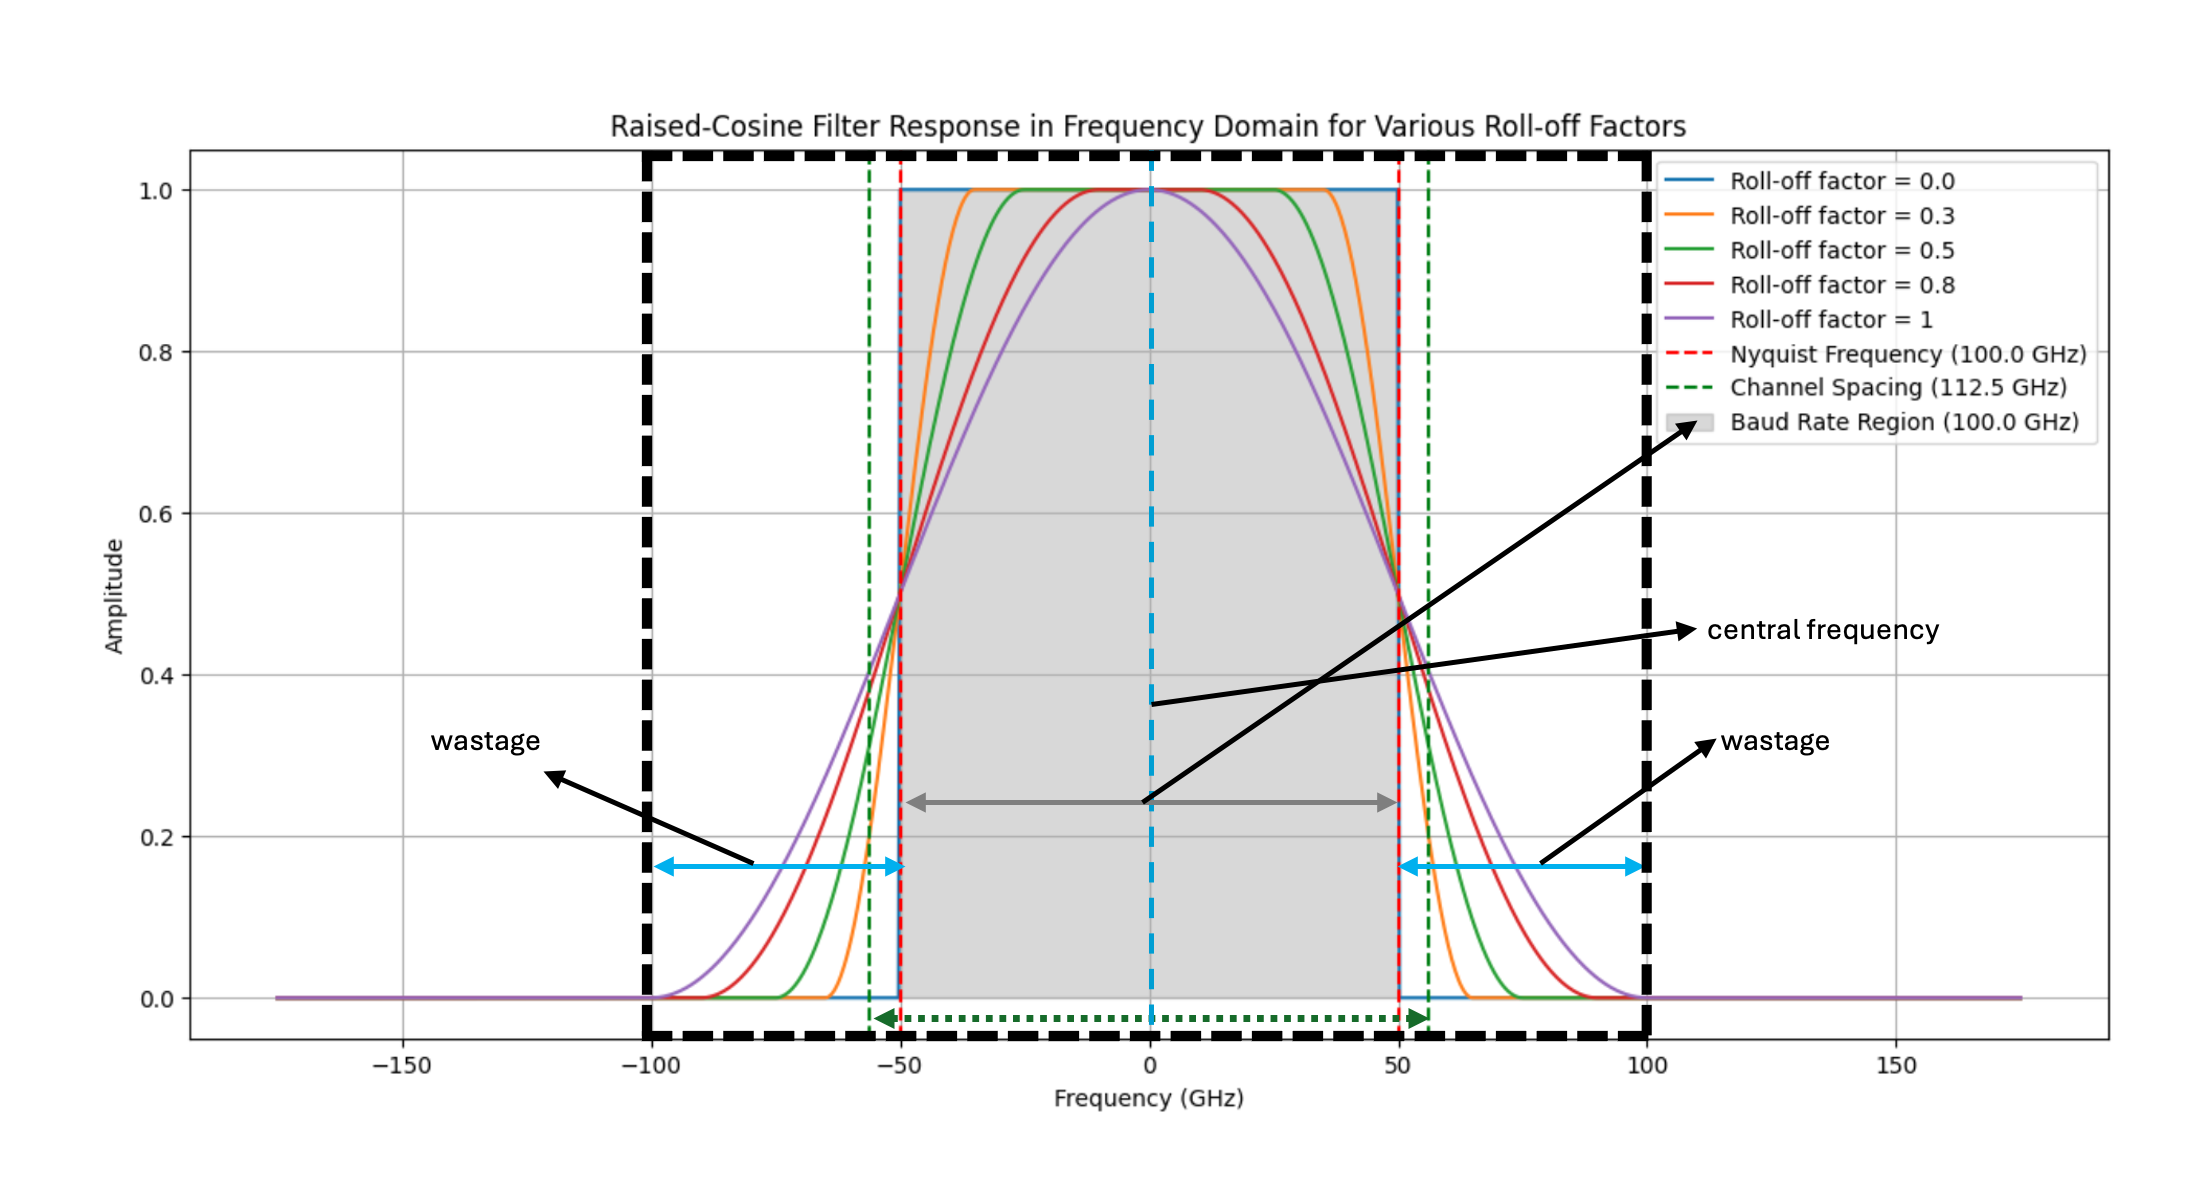 Fig: Raised-cosine filter response showing the effect of various roll-off factors on bandwidth efficiency. Highlighted are the central frequency, Nyquist bandwidth, and wasted spectral bandwidth due to roll-off.
Spectral Efficiency and Channel Bandwidth
The spectral efficiency of an optical communication system, measured in bits per second per Hertz, depends on both the baud rate and the modulation scheme. It can be expressed as:
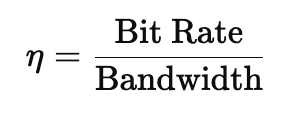
For modern coherent optical systems, achieving high spectral efficiency is crucial for maximizing the data capacity of fiber-optic channels, especially in DWDM systems where multiple channels are transmitted over the same fiber.
Calculation of Bit Rate and Spectral Efficiency
Worked Example: 50 Gbaud System with 16-QAM
Consider a 50 Gbaud system using 16-QAM modulation. The bit rate can be calculated as follows:
Assuming a roll-off factor α = 0.2, the spectral width would be:
Thus, the spectral efficiency is:
This example demonstrates how increasing the modulation order (in this case, 16-QAM) boosts the bit rate, while maintaining acceptable spectral efficiency.
Trade-offs Between Baud Rate, Bit Rate and Modulation Formats
In optical communication systems, higher baud rates allow for the transmission of more symbols per second, but they require broader spectral widths (i.e., more bandwidth). Conversely, higher-order modulation formats allow more bits per symbol, reducing the required baud rate for the same bit rate, but they increase system complexity and susceptibility to impairments.
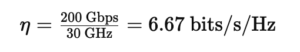
For instance, if we aim to transmit a 400 Gbps signal, we have two general options:
- Increasing the Baud Rate: Keeping a lower modulation format (e.g., QPSK), we can increase the baud rate. For instance, a 400 Gbps signal using QPSK requires a 200 GBaud rate.
- Using Higher-Order Modulation: With 64-QAM, which transmits 6 bits per symbol, we could transmit the same 400 Gbps with a baud rate of approximately 66.67 GBaud.
Important Trade-off: While higher baud rates increase the spectral width requirement, they are generally less sensitive to noise. Higher-order modulation schemes, on the other hand, require less spectral width but need a higher optical signal-to-noise ratio (OSNR) to maintain performance. Engineers need to carefully balance baud rate and modulation formats based on system requirements and constraints.
Probabilistic Constellation Shaping (PCS) for High Spectral Efficiency
Probabilistic Constellation Shaping (PCS) is an advanced technique that optimizes the distribution of symbols in a QAM constellation to improve spectral efficiency and approach the theoretical Shannon limit more closely than traditional uniform QAM systems. This breakthrough technology is revolutionizing how optical networks maximize capacity while maintaining signal integrity.
How PCS Works
In traditional QAM systems, all constellation points are used with equal probability. PCS takes a different approach by shaping the probability distribution of constellation points such that:
- Low-amplitude symbols (points closer to the origin) are transmitted more frequently. These symbols have lower power and are more resistant to noise.
- High-amplitude symbols (points farther from the origin) are transmitted less frequently. These symbols require more power and are more susceptible to errors in noisy environments.
Key Advantage: PCS allows optical systems to approach the Shannon limit more closely than traditional QAM systems, resulting in greater spectral efficiency and higher capacity over the same bandwidth. A 400G optical transceiver using DP-16QAM with PCS can achieve better performance at lower OSNR levels than a traditional DP-16QAM transceiver, extending the transmission distance and reducing the need for amplification.
Practical Implementation of PCS
Real-World Use Case: 800G Metro Networks
A service provider deploys 800G transceivers with DP-64QAM and PCS for short-haul metro networks. By shaping the constellation, the provider can:
- Extend the reach of 800G signals without compromising spectral efficiency
- Transmit at high data rates over longer distances than possible with traditional 64QAM
- Optimize the trade-off between capacity and reach dynamically based on network conditions
Benefits of PCS in Modern Networks
- Improved OSNR Tolerance: PCS systems can operate effectively at lower OSNR levels, extending transmission reach
- Flexibility: The probability distribution can be adjusted dynamically to optimize for different network conditions
- Shannon Limit Approach: PCS systems can achieve spectral efficiencies within 0.5-1 dB of the theoretical Shannon limit
- Cost Efficiency: Better performance at lower OSNR reduces the need for expensive amplification infrastructure
Practical Applications of Baud Rate and Modulation Schemes in Real-World Networks
High-speed optical communication systems rely heavily on factors such as baud rate, bit rate, spectral width, and roll-off factor to optimize performance. Engineers working with fiber-optic systems continuously face the challenge of optimizing these parameters to achieve maximum signal reach, data capacity, and power efficiency. To overcome the physical limitations of optical fibers and system components, Digital Signal Processing (DSP) plays a pivotal role in enabling high-capacity data transmission while minimizing signal degradation. This extended article dives deeper into the real-world applications of these concepts and how engineers modify and optimize DSP to improve system performance.
When Do Engineers Need This Information?
Optical engineers need to understand the relationships between baud rate, spectral width, bit rate, and DSP when designing and maintaining high-speed communication networks, especially for:
- Long-haul fiber-optic systems (e.g., transoceanic communication lines)
- Metro networks where high data rates are required over moderate distances
- Data center interconnects that demand ultra-low latency and high throughput
- 5G backhaul networks, where efficient use of bandwidth and high data rates are essential
How Engineers Use DSP to Optimize Signal Performance?
Pre-Equalization for Baud Rate and Bandwidth Optimization
In optical systems with high baud rates (e.g., 64 Gbaud and above), the signal may be degraded due to limited bandwidth in the optical components, such as transmitters and amplifiers. Engineers use pre-equalization techniques in the DSP to pre-compensate for these bandwidth limitations. By shaping the signal before transmission, pre-equalization ensures that the signal maintains its integrity throughout the transmission process.
For instance, a 100 Gbaud signal may suffer from component bandwidth limitations, resulting in signal distortion. Engineers can use DSP to pre-distort the signal, allowing it to pass through the limited-bandwidth components without significant degradation.
Adaptive Equalization for Signal Reach Optimization
To maximize the reach of optical signals, engineers use adaptive equalization algorithms, which dynamically adjust the signal to compensate for impairments encountered during transmission. One common algorithm is the decision-directed least mean square (DD-LMS) equalizer, which adapts the system's response to continuously minimize errors in the received signal. This is particularly important in long-haul and submarine optical networks, where signals travel thousands of kilometers and are subject to various impairments such as chromatic dispersion and fiber nonlinearity.
Polarization Mode Dispersion (PMD) Compensation
In optical systems, polarization mode dispersion (PMD) causes signal distortion by splitting light into two polarization modes that travel at different speeds. DSP is used to track and compensate for PMD in real-time, ensuring that the signal arrives at the receiver without significant polarization-induced distortion.
Practical Example of DSP Optimization in Super-Nyquist WDM Systems
In super-Nyquist WDM systems, where the channel spacing is narrower than the baud rate, DSP plays a crucial role in ensuring spectral efficiency while maintaining signal integrity. By employing advanced multi-modulus blind equalization algorithms, engineers can effectively mitigate inter-channel interference (ICI) and ISI. This allows the system to transmit data at rates higher than the Nyquist limit, thereby improving spectral efficiency.
Super-Nyquist System Example
Consider a super-Nyquist system transmitting 400 Gbps signals with a 50 GHz channel spacing. In this case, the baud rate exceeds the available bandwidth, leading to spectral overlap. DSP compensates for the resulting crosstalk and ISI, enabling the system to achieve high spectral efficiency (e.g., 4 bits/s/Hz) while maintaining a low BER.
How Roll-Off Factor Affects Spectral Width and Signal Reach
The roll-off factor directly affects the bandwidth used by a signal. In systems where spectral efficiency is critical (such as DWDM networks), engineers may opt for a lower roll-off factor (e.g., 0.1 to 0.2) to reduce the bandwidth and fit more channels into the same optical spectrum. However, this requires more sophisticated DSP algorithms to manage the increased ISI that results from narrower filters.
For example, in a DWDM system operating at 50 GHz channel spacing, a low roll-off factor allows for tighter channel packing but necessitates more advanced ISI compensation through DSP. Conversely, a higher roll-off factor reduces the need for ISI compensation but increases the required bandwidth, limiting the number of channels that can be transmitted.
Baud Rate and Fiber Nonlinearities
While higher baud rates offer significant advantages in terms of transmission efficiency, they also introduce unique challenges related to fiber nonlinearities. Understanding and mitigating these effects is crucial for optimizing high-speed optical systems.
Impact of High Baud Rates on Fiber Nonlinearities
Critical Challenge: Higher baud rates reduce the number of symbols needed to encode the same amount of data, which improves transmission efficiency. However, higher baud rates are more susceptible to fiber nonlinearities, such as:
- Self-Phase Modulation (SPM): The phase of the optical signal changes due to intensity variations, causing signal distortion
- Cross-Phase Modulation (XPM): The phase of one channel is affected by the intensity variations of adjacent channels
- Four-Wave Mixing (FWM): Interaction between multiple wavelengths creates new frequencies that interfere with the signal
Mitigation Strategies Using DSP
Advanced digital signal processing (DSP) techniques are essential for compensating for nonlinear distortions at higher baud rates:
- Digital Back-Propagation (DBP): Reverses the effects of fiber nonlinearities by numerically solving the nonlinear Schrödinger equation
- Nonlinear Compensation Algorithms: Predict and compensate for SPM and XPM effects in real-time
- Power Optimization: Dynamically adjusts launch power to minimize nonlinear effects while maximizing OSNR
Practical Example: 64 Gbaud Long-Haul System
A telecom operator increases the baud rate to 64 Gbaud in its long-haul 400G system to double capacity without adding new fiber. However, at this higher baud rate, SPM and XPM become significant issues. The operator implements advanced DSP techniques including:
- Pre-distortion at the transmitter to compensate for expected nonlinear effects
- Adaptive equalization at the receiver to correct residual nonlinear distortions
- Optimized launch power settings per span to balance OSNR and nonlinearity
Result: The system maintains signal integrity over 2,000+ km while achieving the desired 400G capacity per wavelength.
The Role of DSP in Power Optimization
Power efficiency is another crucial consideration in optical systems, especially in long-haul and submarine networks where power consumption can significantly impact operational costs. DSP allows engineers to optimize power by:
- Pre-distorting the signal to reduce the impact of non-linearities, enabling the use of lower transmission power while maintaining signal quality.
- Compensating for impairments such as self-phase modulation (SPM) and cross-phase modulation (XPM), which are power-dependent effects that degrade signal quality.
By using DSP to manage power-efficient transmission, engineers can extend the signal reach and reduce the power consumption of optical amplifiers, thereby improving the overall system performance.
Power Consumption and Energy Efficiency in Optical Networks
As network operators scale to higher data rates, power consumption becomes a critical factor affecting both operational costs and environmental sustainability. Understanding the relationship between modulation format, baud rate, and power consumption is essential for designing cost-effective networks.
Power vs. Capacity Trade-Offs
As modulation formats become more complex (e.g., moving from QPSK to 64QAM), the power required for signal processing increases significantly. Coherent transceivers using advanced modulation formats require:
- More Sophisticated DSP Algorithms: Higher computational complexity increases power consumption in the DSP chips
- Higher-Speed ADCs/DACs: Analog-to-digital and digital-to-analog converters operating at higher speeds consume more power
- Advanced Cooling Systems: Increased heat dissipation requirements add to overall power consumption
Data Center Interconnect Power Analysis
In a data center interconnect (DCI) network comparison:
- 400G Coherent (64QAM): ~15W per transceiver = 2.5 watts per gigabit
- 100G Coherent (QPSK): ~8W per transceiver = 4.0 watts per gigabit
Key Insight: While 400G transceivers consume more absolute power, they offer significantly better power efficiency per gigabit. Fewer transceivers are needed to achieve the same total capacity, resulting in lower overall power consumption.
Per-Gigabit Power Efficiency
The industry trend shows that per-gigabit power consumption decreases as data rates increase, making higher-capacity systems more energy-efficient:
Power Efficiency Evolution:
- 10G Systems: ~5-6 watts per gigabit
- 100G Systems: ~3-4 watts per gigabit
- 400G Systems: ~2-2.5 watts per gigabit
- 800G+ Systems: ~1.5-2 watts per gigabit (emerging)
Baud Rate Impact on Power Consumption
While increasing the baud rate can reduce the number of transceivers required for a given capacity, it also increases power consumption due to:
- Need for more advanced DSP algorithms to handle higher-speed signal processing
- Higher-speed ADCs and DACs with greater power requirements
- Increased thermal management needs
Optimization Strategy: The key to optimizing power consumption is finding the right balance between baud rate, modulation format, and OSNR requirements. Engineers must consider:
- Total cost of ownership (TCO) including both capital and operational expenses
- Power consumption per gigabit vs. absolute power consumption
- Cooling infrastructure requirements and costs
- Environmental and sustainability goals
Future Trends: CMOS Technology and Energy Efficiency
Advances in CMOS technology are playing a crucial role in improving the energy efficiency of coherent optical systems. Moving from older process nodes to advanced 3nm and 5nm CMOS technology enables:
- Higher Baud Rates: 3nm technology supports 140+ Gbaud systems with improved RF performance
- Lower Power Consumption: More efficient transistors reduce power consumption at the same performance level
- Better Integration: System-on-chip designs reduce the number of components and overall power consumption
- Improved Thermal Characteristics: Better heat dissipation enables higher-density deployments
Impact of CMOS Scaling on 800G Systems
A comparison of 800G coherent transceivers using different CMOS technologies:
- 7nm CMOS: 25W power consumption, 64 Gbaud maximum, ~3.1 W/100G
- 5nm CMOS: 20W power consumption, 90 Gbaud capable, ~2.5 W/100G
- 3nm CMOS: 15W power consumption, 140 Gbaud capable, ~1.9 W/100G
Conclusion: Advanced CMOS processes enable significant improvements in both performance (higher baud rates) and efficiency (lower power per gigabit), making next-generation coherent systems more sustainable and cost-effective.
Quick Reference: Modulation Formats and System Parameters
The following table provides a practical reference for engineers designing optical systems, showing the relationship between key parameters across different modulation formats and data rates.
| Data Rate | Modulation | Baud Rate | Bits/Symbol | Typical Reach | Application |
|---|---|---|---|---|---|
| 100G | PDM-QPSK | 32 Gbaud | 4 | >2,000 km | Long-haul |
| 200G | PDM-16QAM | 32 Gbaud | 8 | 500-1,000 km | Regional/Metro |
| 400G | PDM-16QAM | 64 Gbaud | 8 | 500-800 km | Metro/Regional |
| 400G | PDM-QPSK | 128 Gbaud | 4 | >1,500 km | Long-haul |
| 800G | PDM-64QAM | 90 Gbaud | 12 | 80-120 km | DCI/Metro |
| 800G | PDM-16QAM + PCS | 90 Gbaud | 8-10 | 300-500 km | Regional |
| 1.6T | PDM-64QAM + PCS | 140 Gbaud | 10-12 | 40-80 km | DCI |
Table Notes:
- Reach values are approximate and depend on fiber quality, amplifier spacing, and OSNR requirements
- PCS (Probabilistic Constellation Shaping) can extend reach by 20-30% compared to standard modulation
- Bits/Symbol for PCS varies dynamically based on channel conditions
- DCI = Data Center Interconnect
Key Takeaways
- Baud Rate vs. Bit Rate: Understanding the distinction is critical for optimizing optical communication systems. Higher-order modulation increases bit rate without increasing baud rate, but requires higher OSNR.
- Spectral Width Management: Balancing roll-off factors with bandwidth requirements is essential in DWDM systems to maximize channel density while minimizing interference. Lower roll-off factors (0.1-0.2) enable tighter channel packing but require sophisticated DSP.
- Nyquist Theorem Application: The theoretical minimum bandwidth is half the baud rate, but practical systems require excess bandwidth determined by the roll-off factor. This excess bandwidth affects system design and channel spacing.
- Probabilistic Constellation Shaping (PCS): Modern systems use PCS to approach the Shannon limit more closely, improving spectral efficiency by 0.5-1 dB and extending reach at lower OSNR levels.
- Fiber Nonlinearities: Higher baud rates increase susceptibility to SPM, XPM, and FWM. Advanced DSP techniques including digital back-propagation and nonlinear compensation are essential for mitigating these effects.
- DSP Optimization: Modern optical systems heavily rely on digital signal processing for pre-equalization, adaptive equalization, PMD compensation, and nonlinearity mitigation to maximize reach and performance.
- Power Efficiency: Per-gigabit power consumption decreases with higher data rates. 400G systems consume ~2.5W per gigabit compared to ~4W for 100G systems, making higher-capacity systems more energy-efficient.
- CMOS Technology Impact: Advanced 3nm and 5nm CMOS processes enable higher baud rates (140+ Gbaud) with lower power consumption, supporting the evolution toward 800G and 1.6T systems.
- Trade-off Analysis: Engineers must carefully balance baud rate, modulation format, spectral efficiency, OSNR requirements, and power consumption based on specific system constraints (metro vs. long-haul) and business objectives (capacity vs. reach vs. cost).
- Future-Proofing: Network designs should consider scalability to higher baud rates and modulation formats, with flex-grid ROADM infrastructure and programmable transceivers enabling dynamic optimization as technology evolves.
For educational purposes in optical networking and DWDM systems
Note: This guide is based on industry standards, best practices, and real-world implementation experiences. Specific implementations may vary based on equipment vendors, network topology, and regulatory requirements. Always consult with qualified network engineers and follow vendor documentation for actual deployments.
Unlock Premium Content
Join over 400K+ optical network professionals worldwide. Access premium courses, advanced engineering tools, and exclusive industry insights.
Already have an account? Log in here