Understanding Q-Factor in Optical Communications
What is Q-Factor?
A Q-factor measurement occupies an intermediate position between the classical optical parameters (power, OSNR, and wavelength) and the digital end-to-end performance parameters based on BER. A Q-factor is measured in the time domain by analyzing the statistics of the pulse shape of the optical signal. A Q-factor is a comprehensive measure for the signal quality of an optical channel taking into account the effects of noise, filtering, and linear/non-linear distortions on the pulse shape, which is not possible with simple optical parameters alone.
Three Key Definitions of Q-Factor
Definition 1: Q-Factor as a Function of OSNR
The Q-factor, a function of the OSNR, provides a qualitative description of the receiver performance. The Q-factor suggests the minimum signal-to-noise ratio (SNR) required to obtain a specific BER for a given signal. OSNR is measured in decibels. The higher the bit rate, the higher the OSNR ratio required.
Practical Example: For OC-192 transmissions, the OSNR should be at least 27 to 31 dB compared to 18 to 21 dB for OC-48.
Definition 2: Q-Factor as a Noise Measure
The Quality factor is a measure of how noisy a pulse is for diagnostic purposes. The eye pattern oscilloscope will typically generate a report that shows what the Q factor number is. The Q factor is defined as shown in the figure: the difference of the mean values of the two signal levels (level for a "1" bit and level for a "0" bit) divided by the sum of the noise standard deviations at the two signal levels. A larger number in the result means that the pulse is relatively free from noise.
Definition 3: Q-Factor and Eye Diagram Analysis
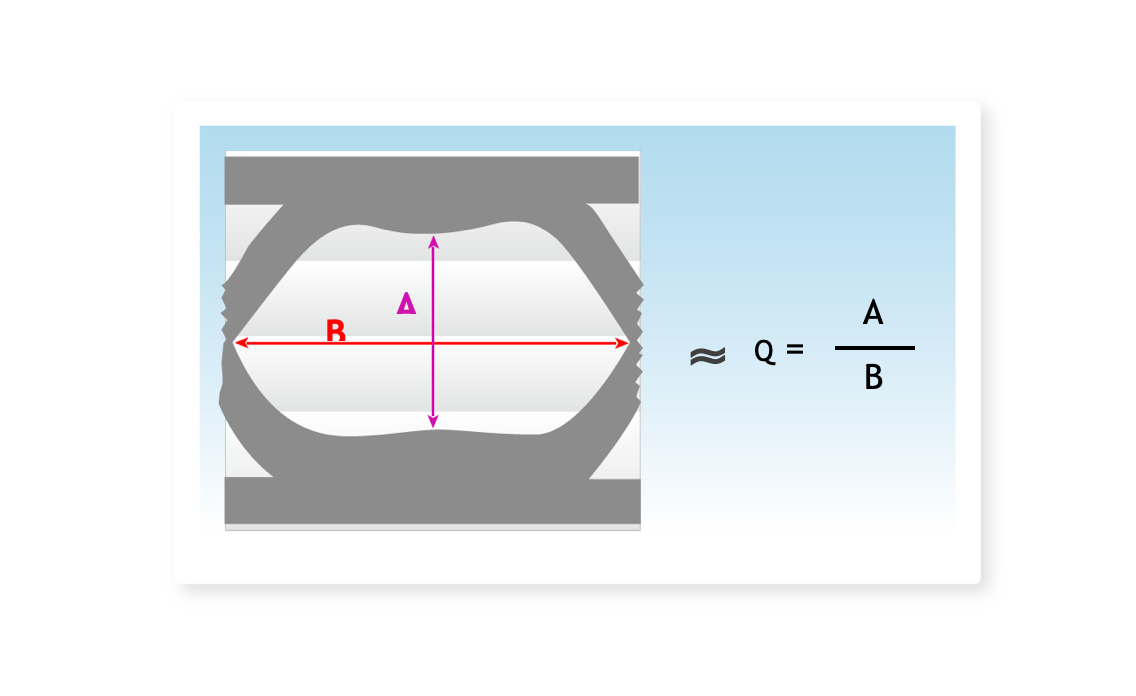
Q is defined as follows: The ratio between the sums of the distance from the decision point within the eye (D) to each edge of the eye, and the sum of the RMS noise on each edge of the eye.
This definition can be derived from the following definition, which in turn comes from ITU-T G.976, where μ₁,₀ are the mean positions of each rail of the eye, and σ₁,₀ are the S.D., or RMS noise, present on each of these rails.
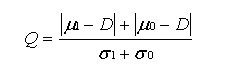
This definition can be derived from the ITU-T G.976 formula:

where μ₁,₀ are the mean positions of each rail of the eye, and σ₁,₀ are the S.D., or RMS noise, present on each of these rails.
For an illustration of where these values lie within the eye, see the following figure:

Eye diagram illustrating μ₁, μ₀, σ₁, σ₀ parameters and decision point D
Understanding Q-Factor Values
Key Insight: As Q is a ratio, it is reported as a unit-less positive value greater than 1 (Q > 1). A Q of 1 represents complete closure of the received optical eye. To give some idea of the associated raw BER, a Q of 6 corresponds to a raw BER of 10⁻⁹.
Q-Factor as Defined in ITU-T G.976
The Q factor is the signal-to-noise ratio at the decision circuit in voltage or current units, and is typically expressed by:
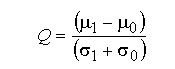
where μ₁,₀ is the mean value of the marks/spaces voltages or currents, and σ₁,₀ is the standard deviation.
Mathematical Relations to BER
The mathematic relations to BER when the threshold is set to the optimum value are:
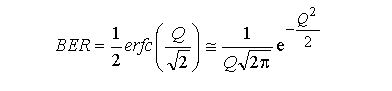
with:

Q-Factor in Decibels
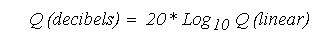
The Q factor can be written in terms of decibels rather than in linear values:
Calculation of Q-Factor from OSNR
The OSNR is the most important parameter that is associated with a given optical signal. It is a measurable (practical) quantity for a given network, and it can be calculated from the given system parameters. This section discusses the relationship of OSNR to the Q-factor.
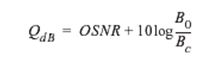
The logarithmic value of Q (in dB) is related to the OSNR by the following equation:

In the equation, B₀ is the optical bandwidth of the end device (photodetector) and Bₑ is the electrical bandwidth of the receiver filter.
Therefore, Q(dB) is shown in:
Important Note: In other words, Q is somewhat proportional to the OSNR. Generally, noise calculations are performed by optical spectrum analyzers (OSAs) or sampling oscilloscopes, and these measurements are carried over a particular measuring range of Bm. Typically, Bm is approximately 0.1 nm or 12.5 GHz for a given OSA.
Practical Design Considerations
Design Rule: From the equations relating Q in dB to OSNR, it can be understood that if B₀ < Bₑ, then OSNR (dB) > Q (dB). For practical designs, OSNR(dB) > Q(dB) by at least 1–2 dB.
Typically, while designing a high-bit rate system, the margin at the receiver is approximately 2 dB, such that Q is about 2 dB smaller than OSNR (dB).
Measurement Bandwidth: Generally, noise calculations are performed by optical spectrum analyzers (OSAs) or sampling oscilloscopes, and these measurements are carried over a particular measuring range of Bm. Typically, Bm is approximately 0.1 nm or 12.5 GHz for a given OSA.
Q-Factor as a Performance Metric
Operational Significance: The Q-Factor is, in fact, a metric to identify the attenuation in the receiving signal and determine a potential LOS (Loss of Signal). It is an estimate of the Optical-Signal-to-Noise-Ratio (OSNR) at the optical receiver. As attenuation in the receiving signal increases, the dBQ value drops and vice-versa. Hence, a drop in the dBQ value can mean that there is an increase in the Pre-FEC BER, and a possible LOS could occur if the problem is not corrected in time.
Key Takeaways
- Comprehensive Metric: Q-factor provides a holistic view of signal quality, accounting for noise, filtering, and distortions
- Intermediate Parameter: Bridges classical optical parameters and digital performance metrics
- Time Domain Analysis: Measured by analyzing pulse shape statistics in the time domain
- OSNR Relationship: Q-factor is proportional to OSNR with typical 1-2 dB margin in practical systems
- Predictive Value: Falling Q-factor values can predict potential signal degradation and loss before it occurs
- Bit Rate Dependency: Higher bit rates require higher OSNR and consequently higher Q-factors
Reference Standard
ITU-T G.976: Recommendation on Test methods applicable to optical fibre submarine cable systems
This standard provides the authoritative definitions and methodologies for Q-factor measurements in optical communications systems.

Optical Communications & Network Automation Expert | Author of 3 Books for Optical Engineers | Founder, MapYourTech
Optical networking engineer with nearly two decades of experience across DWDM, OTN, coherent optics, submarine systems, and cloud infrastructure. Founder of MapYourTech. Read full bio →
Follow on LinkedIn