28 min read

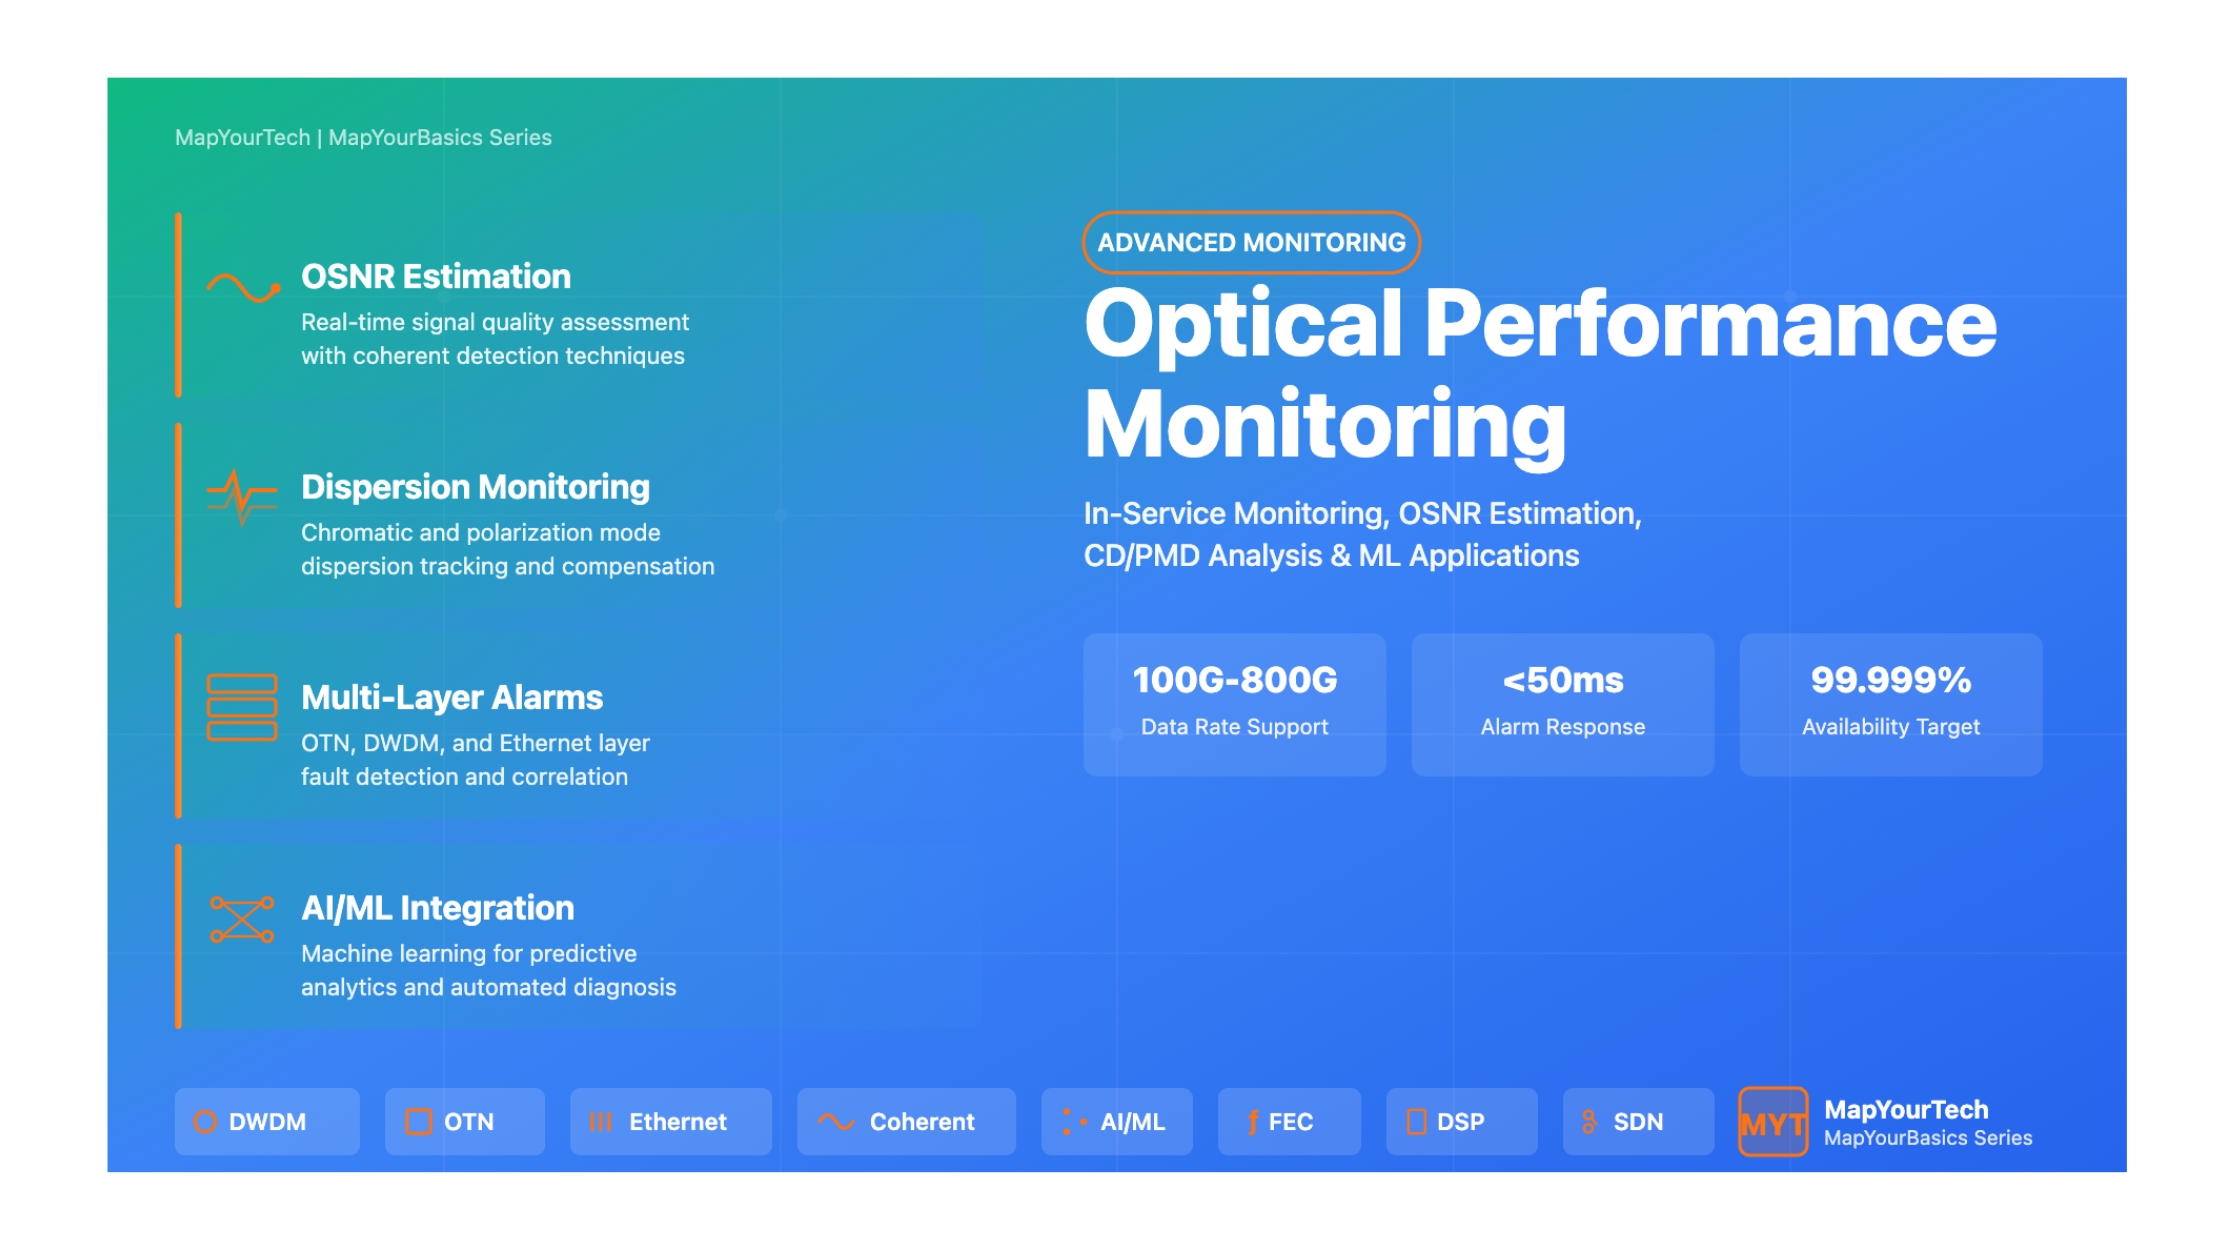
Optical Performance Monitoring: Advanced In-Service Techniques and Machine Learning Applications
Introduction
Optical performance monitoring (OPM) has emerged as an indispensable technology for ensuring the reliable and efficient operation of modern optical communication networks. As network architectures evolve toward higher data rates, increased channel counts, and dynamic reconfigurability, the ability to continuously monitor and assess signal quality parameters in real-time has become critical for maintaining service quality, optimizing network resources, and enabling intelligent network management.
The transition from static point-to-point optical links to dynamic, software-defined optical networks has fundamentally transformed the requirements and capabilities of performance monitoring systems. Traditional electronic-domain monitoring techniques, while still valuable, are increasingly supplemented and replaced by optical-domain monitoring methods that can provide non-intrusive, real-time assessment of signal quality without requiring optical-to-electrical conversion. This paradigm shift enables in-service monitoring capabilities that support continuous network operation while providing detailed visibility into transmission impairments and system performance.
Modern optical networks employ sophisticated modulation formats including QPSK, 16-QAM, and 64-QAM with polarization-division multiplexing, operating at data rates from 100 Gb/s to 800 Gb/s and beyond. These advanced systems require correspondingly advanced monitoring techniques capable of assessing multiple impairment parameters simultaneously across diverse signal formats. The integration of machine learning and artificial intelligence into performance monitoring systems represents the latest evolution, enabling predictive analytics, automated fault diagnosis, and intelligent network optimization.
Scope and Coverage
This comprehensive article examines the full spectrum of optical performance monitoring technologies, from fundamental principles to state-of-the-art machine learning applications. Coverage includes DWDM system monitoring, OTN layer performance assessment, Ethernet service monitoring, and cross-layer correlation techniques. Special emphasis is placed on practical implementation considerations, real-world deployment scenarios, and emerging technologies shaping the future of network monitoring.
Evolution of Optical Performance Monitoring
The history of optical performance monitoring parallels the evolution of optical networking itself. Early optical systems relied primarily on simple power monitoring and bit error rate (BER) measurements performed in the electrical domain after photodetection. These rudimentary techniques proved adequate for first-generation optical systems operating at relatively low data rates with intensity modulation and direct detection.
The introduction of wavelength-division multiplexing (WDM) in the 1990s necessitated more sophisticated monitoring capabilities. Multi-channel systems required per-channel power monitoring, wavelength tracking, and OSNR assessment. Optical spectrum analyzers became essential tools for network characterization, though their high cost and complexity limited deployment to central offices and major network hubs.
The advent of reconfigurable optical add-drop multiplexers (ROADMs) and mesh network architectures in the 2000s drove development of automated, in-service monitoring techniques. Networks with dynamic path provisioning required real-time monitoring to support impairment-aware routing and adaptive compensation. This era saw emergence of techniques including delay-tap monitoring, asynchronous amplitude histogram analysis, and RF spectrum-based monitoring methods.
Coherent detection technology, widely deployed from 2010 onwards, revolutionized performance monitoring by providing access to both amplitude and phase information through digital signal processing. Modern coherent receivers function simultaneously as data receivers and sophisticated monitoring platforms, enabling detailed signal analysis without dedicated monitoring hardware. DSP-based techniques can extract multiple impairment parameters including OSNR, chromatic dispersion, polarization mode dispersion, and nonlinear effects from the same signal.
Critical Performance Parameters in Optical Networks
Understanding the key performance parameters that must be monitored is essential for designing effective monitoring systems. These parameters can be categorized into several groups based on their physical origin and impact on system performance.
Linear Transmission Impairments
Chromatic dispersion (CD) arises from the frequency-dependent refractive index of optical fiber, causing different wavelength components to travel at different velocities. The accumulated dispersion over transmission distance causes pulse broadening and inter-symbol interference. CD monitoring is critical in dynamic networks where optical paths may change, requiring adaptive dispersion compensation. Modern systems employ digital dispersion compensation in coherent receivers, but monitoring remains essential for verifying compensation effectiveness and detecting fiber plant changes.
where D is dispersion parameter (ps/nm/km), λ is wavelength, c is speed of light, and n is refractive index
Polarization mode dispersion (PMD) results from fiber birefringence, causing the two orthogonal polarization modes to propagate with different group velocities. Unlike CD, PMD exhibits stochastic behavior varying with temperature and mechanical stress. PMD becomes increasingly problematic at data rates exceeding 40 Gb/s. First-order PMD is characterized by differential group delay (DGD) between polarization states, while higher-order PMD terms describe the frequency dependence of the polarization transformation.
where DPMD is PMD coefficient (ps/√km) and L is fiber length (km)
Polarization-dependent loss (PDL) describes variation in signal attenuation depending on polarization state. PDL arises from asymmetries in optical components and can cause power variations as polarization states evolve along the fiber. In systems employing polarization-division multiplexing, PDL can cause differential power between the two polarization tributaries, potentially degrading system performance.
Noise and Signal Quality Metrics
Optical signal-to-noise ratio (OSNR) represents the fundamental quality metric for optical signals, quantifying the ratio of signal power to amplified spontaneous emission (ASE) noise power within a defined optical bandwidth (typically 0.1 nm). OSNR directly correlates with bit error rate and determines the maximum achievable transmission distance. Accurate OSNR monitoring is essential for optimizing amplifier performance, detecting degradation, and supporting margin-based network planning.
measured within reference bandwidth (typically 0.1 nm or 12.5 GHz at 1550 nm)
Q-factor provides a statistical measure of signal quality related to the separation between digital logic levels relative to noise. Q-factor exhibits strong correlation with BER and can be estimated from received signal histograms or error counting mechanisms. In systems with forward error correction (FEC), pre-FEC Q-factor indicates the raw channel quality while post-FEC BER demonstrates the effectiveness of error correction.
BER ≈ (1/2) × erfc(Q/√2)
where μ₁, μ₀ are mean values and σ₁, σ₀ are standard deviations of mark and space levels
Nonlinear Impairments
Fiber nonlinearities become significant at high optical powers and long transmission distances. Self-phase modulation (SPM) causes intensity-dependent phase shifts within a single channel, while cross-phase modulation (XPM) results in phase modulation of one channel by intensity variations in co-propagating channels. Four-wave mixing (FWM) generates new frequency components through nonlinear interaction of multiple channels, potentially causing inter-channel interference.
Nonlinear effects are particularly challenging to monitor because they often manifest as signal distortion rather than simple power or OSNR degradation. Advanced monitoring techniques employ signal analysis to distinguish nonlinear distortion from linear impairments and ASE noise. Machine learning approaches show promise for characterizing complex nonlinear effects in operating networks.
DWDM System Performance Monitoring
Channel Power and Spectral Monitoring
Per-channel power monitoring forms the foundation of DWDM system management. Maintaining balanced channel powers across all wavelengths ensures optimal system performance and prevents channel power imbalances that could cause crosstalk or saturate optical amplifiers. Modern DWDM systems employ dynamic channel power equalization using variable optical attenuators (VOAs) or wavelength selective switches (WSS) based on continuous power monitoring.
Spectral monitoring encompasses wavelength accuracy verification, channel spacing validation, and detection of rogue channels or unexpected spectral components. Optical spectrum analyzers traditionally served this function, but integrated monitoring solutions using optical channel monitors (OCMs) or coherent receivers now enable cost-effective deployment at network nodes. OCMs typically employ scanning Fabry-Perot filters or arrayed waveguide gratings to simultaneously measure power across all channels with accuracy better than 0.5 dB.
| Parameter | Typical Specification | Monitoring Method | Criticality |
|---|---|---|---|
| Channel Power | ±0.5 dB accuracy | OCM, Tap Coupler + PD | Critical |
| Wavelength Accuracy | ±2.5 GHz (±0.02 nm) | OCM, WSS Feedback | High |
| OSNR per Channel | >20 dB @ 0.1 nm | OSA, Coherent Detection | Critical |
| Channel Spacing | 50 GHz, 37.5 GHz (flex grid) | OCM Spectral Analysis | Medium |
| Power Tilt | <3 dB across C-band | OCM Power Measurement | High |
| Total System Power | Amplifier-dependent | Total Power Detector | Critical |
OSNR Monitoring Techniques
OSNR monitoring represents one of the most challenging and important aspects of optical performance monitoring. Traditional methods rely on interpolating the noise floor between channels using an optical spectrum analyzer, but this approach fails in dense WDM systems with minimal channel spacing or when employing flexible grid technologies.
Polarization-Nulling Method
The polarization-nulling technique exploits the polarized nature of signal versus the unpolarized characteristic of ASE noise. By adjusting a polarization controller to minimize the detected power at a specific wavelength, the signal can be largely suppressed while noise remains relatively constant. The ratio of power before and after nulling enables OSNR estimation. This method requires PMD-compensated implementations to avoid errors from polarization-dependent effects.
where Pmax and Pmin are maximum and minimum detected power during polarization scanning
Coherent Detection-Based OSNR Monitoring
Coherent receivers with digital signal processing enable multiple OSNR monitoring approaches. Data-aided methods utilize known training sequences or pilot tones to separate signal from noise, while non-data-aided techniques analyze signal statistics such as error vector magnitude (EVM) or constellation variance. These methods offer the significant advantage of in-band monitoring without requiring channel spacing.
Statistical moment analysis of equalized signals provides accurate OSNR estimation by examining the variance of received constellation points. For a signal corrupted by AWGN, the noise variance relates directly to OSNR. However, the presence of nonlinear distortions can cause underestimation if not properly accounted for, requiring compensation algorithms that distinguish between linear noise and nonlinear signal distortion.
where E[|s|²] is average symbol power, σ²noise is noise variance, Bref is reference bandwidth (12.5 GHz), and Rsymbol is symbol rate
Chromatic Dispersion Monitoring
CD monitoring enables adaptive dispersion compensation in dynamically reconfigurable networks. Multiple monitoring techniques have been developed, each with specific advantages for different system configurations and modulation formats.
Clock Phase Shift Method
This technique measures the phase difference between upper and lower optical sidebands after filtering. Dispersion causes relative phase shift between sidebands proportional to accumulated CD. Simple implementation using optical filters and phase detection makes this method attractive for direct detection systems, though it requires uncompensated dispersion to generate measurable phase shift.
Delay-Tap Sampling
Delay-tap monitoring analyzes correlations in asynchronously sampled signal amplitudes. The autocorrelation function exhibits characteristic features related to accumulated dispersion. This method works with various modulation formats and does not require symbol-rate sampling, enabling low-cost implementation. Extensions to multiple-tap configurations improve accuracy and enable simultaneous monitoring of multiple impairments.
DSP-Based CD Estimation
In coherent receivers, CD can be estimated directly from the filter coefficients of the adaptive equalizer used for dispersion compensation. This provides accurate, real-time CD monitoring as an inherent byproduct of signal demodulation. The method works with arbitrary modulation formats and enables detection of accumulated dispersion changes due to fiber plant modifications or temperature variations.
Advantages of DSP-Based Monitoring
- No additional hardware required
- Real-time, continuous monitoring
- Works with all coherent formats
- High accuracy and resolution
- Enables closed-loop compensation
Limitations and Challenges
- Requires coherent receiver hardware
- Processing complexity increases with rate
- Must distinguish CD from other impairments
- Calibration needed for absolute measurement
- Higher power consumption
Amplifier Monitoring and Management
Optical amplifiers, particularly erbium-doped fiber amplifiers (EDFAs), play a critical role in long-haul transmission systems. Amplifier monitoring encompasses input/output power measurement, gain verification, noise figure estimation, and pump laser health assessment. Automatic gain control (AGC) systems use continuous monitoring to maintain stable amplification despite channel loading variations.
Raman amplifiers, increasingly deployed for extended reach applications, require specialized monitoring due to their distributed gain profile and wavelength-dependent characteristics. Counter-propagating pump monitoring and distributed temperature sensing enable optimization of Raman gain distribution along fiber spans.
Amplifier Monitoring Best Practices
Continuous monitoring of pump laser current and temperature enables predictive maintenance by detecting gradual degradation before complete failure. Sudden changes in gain or noise figure may indicate component failure or fiber damage requiring immediate attention. Total output power monitoring with automatic shutdown capability prevents damage to downstream components during input power transients.
OTN Layer Performance Monitoring
OTN Architecture and Monitoring Framework
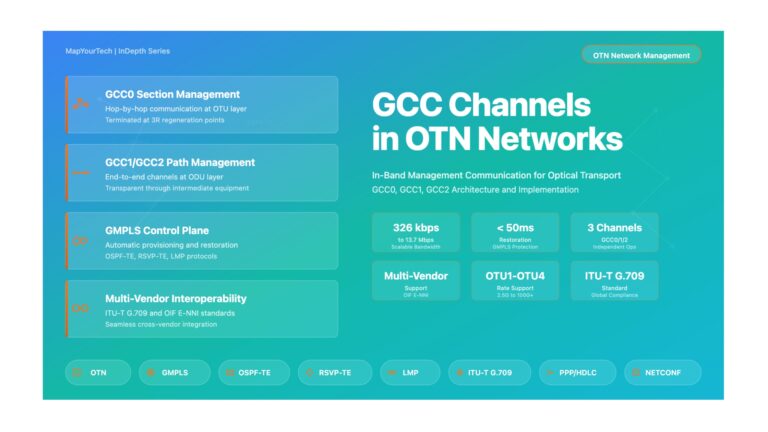
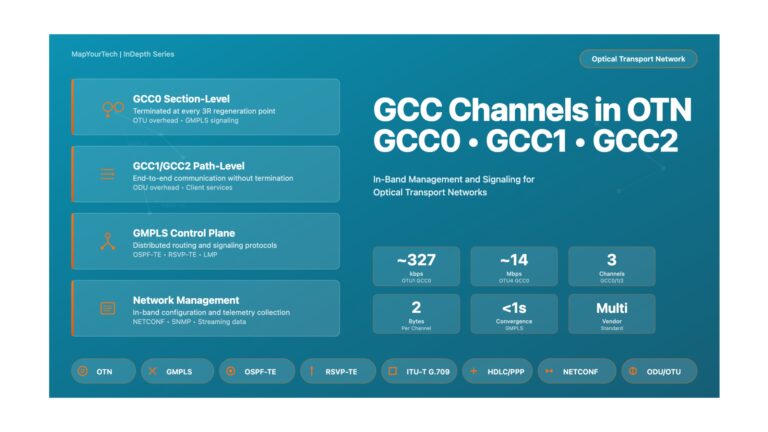
The Optical Transport Network (OTN) standard defined in ITU-T G.709 provides a comprehensive framework for transporting client signals over optical networks with built-in performance monitoring, error correction, and network management capabilities. OTN's multi-layer architecture enables monitoring at multiple hierarchical levels, providing detailed visibility into network performance from the optical domain through the payload.
OTN defines three primary layers: the Optical Channel (OCh) layer handling physical optical transmission, the Optical Data Unit (ODU) layer providing switching and multiplexing, and the Optical Payload Unit (OPU) layer encapsulating client signals. Each layer includes dedicated overhead bytes for performance monitoring, tandem connection monitoring, and fault management.
Forward Error Correction Monitoring
FEC represents one of OTN's most significant features, enabling extended transmission distances by correcting errors introduced during optical propagation. Modern OTN systems employ Reed-Solomon RS(255,239) FEC providing approximately 6.2 dB of net coding gain. More advanced soft-decision FEC codes can achieve 11-13 dB of coding gain, further extending reach or enabling higher-order modulation formats.
FEC performance monitoring involves tracking both pre-FEC and post-FEC bit error rates. Pre-FEC BER indicates the raw optical channel quality, typically in the range of 10⁻³ to 10⁻⁵ for properly functioning systems. Post-FEC BER should remain below 10⁻¹⁵ for error-free operation. Monitoring the FEC correction rate provides early warning of degrading optical performance before service impact occurs.
FEC Overhead = (n - k) / k × 100%
where n is total symbols and k is data symbols (e.g., RS(255,239): 6.7% overhead)
| FEC Type | Coding Gain | Overhead | Latency | Application |
|---|---|---|---|---|
| RS(255,239) | ~6.2 dB | 6.7% | Low | Standard OTN |
| Enhanced FEC | ~8.5 dB | ~13% | Medium | Extended reach |
| Soft-Decision FEC | 11-13 dB | 20-27% | High | Long-haul, submarine |
| Concatenated Codes | >13 dB | >27% | Very High | Maximum reach |
OTN Alarm and Defect Monitoring
OTN specifies a comprehensive set of alarms and defects at each layer, enabling rapid fault detection and isolation. Understanding the alarm hierarchy and propagation patterns is essential for effective network troubleshooting.
OTU Layer Alarms
The Optical Transport Unit (OTU) layer monitors the physical optical signal. Loss of Signal (LOS) indicates complete loss of optical power, typically triggering immediate protection switching. Loss of Frame (LOF) occurs when the receiver cannot detect valid frame alignment for a specified duration (typically 3 ms), indicating severe signal degradation. Out of Frame (OOF) represents a warning state where frame alignment errors are detected but synchronization is not yet lost.
FEC-related alarms include FEC-EXC (FEC Excessive) indicating correction rate exceeding thresholds and FEC-DEG (FEC Degraded) for rates approaching but not yet exceeding limits. These alarms provide early warning of optical degradation, enabling proactive maintenance before service impact.
ODU Layer Alarms
ODU layer monitoring focuses on the digital path through the network. Alarm Indication Signal (AIS) indicates upstream path failure, with all-ones patterns replacing normal payload. Open Connection Indication (OCI) shows path configuration issues where no client signal is mapped to the ODU. Backward Defect Indication (BDI) signals that the far end has detected a defect, enabling bidirectional fault correlation.
Trail Trace Identifier (TTI) mismatch alarms (TIM) detect provisioning errors or unintended path changes. The expected and received identifiers should match; discrepancies indicate configuration problems or cross-connections. Locked (LCK) signals indicate administrative lockout of a path.
Performance Monitoring Counters
OTN maintains extensive performance monitoring counters including Errored Seconds (ES), Severely Errored Seconds (SES), Background Block Errors (BBE), and Unavailable Seconds (UAS). These counters enable statistical analysis of link quality and compliance with service level agreements.
SES: Seconds with BER > 10⁻³ or defect indication
BBE: Block errors in non-SES periods
UAS: Consecutive seconds unavailable (typically after 10 consecutive SES)
Tandem Connection Monitoring
Tandem Connection Monitoring (TCM) enables performance monitoring of network segments independent of end-to-end monitoring. Up to six hierarchical TCM levels can be nested, allowing different operators or network domains to monitor their respective segments. Each TCM instance includes dedicated overhead for performance monitoring, alarm reporting, and trail trace functions.
TCM proves particularly valuable in multi-operator scenarios where a single end-to-end path traverses networks operated by different entities. Each operator can independently monitor and report performance for their network segment without visibility into other segments, supporting business-to-business service level guarantees.
TCM Implementation Considerations
Proper TCM implementation requires careful planning of monitoring points and overhead allocation. TCM insertion and termination introduce minimal latency but consume overhead bandwidth. Each active TCM level requires additional processing at monitoring points. Network operators should define clear policies for TCM usage, including which network segments warrant monitoring and how performance data will be collected and analyzed.
OTN Payload Type Monitoring
The OPU layer payload type indicator (PT) identifies the client signal type and mapping method. Mismatches between expected and received PT values indicate provisioning errors or upstream failures. For Ethernet over OTN, the Generic Framing Procedure (GFP) adds an additional monitoring layer with its own error detection and performance monitoring mechanisms.
Client Signal Fail (CSF) indications propagate client-layer failures through the OTN network, enabling end-to-end fault correlation. Different CSF types indicate various client failure conditions, supporting appropriate responses at the client layer.
Ethernet Layer Performance Monitoring
Ethernet Service Monitoring Framework
Ethernet has become the dominant client interface for optical transport networks, with data rates scaling from 1 Gigabit Ethernet through 400GbE and beyond. Performance monitoring of Ethernet services encompasses both infrastructure monitoring (ensuring physical layer health) and service-level monitoring (verifying application performance and SLA compliance).
The MEF (Metro Ethernet Forum) and IEEE 802.1ag/802.3ah standards define comprehensive frameworks for Ethernet service performance monitoring. These standards introduce concepts including Connectivity Fault Management (CFM), Ethernet Linear Protection (ELPS), and service OAM (Operations, Administration, and Maintenance) that enable carrier-grade service delivery over Ethernet infrastructure.
Frame-Level Performance Metrics
Ethernet performance monitoring focuses on frame-level metrics including Frame Loss Ratio (FLR), Frame Delay (FD), Frame Delay Variation (FDV, commonly called jitter), and Frame Throughput. These metrics directly relate to application performance and user experience, making them essential for service quality assurance.
FD = Treceive - Ttransmit
FDV = |FDi - FDi-1|
Throughput = (Successfully Received Frames × Frame Size) / Measurement Period
Error Detection and Monitoring
Ethernet frame integrity relies on Frame Check Sequence (FCS) verification using 32-bit CRC. FCS errors indicate corruption during transmission due to electrical noise, optical impairments, or equipment malfunctions. High FCS error rates suggest physical layer problems requiring investigation, such as dirty optical connectors, marginal OSNR, or faulty transceivers.
Additional error conditions include runt frames (smaller than 64 bytes), jabber frames (larger than maximum permitted size), and collision events in shared media environments. While collisions are largely irrelevant in modern switched networks, monitoring for abnormal conditions helps identify configuration errors or malfunctioning equipment.
Service Level Monitoring with CFM
Connectivity Fault Management (CFM) defined in IEEE 802.1ag provides hierarchical fault isolation and service verification through a set of OAM protocols. CFM organizes the network into Maintenance Domains at different hierarchical levels (operator, customer, service), each with defined Maintenance End Points (MEPs) and Maintenance Intermediate Points (MIPs).
CFM Functions and Protocols
Continuity Check Messages (CCM) provide continuous connectivity verification, transmitted periodically between MEPs within a Maintenance Domain. Loss of CCM indicates a connectivity failure, triggering rapid fault detection without waiting for higher-layer timeout mechanisms. CCM intervals can be configured from 3.3 ms to 10 minutes depending on application requirements.
Loopback Messages (LBM) and Loopback Reply (LBR) enable on-demand connectivity verification and latency measurement to specific points in the network. Link Trace Messages (LTM) discover the path between MEPs, identifying all MIPs along the route. These diagnostic tools enable rapid fault isolation when problems occur.
Performance monitoring extensions to CFM add capabilities for frame loss measurement, frame delay measurement, and synthetic traffic generation. Dual-Ended Loss Measurement (DLM) and Single-Ended Loss Measurement (SLM) provide flexible options for FLR assessment with different monitoring architectures.
| CFM Message Type | Purpose | Transmission | Response Required |
|---|---|---|---|
| CCM | Continuity verification | Periodic (multicast) | No |
| LBM/LBR | On-demand connectivity test | On-demand (unicast) | Yes (LBR) |
| LTM/LTR | Path discovery | On-demand (multicast) | Yes (LTR from MIPs) |
| AIS | Alarm indication | Event-triggered (multicast) | No |
| LCK | Lock signal | Administrative (multicast) | No |
Y.1731 Performance Monitoring
ITU-T Y.1731 extends Ethernet OAM with comprehensive performance monitoring capabilities designed for carrier Ethernet services. Y.1731 defines standardized methods for measuring frame loss, frame delay, and frame delay variation, enabling objective service quality assessment and SLA verification.
Loss Measurement Methods
Y.1731 specifies both proactive and on-demand loss measurement. Loss Measurement Messages (LMM) and Loss Measurement Reply (LMR) enable direct frame loss assessment between MEPs. The protocol includes transaction identifiers and frame counters enabling accurate loss calculation even in the presence of out-of-order delivery.
Synthetic Loss Measurement (SLM) generates artificial test frames for dedicated loss monitoring without relying on service traffic. This approach enables service verification before customer traffic activation and continuous monitoring alongside production traffic.
Delay and Jitter Measurement
One-way and two-way delay measurement protocols provide latency assessment with microsecond-level accuracy. Two-way measurement using Delay Measurement Messages (DMM) and Delay Measurement Reply (DMR) does not require clock synchronization between endpoints, simplifying deployment. One-way measurement offers more precise latency assessment but requires synchronized clocks (typically via PTP or GPS).
where T1 = transmission time at MEP-A, T2 = reception time at MEP-B,
T3 = transmission time at MEP-B, T4 = reception time at MEP-A
One-Way Delay = Treceive - Ttransmit (requires synchronized clocks)
Service Level Agreement Monitoring
SLA monitoring aggregates performance metrics over defined intervals to verify compliance with contractual commitments. Common SLA parameters include availability (percentage of time service is operational), maximum frame loss ratio over measurement intervals, maximum frame delay and delay variation, and mean time to repair (MTTR) for service-affecting failures.
Automated SLA monitoring systems continuously collect performance data, comparing measurements against threshold values. Violations trigger alarms and may automatically generate service credits or reports for customer review. Integration with network management systems enables correlation of SLA violations with underlying infrastructure events, supporting root cause analysis.
SLA Monitoring Best Practices
Define measurement intervals and methodologies clearly in service contracts to avoid disputes. Use standardized monitoring protocols (Y.1731, RFC 2544) for objective, verifiable results. Implement independent monitoring from customer perspective where possible, not relying solely on provider infrastructure. Maintain detailed historical records for trend analysis and capacity planning. Establish clear escalation procedures for SLA violations requiring remediation.
Machine Learning Applications in Performance Monitoring
Overview of ML in Optical Networks
Machine learning and artificial intelligence represent transformative technologies for optical network monitoring and management. ML algorithms can identify complex patterns in monitoring data that would be difficult or impossible to detect through conventional rule-based approaches. Applications span failure prediction, automated fault diagnosis, performance optimization, and intelligent traffic engineering.
The massive volumes of monitoring data generated by modern optical networks—encompassing thousands of parameters across hundreds or thousands of network elements—exceed human capability for real-time analysis. ML techniques excel at processing this data scale, extracting meaningful insights, and enabling automated response to network conditions. Deep learning approaches can discover hidden relationships between seemingly unrelated parameters, supporting holistic network optimization.
Supervised Learning for Impairment Recognition
Supervised learning algorithms trained on labeled datasets can classify network impairments and predict performance degradation. Training data typically includes monitoring parameters (OSNR, BER, dispersion, etc.) along with labels indicating impairment types or severity levels. Common supervised learning approaches include artificial neural networks (ANNs), support vector machines (SVMs), and random forests.
Modulation Format Identification
Autonomous modulation format identification enables flexible, multi-format networks where different channels or paths may employ different modulation schemes. ML classifiers trained on signal features (constellation characteristics, spectral properties, amplitude histograms) can identify formats including BPSK, QPSK, 8-QAM, 16-QAM, and higher-order schemes with accuracy exceeding 95% in the presence of moderate OSNR degradation.
Feature extraction for format identification can use delay-tap sampling outputs, RF spectrum analysis, or asynchronous amplitude histograms. ANN classifiers with multiple hidden layers demonstrate robust performance across various OSNR conditions and in the presence of chromatic dispersion. Format identification enables cognitive optical networks that adapt modulation based on channel conditions.
OSNR Monitoring with Neural Networks
ANN-based OSNR monitoring addresses challenges including in-band noise estimation, operation with large chromatic dispersion, and nonlinearity tolerance. Networks trained on RF spectrum features can estimate OSNR for PDM-QPSK systems in the presence of CD exceeding 3000 ps/nm where conventional methods fail. Multiple parallel ANNs can provide OSNR estimates across different CD ranges, with a CD classifier selecting the appropriate estimator.
Unsupervised Learning for Anomaly Detection
Unsupervised learning techniques identify abnormal network behavior without requiring labeled training data. These methods learn normal operating patterns from historical data, flagging deviations that may indicate emerging problems. Common approaches include clustering algorithms, principal component analysis (PCA), and autoencoders.
K-Means Clustering for Performance Analysis
K-means clustering groups network elements or time periods exhibiting similar performance characteristics. Clusters might represent "healthy operation," "moderate degradation," and "severe impairment" states. Elements transitioning between clusters over time indicate changing conditions requiring attention. This technique supports large-scale network analysis where manual review of individual element performance would be impractical.
Autoencoder-Based Anomaly Detection
Autoencoders learn compressed representations of normal network behavior through neural network architectures that reconstruct input monitoring data. High reconstruction error indicates data patterns differing from learned normal behavior, potentially representing faults or attacks. This approach can detect novel anomalies not present in training data, providing protection against zero-day failures or security threats.
Reinforcement Learning for Network Optimization
Reinforcement learning (RL) enables autonomous network optimization through trial-and-error interaction with the network environment. RL agents learn optimal policies for actions such as modulation format selection, route selection, and resource allocation by receiving rewards for good decisions and penalties for poor ones.
Deep reinforcement learning combining RL with deep neural networks enables handling of high-dimensional state spaces and complex action spaces characteristic of optical networks. Applications include cognitive routing that adapts to changing network conditions, intelligent restoration that predicts best recovery paths, and proactive maintenance scheduling based on predicted component failures.
RL for Quality of Transmission Optimization
RL agents can optimize quality of transmission (QoT) by learning which combination of transmit power, modulation format, and FEC overhead maximizes capacity for given path characteristics. The agent explores different configurations, observing resulting BER and OSNR. Over time, it learns optimal policies that balance reach versus capacity. Unlike model-based optimization requiring accurate physical layer models, RL learns directly from operational network behavior.
Failure Prediction and Predictive Maintenance
ML enables transition from reactive to predictive maintenance by identifying precursor patterns that precede equipment failures. Training on historical data showing gradual degradation leading to failures allows models to predict remaining useful life of components. Common indicators include increasing FEC correction rates, gradual OSNR degradation, rising laser temperatures, and increasing bit error rates.
Predictive maintenance offers significant operational benefits including reduced mean time to repair (through pre-positioning of replacement components), minimized service impact (through proactive repair during maintenance windows), and reduced truck rolls (through accurate fault identification before dispatch). Studies suggest predictive maintenance can reduce maintenance costs by 30-40% compared to reactive approaches.
Time Series Analysis for Degradation Prediction
Long Short-Term Memory (LSTM) networks and other recurrent neural network architectures excel at time series prediction, making them well-suited for forecasting component degradation. These networks learn temporal dependencies in monitoring data, predicting future values based on historical patterns. Deviations from predicted behavior or predicted values exceeding thresholds trigger maintenance alerts.
| ML Technique | Application | Advantages | Challenges |
|---|---|---|---|
| Supervised ANNs | Impairment classification, OSNR estimation | High accuracy, well-understood | Requires labeled training data |
| K-Means Clustering | Performance grouping, anomaly detection | Simple, computationally efficient | Requires predefined cluster count |
| Autoencoders | Unsupervised anomaly detection | No labeled data needed, detects novel issues | Complex architecture, interpretability |
| Deep RL | Network optimization, routing | Learns optimal policies, adapts to changes | Training complexity, convergence time |
| LSTM Networks | Failure prediction, time series | Captures temporal dependencies | Computational cost, data requirements |
| Random Forests | Multi-impairment monitoring | Robust, handles mixed features | Less accurate than deep learning |
Challenges and Implementation Considerations
While ML offers significant potential benefits, practical deployment faces several challenges. Data quality and availability represent critical concerns—ML models require large volumes of accurately labeled data for training. Many network operators lack comprehensive historical datasets with proper labeling of fault conditions. Creating synthetic training data through simulation can partially address this limitation but may not capture all real-world phenomena.
Model interpretability and explainability become important when ML drives operational decisions. Deep learning models often function as "black boxes" where the reasoning behind predictions is unclear. For critical network operations, operators need confidence that automated decisions are based on sound logic, requiring techniques for explaining model outputs.
Computational requirements for training complex models can be substantial, particularly for deep learning approaches. However, once trained, many models execute efficiently for inference, enabling real-time operation. Edge computing architectures distributing intelligence to network elements may provide optimal balance between centralized training and distributed inference.
ML Deployment Best Practices
Start with well-defined use cases showing clear value propositions. Establish data collection and labeling procedures to build quality training datasets. Implement human-in-the-loop validation for critical automated decisions. Plan for continuous model retraining as network conditions evolve. Maintain fallback manual procedures for situations where ML predictions are uncertain or unavailable. Document model behavior and limitations clearly for operational staff.
Cross-Layer Performance Monitoring and Correlation
Multi-Layer Monitoring Architecture
Modern optical networks operate across multiple protocol layers, each with specific monitoring capabilities and performance metrics. Effective network management requires integrating monitoring data across these layers to achieve complete visibility and enable root cause analysis. Cross-layer correlation techniques link events at different layers, identifying relationships that would be invisible when examining individual layers in isolation.
A comprehensive monitoring architecture spans from the physical optical layer through OTN transport layers to Ethernet service layers and potentially IP/MPLS layers above. Each layer provides specific insights: optical monitoring reveals fiber plant issues and amplifier problems, OTN monitoring shows transmission quality and error correction effectiveness, Ethernet monitoring demonstrates service-level performance, and IP layer monitoring indicates application behavior.
Alarm Correlation and Root Cause Analysis
Single network failures often trigger cascading alarms across multiple layers and network elements. For example, a fiber cut generates loss of signal alarms at the optical layer, OTU alarms at all affected channels, ODU path alarms downstream of the failure, Ethernet link down indications, and potential routing protocol notifications at the IP layer. Distinguishing the root cause failure from consequent alarms is essential for efficient troubleshooting.
Alarm correlation engines analyze temporal and topological relationships between alarms to identify root causes. Sophisticated systems employ rule-based correlation (using predefined patterns of alarm propagation), model-based correlation (using network topology and protocol behavior models), or AI-based correlation (using machine learning to discover alarm relationships from historical data).
Correlation Techniques
Temporal correlation identifies alarms occurring within short time windows as potentially related. Events within milliseconds likely share a common cause, while events hours apart are probably independent. Spatial correlation examines topological relationships—alarms on adjacent network elements or dependent services suggest a shared cause. Functional correlation considers protocol dependencies—an OTN LOF alarm should be accompanied by consequent ODU alarms on affected paths.
End-to-End Service Monitoring
Service-centric monitoring focuses on the customer experience rather than individual network element performance. End-to-end monitoring tracks service metrics from ingress to egress, correlating infrastructure performance with service quality. This approach aligns monitoring with business objectives—customers care about service availability and performance, not intermediate network element states.
Implementing end-to-end monitoring requires service awareness at the monitoring system. Path tracking capabilities identify which network elements and resources carry specific services. When performance degradation affects a service, the system can immediately identify all impacted customers and services, enabling rapid impact assessment and appropriate prioritization.
Performance Data Aggregation and Analysis
The volume of performance monitoring data in large networks is staggering—thousands of parameters sampled at sub-second intervals from thousands of network elements generate terabytes of data daily. Effective management requires intelligent data aggregation, storage, and analysis strategies.
Time-Series Data Management
Monitoring data exhibits time-series characteristics with temporal correlation and periodic patterns. Specialized time-series databases optimized for sequential data storage and retrieval provide efficient storage and query capabilities. Downsampling techniques reduce storage requirements by aggregating high-resolution short-term data into coarser-resolution long-term trends while preserving essential patterns.
Anomaly detection algorithms identify unusual patterns in time-series data, flagging potential problems requiring investigation. Statistical methods compare current behavior against historical baselines, triggering alerts for significant deviations. Machine learning approaches can learn complex normal patterns, detecting subtle anomalies that simple threshold-based approaches would miss.
Software-Defined Monitoring
Software-defined networking (SDN) principles applied to monitoring enable flexible, programmable monitoring configurations adapted to specific network conditions or operational needs. SDN-based monitoring architectures separate the monitoring control plane (defining what to monitor and where) from the monitoring data plane (actual measurement and data collection), enabling centralized orchestration of distributed monitoring resources.
Programmable monitoring can dynamically adjust monitoring intensity based on observed network conditions. Normal operation might use coarse monitoring to conserve resources, while automatic transition to detailed monitoring occurs when anomalies are detected. This adaptive approach balances monitoring comprehensiveness against system overhead and data storage requirements.
Future Trends and Research Directions
Quantum Communications Monitoring
Quantum key distribution (QKD) and other quantum communication technologies introduce unique monitoring requirements. Quantum states cannot be measured without disturbance, precluding conventional signal quality assessment techniques. Monitoring approaches for quantum channels focus on detecting eavesdropping attempts through quantum bit error rate (QBER) analysis and ensuring proper system calibration for secure key generation.
Integration of quantum and classical communications over shared fiber infrastructure requires monitoring both domains while avoiding interference. Co-existence monitoring verifies that classical channel power levels and Raman amplification don't introduce excessive noise into quantum channels, while quantum measurements don't affect classical signal quality.
Space-Division Multiplexing Monitoring
Multi-core and multi-mode fibers enabling space-division multiplexing (SDM) present new monitoring challenges. Inter-core or inter-mode crosstalk becomes a significant impairment requiring measurement and management. Monitoring systems must assess not only individual spatial channels but also coupling between channels and mode-dependent loss variations.
MIMO (multiple-input multiple-output) DSP techniques used in SDM systems enable new monitoring approaches based on analysis of crosstalk matrices and mode-coupling characteristics. Machine learning can potentially optimize launch conditions and detect fiber degradation affecting specific cores or modes.
Autonomous Networks and Zero-Touch Operation
The vision of fully autonomous optical networks with zero-touch provisioning and self-healing capabilities drives significant research in intelligent monitoring and control. Autonomous networks require not only comprehensive monitoring but also decision-making frameworks that translate monitoring data into corrective actions without human intervention.
Closed-loop control systems use monitoring feedback to automatically optimize network configurations. Cognitive optical networks learn optimal operating parameters through reinforcement learning, adapting to changing traffic patterns and component aging. Intent-based networking abstracts high-level service requirements into specific monitoring and control policies, enabling business-driven network automation.
Edge Intelligence and Distributed Monitoring
Pushing intelligence to network edges enables faster response to local conditions while reducing centralized processing requirements. Edge computing platforms at network elements can perform real-time analysis of monitoring data, implementing immediate responses to detected anomalies while reporting summarized information to centralized management.
Distributed machine learning frameworks enable training and inference across multiple edge nodes while preserving data privacy and reducing bandwidth requirements for transporting raw monitoring data. Federated learning approaches allow multiple network domains to collaboratively improve ML models without sharing sensitive operational data.
Digital Twin Technology
Digital twins—detailed virtual replicas of physical networks—enable advanced what-if analysis and predictive simulation. High-fidelity network models continuously updated with real monitoring data can predict the impact of configuration changes, evaluate failure scenarios, and optimize network planning decisions. Monitoring systems feed digital twins, while simulation results guide monitoring focus and interpretation.
Combining digital twins with machine learning enables training sophisticated models on simulated data augmenting limited real-world failure data. Reinforcement learning agents can explore network optimization strategies in the digital twin environment before deploying policies in the production network.
Research Opportunities
Key research areas include: ML techniques robust to concept drift as network conditions evolve, explainable AI providing transparent reasoning for automated decisions, integration of quantum and classical monitoring in converged networks, scalable monitoring architectures for terabit-per-second per-channel systems, privacy-preserving monitoring in multi-domain environments, and real-time optimization algorithms balancing multiple conflicting objectives.
Conclusion and Recommendations
Optical performance monitoring has evolved from simple power measurements to sophisticated multi-layer, AI-enhanced systems providing comprehensive network visibility. Modern monitoring architectures integrate measurements across physical, optical transport, and service layers, enabling holistic network management and service assurance. The transition from reactive to predictive operations, enabled by machine learning and advanced analytics, represents a fundamental shift in network management philosophy.
Effective monitoring implementation requires careful consideration of business objectives, technical requirements, and operational constraints. Organizations should adopt layered approaches, establishing basic infrastructure monitoring before advancing to sophisticated AI-based predictive systems. Clear definitions of key performance indicators aligned with service level agreements enable objective assessment of network health and service quality.
Implementation Recommendations
Planning Phase
- Define clear monitoring objectives and success criteria
- Inventory existing monitoring capabilities and gaps
- Assess data collection and storage infrastructure
- Establish baseline performance metrics
- Plan for scalability and future growth
Deployment Phase
- Implement comprehensive physical layer monitoring
- Deploy OTN and Ethernet service monitoring
- Establish alarm correlation and management
- Integrate with existing OSS/BSS systems
- Train operations staff on new capabilities
Optimization Phase
- Refine threshold settings based on operational experience
- Implement advanced analytics and ML capabilities
- Develop predictive maintenance programs
- Enable closed-loop automation where appropriate
- Continuously assess and improve monitoring effectiveness
Looking forward, the convergence of optical networking with artificial intelligence, cloud computing, and edge intelligence will drive continued evolution in performance monitoring capabilities. Organizations investing in flexible, scalable monitoring architectures today will be well-positioned to leverage emerging technologies as they mature. The ultimate goal remains ensuring reliable, high-quality optical services through comprehensive visibility, intelligent analysis, and automated response—enabling networks that are truly self-aware, self-optimizing, and self-healing.
Developed by MapYourTech Team
For educational purposes in optical networking and telecommunications systems
Note: This comprehensive guide is based on industry standards, academic research, and real-world implementation experiences. Specific implementations may vary based on equipment capabilities, network topology, and operational requirements. Always consult with qualified network engineers and follow manufacturer documentation for actual deployments.
Unlock Premium Content
Join over 400K+ optical network professionals worldwide. Access premium courses, advanced engineering tools, and exclusive industry insights.
Already have an account? Log in here