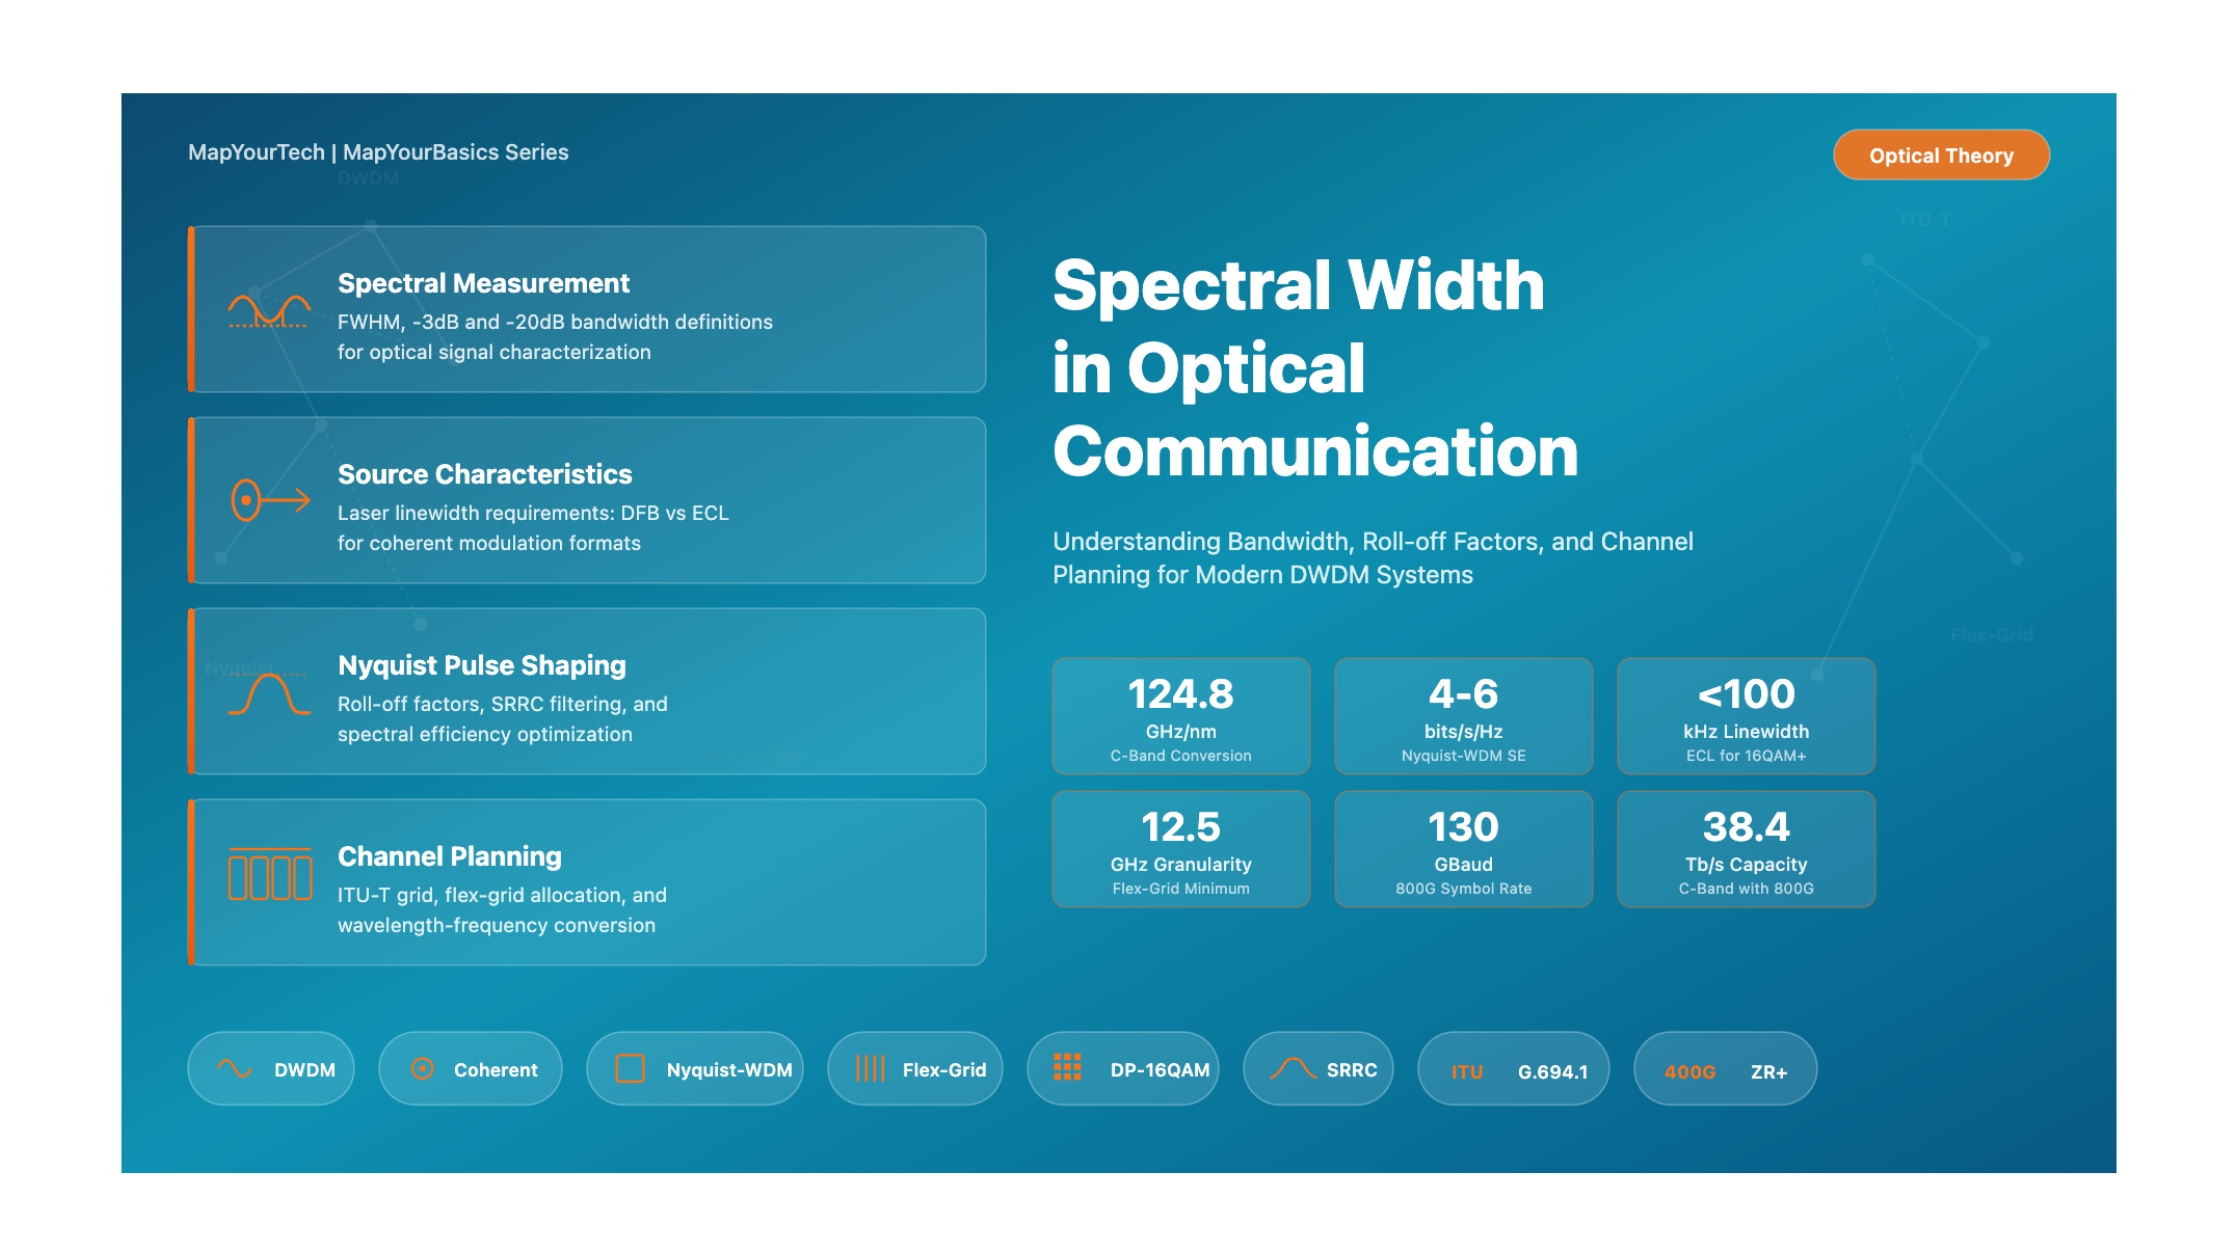
Spectral Width in Optical Communication
A Comprehensive Guide to Understanding Signal Bandwidth and Its Impact on Modern Optical Networks
Continue Reading This Article
Sign in with a free account to unlock the full article and access the complete MapYourTech knowledge base.
1. Introduction
Spectral width is a fundamental parameter in optical communication systems that defines the range of frequencies or wavelengths over which an optical signal is distributed. As optical networks evolve toward higher data rates and greater spectral efficiency, understanding spectral width becomes essential for network engineers designing Dense Wavelength Division Multiplexing (DWDM) systems, coherent transmission links, and next-generation optical transport networks.
The concept of spectral width encompasses multiple aspects of optical transmission. From the inherent linewidth of laser sources to the bandwidth occupied by modulated signals, spectral width directly influences system capacity, transmission reach, and susceptibility to various impairments including chromatic dispersion and nonlinear effects. This article provides a comprehensive examination of spectral width, its measurement, contributing factors, and practical implications for modern optical networks.
The scope of this guide covers both source spectral characteristics (laser linewidth) and modulated signal spectral width, exploring how these parameters interact with fiber characteristics to determine overall system performance. Engineers will gain practical insights into optimizing spectral width for maximum capacity while maintaining signal integrity over long transmission distances.
2. Definition and Fundamental Concepts
2.1 What is Spectral Width?
Spectral width refers to the range of frequencies (measured in GHz or THz) or wavelengths (measured in nm) over which the optical signal power is distributed. In DWDM systems, spectral width determines how closely optical channels can be spaced, directly impacting the total network capacity achievable within the available fiber bandwidth.
Spectral Width is the bandwidth occupied by an optical signal, typically measured as the Full Width at Half Maximum (FWHM) of the optical power spectrum, expressed in frequency (GHz) or wavelength (nm) units.
The spectral width of an optical signal depends on two primary components: the inherent spectral characteristics of the optical source (laser linewidth) and the bandwidth added through the modulation process. For modern coherent optical systems, the modulated signal bandwidth dominates, while the laser linewidth becomes critical for higher-order modulation formats.
2.2 Spectral Width Measurement Methods
Spectral width can be characterized using several measurement approaches, each suitable for different aspects of optical signal analysis.
| Measurement Method | Application | Typical Resolution | Advantages |
|---|---|---|---|
| Full Width at Half Maximum (FWHM) | General spectral characterization | 0.01-0.1 nm | Industry standard, easy to compare |
| Root Mean Square (RMS) | Statistical analysis of spectrum shape | Depends on OSA | Accounts for spectral shape variations |
| -3 dB Bandwidth | Modulated signal analysis | 0.1 GHz | Direct correlation to signal processing |
| -20 dB Bandwidth | Channel isolation assessment | 0.1 GHz | Important for DWDM crosstalk analysis |
3. Optical Source Spectral Characteristics
3.1 Laser Linewidth
The spectral width of a laser source, commonly referred to as linewidth, represents the inherent frequency distribution of the unmodulated optical carrier. Laser linewidth is a critical parameter for coherent optical systems, as it directly affects the system's tolerance to phase noise and determines the feasibility of using higher-order modulation formats.
Distributed Feedback (DFB) Laser
Typical Linewidth: 0.5 - 2 MHz
Applications: Direct detection systems, 100G coherent with QPSK
Characteristics: Lorentz-type linewidth profile, compact form factor, lower cost
External Cavity Laser (ECL)
Typical Linewidth: 10 - 100 kHz
Applications: High-SE coherent systems, 16QAM and higher modulation
Characteristics: Narrow linewidth, excellent wavelength stability, higher cost
The linewidth of a laser is characterized by its spectral profile, which for semiconductor lasers typically follows a Lorentzian distribution. The narrower the linewidth, the more stable the optical phase, which is essential for coherent detection systems that encode information in both amplitude and phase of the optical carrier.
/* Laser Linewidth and Phase Noise Relationship */

Δν = Δφ2 / (2π × τ)

/* OSNR Penalty Due to Laser Linewidth */

OSNRpenalty = f(Δν × Ts)

/* Where Ts is the symbol period */
Where:
Δν = Laser linewidth (Hz)
Δφ = Phase deviation (radians)
τ = Observation time (seconds)
Ts = Symbol period (seconds)
3.2 Linewidth Requirements for Different Modulation Formats
Higher-order modulation formats require narrower laser linewidths because they pack constellation points more closely in the phase domain. The linewidth-symbol rate product is a key figure of merit that determines system performance.
| Modulation Format | Bits/Symbol | Max Linewidth (32 Gbaud) | OSNR Requirement |
|---|---|---|---|
| QPSK (4-QAM) | 2 | 1-2 MHz | ~12 dB |
| 8-QAM | 3 | 500 kHz - 1 MHz | ~15 dB |
| 16-QAM | 4 | 100-500 kHz | ~18 dB |
| 32-QAM | 5 | 50-100 kHz | ~21 dB |
| 64-QAM | 6 | 10-50 kHz | ~24 dB |
4. Modulated Signal Spectral Width
4.1 Relationship Between Baud Rate and Spectral Width
For modulated optical signals, the spectral width is primarily determined by the symbol rate (baud rate) and the pulse shaping applied to the signal. The fundamental relationship between baud rate and spectral width forms the basis for DWDM channel planning and spectral efficiency optimization.
/* Fundamental Spectral Width Formula */

Spectral Width = Baud Rate × (1 + ρ)

/* Example: 64 Gbaud signal with roll-off 0.1 */

SW = 64 GHz × (1 + 0.1) = 70.4 GHz
Where:
ρ (rho) = Roll-off factor (0 to 1)
Baud Rate = Symbol rate (GBaud or GHz)
A 400G coherent transceiver using 64 Gbaud with DP-16QAM modulation:
Bit Rate: 64 Gbaud × 4 bits/symbol × 2 polarizations = 512 Gb/s (gross)
Spectral Width: 64 GHz × (1 + 0.1) = 70.4 GHz (with 10% roll-off)
Channel Spacing: Typically 75 GHz or 100 GHz in DWDM systems
Spectral Efficiency: ~5.3 bits/s/Hz (net, after FEC overhead)
4.2 The Nyquist Theorem and Roll-Off Factor
The Nyquist theorem establishes the theoretical minimum bandwidth required to transmit data without intersymbol interference (ISI). According to this theorem, the minimum bandwidth equals half the baud rate. However, practical systems require additional bandwidth characterized by the roll-off factor.
/* Nyquist Minimum Bandwidth */

Bmin = Rs / 2

/* Actual Bandwidth with Roll-off Factor */

Bactual = Rs × (1 + ρ)

/* Raised-Cosine Spectrum Bandwidth */

BRC = (1 + ρ) / (2 × T)
Where:
Rs = Symbol rate (GBaud)
ρ = Roll-off factor (typically 0.01 to 0.5)
T = Symbol period (seconds)
4.3 Nyquist-WDM and Super-Nyquist Systems
Nyquist-WDM technology enables channel spacing equal to or very close to the symbol rate by using tight spectral shaping. This approach maximizes spectral efficiency while maintaining acceptable crosstalk levels between adjacent channels.
Conventional WDM
Channel Spacing: > Symbol Rate
Guard Band: Yes, between channels
Spectral Efficiency: 2-3 bits/s/Hz typical
Crosstalk: Low, minimal filtering needed
Nyquist-WDM
Channel Spacing: = Symbol Rate
Guard Band: No (spectra touch)
Spectral Efficiency: 4-6 bits/s/Hz achievable
Crosstalk: Requires precise spectral shaping
Super-Nyquist WDM
Channel Spacing: < Symbol Rate
Guard Band: Negative (spectra overlap)
Spectral Efficiency: >6 bits/s/Hz possible
Crosstalk: Managed via advanced DSP
5. Spectral Width Calculator
Interactive Spectral Width Calculator
Adjust the parameters below to calculate spectral width and related metrics for your optical system.
6. Impact of Spectral Width on Optical Transmission
6.1 Chromatic Dispersion Effects
Chromatic dispersion causes different frequency components of an optical signal to travel at different velocities through the fiber. Signals with broader spectral width experience greater pulse broadening, leading to increased intersymbol interference and reduced transmission reach.
/* Pulse Broadening Due to Chromatic Dispersion */

Δτ = D × L × Δλ

/* Example: 100 km SSMF, 17 ps/nm/km dispersion, 0.6 nm spectral width */

Δτ = 17 ps/nm/km × 100 km × 0.6 nm = 1020 ps
Where:
Δτ = Pulse broadening (ps)
D = Dispersion coefficient (ps/nm/km)
L = Fiber length (km)
Δλ = Spectral width (nm)
For a 69 Gbaud signal with 75 GHz spectral width (0.6 nm at 1550 nm) propagating over pure silica core fiber with 22 ps/nm/km dispersion, the two extreme spectral components are delayed by 13.2 ps per kilometer. After 1000 km, pulse broadening corresponds to approximately 900 times the symbol period (14.4 ps), requiring sophisticated DSP compensation.
6.2 DWDM Channel Capacity Considerations
The relationship between spectral width and DWDM system capacity involves fundamental trade-offs. Narrower spectral width allows more channels within available bandwidth but may require higher OSNR. Broader spectral width enables higher per-channel bit rates but reduces total channel count.
6.3 Reach vs. Capacity Trade-offs
The spectral width of an optical signal affects transmission reach through multiple mechanisms. Broader spectral width increases susceptibility to chromatic dispersion and requires higher OSNR, both of which reduce achievable transmission distance.
| System Configuration | Spectral Width | OSNR Required | Typical Reach |
|---|---|---|---|
| 100G DP-QPSK, 32 Gbaud | ~35 GHz | 12-14 dB | 4000+ km |
| 200G DP-16QAM, 32 Gbaud | ~35 GHz | 18-20 dB | 1500-2500 km |
| 400G DP-16QAM, 64 Gbaud | ~70 GHz | 19-21 dB | 1000-1500 km |
| 400G DP-QPSK, 64 Gbaud (2λ) | ~70 GHz per λ | 14-16 dB | 3000+ km |
| 800G DP-64QAM, 90 Gbaud | ~100 GHz | 26-28 dB | 200-500 km |
7. Spectral Shaping Techniques
7.1 Digital vs. Optical Spectral Shaping
Modern coherent optical systems employ spectral shaping to minimize spectral width while maintaining signal integrity. Two primary approaches exist: digital spectral shaping in the transmitter DSP and optical filtering using external components.
Digital Spectral Shaping
Method: DSP-based FIR filtering before DAC
Roll-off Achievable: 0.01 to 0.5
Advantages: Precise control, flexible, no additional optical components
Challenges: Requires high-resolution DAC, increased DSP complexity
Optical Spectral Shaping
Method: Optical filters (WSS, Waveshaper)
Roll-off Achievable: Depends on filter design
Advantages: Independent of electrical bandwidth
Challenges: Filter cost, insertion loss, less precise than digital
7.2 Square Root Raised Cosine (SRRC) Filtering
The SRRC filter is the most commonly used pulse shaping filter in coherent optical systems. When matched SRRC filters are used at both transmitter and receiver, the overall system response achieves the ideal raised cosine shape that satisfies Nyquist ISI criterion.
/* SRRC Filter Transfer Function */

HSRRC(f) = sqrt(HRC(f))

/* Raised Cosine (RC) Spectrum */

HRC(f) =
    1                           for |f| ≤ (1-ρ)/(2T)
    0.5[1 + cos(πT/ρ(|f|-(1-ρ)/2T))]  for (1-ρ)/(2T) < |f| ≤ (1+ρ)/(2T)
    0                           for |f| > (1+ρ)/(2T)
Where:
T = Symbol period (seconds)
ρ = Roll-off factor (0 to 1)
f = Frequency (Hz)
The roll-off factor represents a fundamental trade-off in pulse shaping. Lower roll-off values achieve higher spectral efficiency but require longer filter lengths (more FIR taps) and create pulses with more pronounced time-domain ringing, increasing sensitivity to timing errors.
8. Practical Applications and Design Guidelines
8.1 Channel Planning Considerations
Effective DWDM channel planning requires careful consideration of spectral width to maximize capacity while ensuring adequate channel isolation. The following guidelines help engineers optimize their channel plans.
Rule of Thumb: Minimum channel spacing should be at least 1.1 × occupied spectral width for conventional systems, or can approach 1.0 × spectral width for Nyquist-WDM systems with tight spectral shaping.
Guard Band Calculation: Guard Band = Channel Spacing - Spectral Width
Crosstalk Margin: Aim for at least 20 dB adjacent channel isolation for reliable operation.
8.2 Flex-Grid and Superchannel Considerations
Modern elastic optical networks employ flex-grid technology with 12.5 GHz or 6.25 GHz granularity, allowing spectral resources to be allocated more efficiently based on actual signal spectral width rather than fixed channel spacing.
| Grid Type | Slot Width | Typical Applications | Spectral Efficiency |
|---|---|---|---|
| Fixed 100 GHz | 100 GHz | Legacy DWDM, 10G/100G | Lower (guard bands) |
| Fixed 50 GHz | 50 GHz | 100G coherent, dense packing | Moderate |
| Flex-grid 12.5 GHz | 12.5 × n GHz | 400G/800G, superchannels | High |
| Flex-grid 6.25 GHz | 6.25 × n GHz | Ultra-high capacity, research | Very High |
8.3 Wavelength-Frequency Conversion for Channel Planning
When working with DWDM systems, engineers frequently need to convert between wavelength (nm) and frequency (GHz or THz) representations. The ITU-T grid is defined in frequency domain, but many optical instruments display measurements in wavelength. Understanding these conversions is essential for accurate channel planning and spectral width calculations.
/* Fundamental Relationship */

c = f × λ

Where:
  c  = Speed of light = 299,792,458 m/s ≈ 299.792458 THz·nm
  f  = Optical frequency
  λ  = Wavelength

/* Frequency from Wavelength */

f (THz) = c / λ (nm) = 299.792458 / λ

/* Spectral Width Conversion (Differential Form) */

Δf (GHz) = −(c / λ2) × Δλ

/* Practical formula at 1550 nm: */
Δf (GHz) = 124.8 × Δλ (nm)    at λ = 1550 nm

/* Or inversely: */
Δλ (nm) = Δf (GHz) / 124.8      at λ = 1550 nm
Key Constants at 1550 nm (C-Band Center):
• 1 nm ≈ 124.8 GHz (or ~125 GHz for quick calculations)
• 1 GHz ≈ 0.008 nm (8 pm)
• 100 GHz ≈ 0.8 nm
• 50 GHz ≈ 0.4 nm
• 12.5 GHz ≈ 0.1 nm (100 pm)
Problem: Convert a 75 GHz flex-grid slot allocation to wavelength spacing at the C-band center (1550 nm).
Solution:
Δλ = Δf / 124.8 = 75 / 124.8 = 0.601 nm (or 601 pm)
Verification: A 400G signal with 70 GHz spectral width occupies:
Δλ = 70 / 124.8 = 0.561 nm — fits within 75 GHz (0.601 nm) slot with ~5 GHz guard band
The ITU-T DWDM grid uses 193.1 THz (approximately 1552.52 nm) as the anchor frequency. All channel frequencies are defined as offsets from this reference:
fn = 193.1 + n × Δf (THz)
Where n is a positive or negative integer and Δf is the channel spacing (0.1 THz for 100 GHz grid, 0.05 THz for 50 GHz grid, or 0.0125 THz for 12.5 GHz flex-grid).
| Channel Spacing | Frequency (GHz) | Wavelength at 1550 nm | Typical Use Case |
|---|---|---|---|
| Ultra-dense | 12.5 GHz | ~0.1 nm (100 pm) | Flex-grid minimum slot |
| Dense | 25 GHz | ~0.2 nm (200 pm) | High-capacity metro |
| Standard Dense | 50 GHz | ~0.4 nm (400 pm) | 100G coherent systems |
| Flex-grid 400G | 75 GHz | ~0.6 nm (600 pm) | 400G ZR/ZR+ channels |
| Legacy Wide | 100 GHz | ~0.8 nm (800 pm) | 10G DWDM, 800G channels |
| CWDM | ~2,500 GHz | 20 nm | Coarse WDM applications |
The conversion factor (124.8 GHz/nm) is only valid near 1550 nm. At other wavelengths, the factor changes because the relationship is inversely proportional to λ²:
• At 1310 nm (O-band): 1 nm ≈ 175 GHz
• At 1550 nm (C-band): 1 nm ≈ 125 GHz
• At 1600 nm (L-band): 1 nm ≈ 117 GHz
Always use the exact formula Δf = (c/λ²) × Δλ when precision is required or when working outside the C-band.
- Spectral width is determined by both source linewidth and modulation bandwidth, with modulated signal bandwidth dominating in modern coherent systems.
- The roll-off factor creates a fundamental trade-off between spectral efficiency and implementation complexity.
- Higher-order modulation formats require narrower laser linewidths (External Cavity Lasers with <100 kHz linewidth for 16QAM and above).
- Broader spectral width increases chromatic dispersion impairment and requires higher OSNR, reducing transmission reach.
- Nyquist-WDM enables channel spacing equal to symbol rate, achieving spectral efficiencies of 4-6 bits/s/Hz with tight digital spectral shaping.
- Flex-grid technology with 12.5 GHz granularity allows efficient spectral allocation matched to actual signal bandwidth requirements.
References
[1] ITU-T Recommendation G.694.1 - Spectral grids for WDM applications: DWDM frequency grid.
[2] ITU-T Recommendation G.709 - Interfaces for the optical transport network.
[3] OIF Implementation Agreement - 400ZR, Optical Internetworking Forum.
[4] IEEE 802.3bs - 200 Gb/s and 400 Gb/s Ethernet.
[5] Sanjay Yadav, "Optical Network Communications: An Engineer's Perspective" - Bridge the Gap Between Theory and Practice in Optical Networking.
Developed by MapYourTech Team
For educational purposes in Optical Networking Communications Technologies
Note: This guide is based on industry standards, best practices, and real-world implementation experiences. Specific implementations may vary based on equipment vendors, network topology, and regulatory requirements. Always consult with qualified network engineers and follow vendor documentation for actual deployments.
Feedback Welcome: If you have any suggestions, corrections, or improvements to propose, please feel free to write to us at [email protected]

Optical Networking Engineer & Architect • Founder, MapYourTech
Optical networking engineer with nearly two decades of experience across DWDM, OTN, coherent optics, submarine systems, and cloud infrastructure. Founder of MapYourTech. Read full bio →
Related Articles on MapYourTech