Animated CTA Banner
MapYourTech
MapYourTech has always been about YOUR tech journey, YOUR questions, YOUR thoughts, and most importantly, YOUR growth. It’s a space where we "Map YOUR Tech" experiences and empower YOUR ambitions.
To further enhance YOUR experience, we are working on delivering a professional, fully customized platform tailored to YOUR needs and expectations.
Thank you for the love and support over the years. It has always motivated us to write more, share practical industry insights, and bring content that empowers and inspires YOU to excel in YOUR career.
We truly believe in our tagline:
“Share, explore, and inspire with the tech inside YOU!”
Let us know what YOU would like to see next! Share YOUR thoughts and help us deliver content that matters most to YOU.
Share YOUR Feedback
Tag

ber

Browsing

In the pursuit of ever-greater data transmission capabilities, forward error correction (FEC) has emerged as a pivotal technology, not just in wireless communication but increasingly in large-capacity, long-haul optical systems. This blog post delves into the intricacies of FEC and its profound impact on the efficiency and cost-effectiveness of modern optical networks.

The Introduction of FEC in Optical Communications

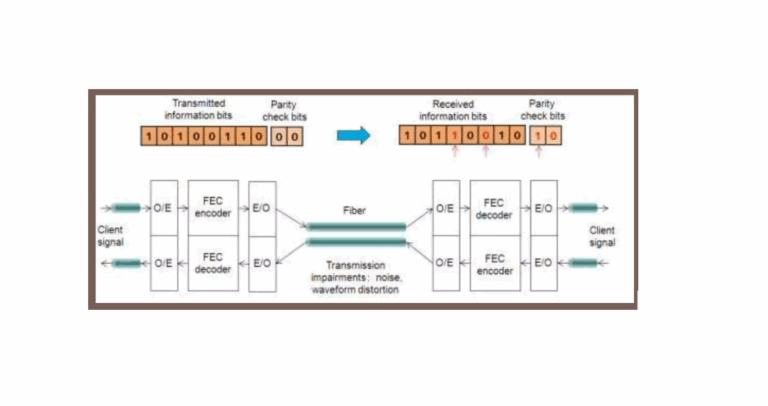
FEC’s principle is simple yet powerful: by encoding the original digital signal with additional redundant bits, it can correct errors that occur during transmission. This technique enables optical transmission systems to tolerate much higher bit error ratios (BERs) than the traditional threshold of 10−1210−12 before decoding. Such resilience is revolutionizing system design, allowing the relaxation of optical parameters and fostering the development of vast, robust networks.

Defining FEC: A Glossary of Terms

inband_outband_fec

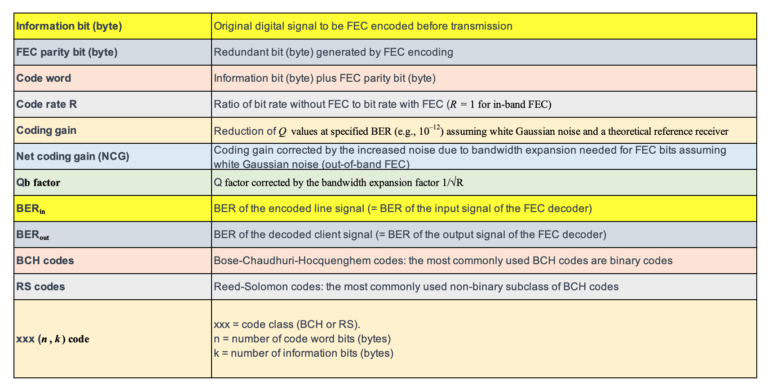
Understanding FEC starts with grasping its key terminology. Here’s a brief rundown:

  • Information bit (byte): The original digital signal that will be encoded using FEC before transmission.
  • FEC parity bit (byte): Redundant data added to the original signal for error correction purposes.
  • Code word: A combination of information and FEC parity bits.
  • Code rate (R): The ratio of the original bit rate to the bit rate with FEC—indicative of the amount of redundancy added.
  • Coding gain: The improvement in signal quality as a result of FEC, quantified by a reduction in Q values for a specified BER.
  • Net coding gain (NCG): Coding gain adjusted for noise increase due to the additional bandwidth needed for FEC bits.

The Role of FEC in Optical Networks

The application of FEC allows for systems to operate with a BER that would have been unacceptable in the past, particularly in high-capacity, long-haul systems where the cumulative noise can significantly degrade signal quality. With FEC, these systems can achieve reliable performance even with the presence of amplified spontaneous emission (ASE) noise and other signal impairments.

In-Band vs. Out-of-Band FEC

There are two primary FEC schemes used in optical transmission: in-band and out-of-band FEC. In-band FEC, used in Synchronous Digital Hierarchy (SDH) systems, embeds FEC parity bits within the unused section overhead of SDH signals, thus not increasing the bit rate. In contrast, out-of-band FEC, as utilized in Optical Transport Networks (OTNs) and originally recommended for submarine systems, increases the line rate to accommodate FEC bits. ITU-T G.709 also introduces non-standard out-of-band FEC options optimized for higher efficiency.

Achieving Robustness Through FEC

The FEC schemes allow the correction of multiple bit errors, enhancing the robustness of the system. For example, a triple error-correcting binary BCH code can correct up to three bit errors in a 4359 bit code word, while an RS(255,239) code can correct up to eight byte errors per code word.

fec_performance

Performance of standard FECs

The Practical Impact of FEC

Implementing FEC leads to more forgiving system designs, where the requirement for pristine optical parameters is lessened. This, in turn, translates to reduced costs and complexity in constructing large-scale optical networks. The coding gains provided by FEC, especially when considered in terms of net coding gain, enable systems to better estimate and manage the OSNR, crucial for maintaining high-quality signal transmission.

Future Directions

While FEC has proven effective in OSNR-limited and dispersion-limited systems, its efficacy against phenomena like polarization mode dispersion (PMD) remains a topic for further research. Additionally, the interplay of FEC with non-linear effects in optical fibers, such as self-phase modulation and cross-phase modulation, presents a rich area for ongoing study.

Conclusion

FEC stands as a testament to the innovative spirit driving optical communications forward. By enabling systems to operate with higher BERs pre-decoding, FEC opens the door to more cost-effective, expansive, and resilient optical networks. As we look to the future, the continued evolution of FEC promises to underpin the next generation of optical transmission systems, making the dream of a hyper-connected world a reality.

References

https://www.itu.int/rec/T-REC-G/e

Forward Error Correction (FEC) has become an indispensable tool in modern optical communication, enhancing signal integrity and extending transmission distances. ITU-T recommendations, such as G.693, G.959.1, and G.698.1, define application codes for optical interfaces that incorporate FEC as specified in ITU-T G.709. In this blog, we discuss the significance of Bit Error Ratio (BER) in FEC-enabled applications and how it influences optical transmitter and receiver performance.

The Basics of FEC in Optical Communications

FEC is a method of error control for data transmission, where the sender adds redundant data to its messages. This allows the receiver to detect and correct errors without the need for retransmission. In the context of optical networks, FEC is particularly valuable because it can significantly lower the BER after decoding, thus ensuring the accuracy and reliability of data across vast distances.

BER Requirements in FEC-Enabled Applications

For certain optical transport unit rates (OTUk), the system BER is mandated to meet specific standards only after FEC correction has been applied. The optical parameters, in these scenarios, are designed to achieve a BER no worse than 10−12 at the FEC decoder’s output. This benchmark ensures that the data, once processed by the FEC decoder, maintains an extremely high level of accuracy, which is crucial for high-performance networks.

Practical Implications for Network Hardware

When it comes to testing and verifying the performance of optical hardware components intended for FEC-enabled applications, achieving a BER of 10−12 at the decoder’s output is often sufficient. Attempting to test components at 10−12 at the receiver output, prior to FEC decoding, can lead to unnecessarily stringent criteria that may not reflect the operational requirements of the application.

Adopting Appropriate BER Values for Testing

The selection of an appropriate BER for testing components depends on the specific application. Theoretical calculations suggest a BER of 1.8×10⁻⁴at the receiver output (Point A) to achieve a BER of 10−12 at the FEC decoder output (Point B). However, due to variations in error statistics, the average BER at Point A may need to be lower than the theoretical value to ensure the desired BER at Point B. In practice, a BER range of 10−5 to 10−6 is considered suitable for most applications.

Conservative Estimation for Receiver Sensitivity

By using a BER of 10−6 for component verification, the measurements of receiver sensitivity and optical path penalty at Point A will be conservative estimates of the values after FEC correction. This approach provides a practical and cost-effective method for ensuring component performance aligns with the rigorous demands of FEC-enabled systems.

Conclusion

FEC is a powerful mechanism that significantly improves the error tolerance of optical communication systems. By understanding and implementing appropriate BER testing methodologies, network operators can ensure their components are up to the task, ultimately leading to more reliable and efficient networks.

As the demands for data grow, the reliance on sophisticated FEC techniques will only increase, cementing BER as a fundamental metric in the design and evaluation of optical communication systems.

References

https://www.itu.int/rec/T-REC-G/e

Signal integrity is the cornerstone of effective fiber optic communication. In this sphere, two metrics stand paramount: Bit Error Ratio (BER) and Q factor. These indicators help engineers assess the performance of optical networks and ensure the fidelity of data transmission. But what do these terms mean, and how are they calculated?

What is BER?

BER represents the fraction of bits that have errors relative to the total number of bits sent in a transmission. It’s a direct indicator of the health of a communication link. The lower the BER, the more accurate and reliable the system.

ITU-T Standards Define BER Objectives

The ITU-T has set forth recommendations such as G.691, G.692, and G.959.1, which outline design objectives for optical systems, aiming for a BER no worse than 10−12 at the end of a system’s life. This is a rigorous standard that guarantees high reliability, crucial for SDH and OTN applications.

Measuring BER

Measuring BER, especially as low as 10−12, can be daunting due to the sheer volume of bits required to be tested. For instance, to confirm with 95% confidence that a system meets a BER of 10−12, one would need to test 3×1012 bits without encountering an error — a process that could take a prohibitively long time at lower transmission rates.

The Q Factor

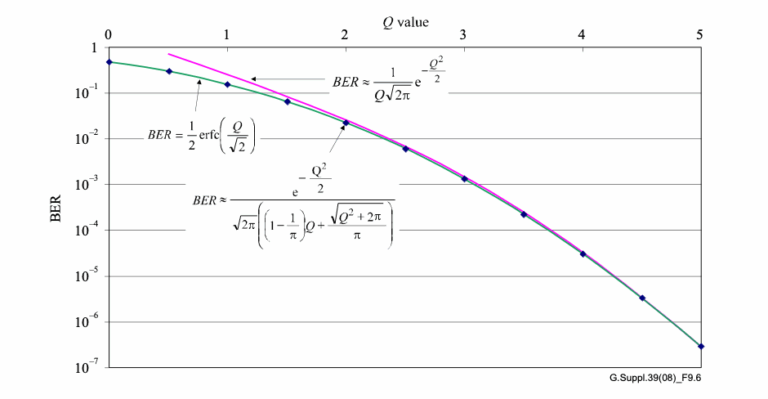
The Q factor measures the signal-to-noise ratio at the decision point in a receiver’s circuitry. A higher Q factor translates to better signal quality. For a BER of 10−12, a Q factor of approximately 7.03 is needed. The relationship between Q factor and BER, when the threshold is optimally set, is given by the following equations:

The general formula relating Q to BER is:

bertoq

A common approximation for high Q values is:

ber_t_q_2

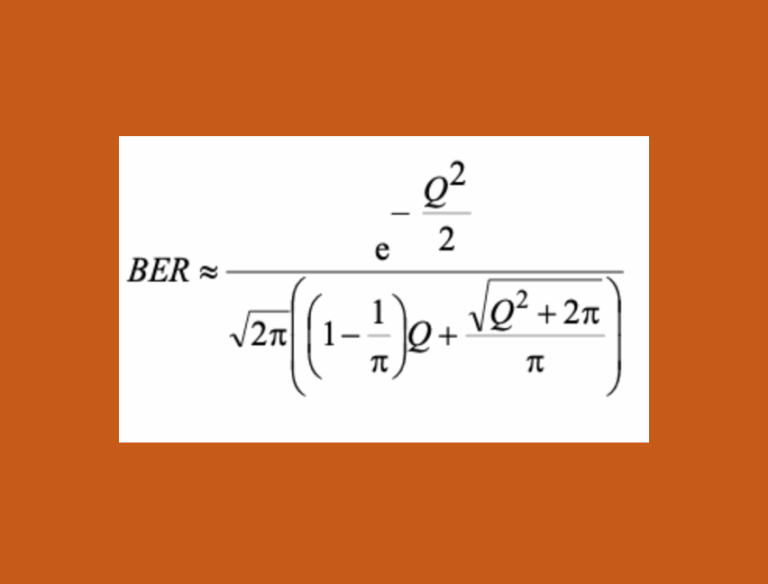
For a more accurate calculation across the entire range of Q, the formula is:

ber_t_q_3

Practical Example: Calculating BER from Q Factor

Let’s consider a practical example. If a system’s Q factor is measured at 7, what would be the approximate BER?

Using the approximation formula, we plug in the Q factor:

This would give us an approximate BER that’s indicative of a highly reliable system. For exact calculations, one would integrate the Gaussian error function as described in the more detailed equations.

Graphical Representation

ber_t_q_4

The graph typically illustrates these relationships, providing a visual representation of how the BER changes as the Q factor increases. This allows engineers to quickly assess the signal quality without long, drawn-out error measurements.

Concluding Thoughts

Understanding and applying BER and Q factor calculations is crucial for designing and maintaining robust optical communication systems. These concepts are not just academic; they directly impact the efficiency and reliability of the networks that underpin our modern digital world.

References

https://www.itu.int/rec/T-REC-G/e

In the world of optical communication, it is crucial to have a clear understanding of Bit Error Rate (BER). This metric measures the probability of errors in digital data transmission, and it plays a significant role in the design and performance of optical links. However, there are ongoing debates about whether BER depends more on data rate or modulation. In this article, we will explore the impact of data rate and modulation on BER in optical links, and we will provide real-world examples to illustrate our points.

Table of Contents

  • Introduction
  • Understanding BER
  • The Role of Data Rate
  • The Role of Modulation
  • BER vs. Data Rate
  • BER vs. Modulation
  • Real-World Examples
  • Conclusion
  • FAQs

Introduction

Optical links have become increasingly essential in modern communication systems, thanks to their high-speed transmission, long-distance coverage, and immunity to electromagnetic interference. However, the quality of optical links heavily depends on the BER, which measures the number of errors in the transmitted bits relative to the total number of bits. In other words, the BER reflects the accuracy and reliability of data transmission over optical links.

BER depends on various factors, such as the quality of the transmitter and receiver, the noise level, and the optical power. However, two primary factors that significantly affect BER are data rate and modulation. There have been ongoing debates about whether BER depends more on data rate or modulation, and in this article, we will examine both factors and their impact on BER.

Understanding BER

Before we delve into the impact of data rate and modulation, let’s first clarify what BER means and how it is calculated. BER is expressed as a ratio of the number of received bits with errors to the total number of bits transmitted. For example, a BER of 10^-6 means that one out of every million bits transmitted contains an error.

The BER can be calculated using the formula: BER = (Number of bits received with errors) / (Total number of bits transmitted)

The lower the BER, the higher the quality of data transmission, as fewer errors mean better accuracy and reliability. However, achieving a low BER is not an easy task, as various factors can affect it, as we will see in the following sections.

The Role of Data Rate

Data rate refers to the number of bits transmitted per second over an optical link. The higher the data rate, the faster the transmission speed, but also the higher the potential for errors. This is because a higher data rate means that more bits are being transmitted within a given time frame, and this increases the likelihood of errors due to noise, distortion, or other interferences.

As a result, higher data rates generally lead to a higher BER. However, this is not always the case, as other factors such as modulation can also affect the BER, as we will discuss in the following section.

The Role of Modulation

Modulation refers to the technique of encoding data onto an optical carrier signal, which is then transmitted over an optical link. Modulation allows multiple bits to be transmitted within a single symbol, which can increase the data rate and improve the spectral efficiency of optical links.

However, different modulation schemes have different levels of sensitivity to noise and other interferences, which can affect the BER. For example, amplitude modulation (AM) and frequency modulation (FM) are more susceptible to noise, while phase modulation (PM) and quadrature amplitude modulation (QAM) are more robust against noise.

Therefore, the choice of modulation scheme can significantly impact the BER, as some schemes may perform better than others at a given data rate.

BER vs. Data Rate

As we have seen, data rate and modulation can both affect the BER of optical links. However, the question remains: which factor has a more significant impact on BER? The answer is not straightforward, as both factors interact in complex ways and depend on the specific design and configuration of the optical link.

Generally speaking, higher data rates tend to lead to higher BER, as more bits are transmitted per second, increasing the likelihood of errors. However, this relationship is not linear, as other factors such as the quality of the transmitter and receiver, the signal-to-noise ratio, and the modulation scheme can all influence the BER. In some cases, increasing the data rate can improve the BER by allowing the use of more robust modulation schemes or improving the receiver’s sensitivity.

Moreover, different types of data may have different BER requirements, depending on their importance and the desired level of accuracy. For example, video data may be more tolerant of errors than financial data, which requires high accuracy and reliability.

BER vs. Modulation

Modulation is another critical factor that affects the BER of optical links. As we mentioned earlier, different modulation schemes have different levels of sensitivity to noise and other interferences, which can impact the BER. For example, QAM can achieve higher data rates than AM or FM, but it is also more susceptible to noise and distortion.

Therefore, the choice of modulation scheme should take into account the desired data rate, the noise level, and the quality of the transmitter and receiver. In some cases, a higher data rate may not be achievable or necessary, and a more robust modulation scheme may be preferred to improve the BER.

Real-World Examples

To illustrate the impact of data rate and modulation on BER, let’s consider two real-world examples.

In the first example, a telecom company wants to transmit high-quality video data over a long-distance optical link. The desired data rate is 1 Gbps, and the BER requirement is 10^-9. The company can choose between two modulation schemes: QAM and amplitude-shift keying (ASK).

QAM can achieve a higher data rate of 1 Gbps, but it is also more sensitive to noise and distortion, which can increase the BER. ASK, on the other hand, has a lower data rate of 500 Mbps but is more robust against noise and can achieve a lower BER. Therefore, depending on the noise level and the quality of the transmitter and receiver, the telecom company may choose ASK over QAM to meet its BER requirement.

In the second example, a financial institution wants to transmit sensitive financial data over a short-distance optical link. The desired data rate is 10 Mbps, and the BER requirement is 10^-12. The institution can choose between two data rates: 10 Mbps and 100 Mbps, both using PM modulation.

Although the higher data rate of 100 Mbps can achieve faster transmission, it may not be necessary for financial data, which requires high accuracy and reliability. Therefore, the institution may choose the lower data rate of 10 Mbps, which can achieve a lower BER and meet its accuracy requirements.

Conclusion

In conclusion, BER is a crucial metric in optical communication, and its value heavily depends on various factors, including data rate and modulation. Higher data rates tend to lead to higher BER, but other factors such as modulation schemes, noise level, and the quality of the transmitter and receiver can also influence the BER. Therefore, the choice of data rate and modulation should take into account the specific design and requirements of the optical link, as well as the type and importance of the transmitted data.

FAQs

  1. What is BER in optical communication?

BER stands for Bit Error Rate, which measures the probability of errors in digital data transmission over optical links.

  1. What factors affect the BER in optical communication?

Various factors can affect the BER in optical communication, including data rate, modulation, the quality of the transmitter and receiver, the signal-to-noise ratio, and the type and importance of the transmitted data.

  1. Does a higher data rate always lead to a higher BER in optical communication?

Not necessarily. Although higher data rates generally lead to a higher BER, other factors such as modulation schemes, noise level, and the quality of the transmitter and receiver can also influence the BER.

  1. What is the role of modulation in optical communication?

Modulation allows data to be encoded onto an optical carrier signal, which is then transmitted over an optical link. Different modulation schemes have different levels of sensitivity to noise and other interferences, which can impact the BER.

  1. How do real-world examples illustrate the impact of data rate and modulation on BER?

Real-world examples can demonstrate the interaction and trade-offs between data rate and modulation in achieving the desired BER and accuracy requirements for different types of data and applications. By considering specific scenarios and constraints, we can make informed decisions about the optimal data rate and modulation scheme for a given optical link.

The Bit Error Rate (BER) of a digital optical receiver indicates the probability of an incorrect bit identification. In other words, the BER is the ratio of bits received in error to the total number of bits received. Below lists different values for BER and their corresponding errors per bits and over time.
As we know that, the photocurrent is converted to a voltage then measured. The measurement procedure involves a decision as to whether the bit received is a 1 or a 0. The BER is a not only a function of the noise in the receiver and distortion in the system, but also on the decision level voltage,VD that is the threshold level above which the signal is classified as a 1 and below which the signal is classified as a 0. Even an ideal signal with no noise nor distortions has a non-zero BER if the decision level is set too high or too low. For example, if VD is set above the voltage of the 1 bit, the BER is 0.5, assuming equal probability of receiving a one and a zero.


BER

Error per 10E-15 bits

@ 10Gbps, One error in

1×10⁻⁶

10,00,00,000

0.1 msec

1×10⁻⁹

1,00,000

0.1 sec

1×10-12

100

1.7 min

1×10-15

1

1.2 days

Mathematically, the Bit Error Rate is expressed as

BER = p(1)P(0 ⁄ 1) + p(0)P(1 ⁄ 0)

where p(1) and p(0) are the probabilities of receiving a 1 and a 0, respectively. P(0/1) is the probability of deciding a 0 when the bit is actually a 1, and P(1/0) is the probability of deciding a 1 when the bit is a 0.

The mathematical relations to BER for non-FEC operation when the threshold is set to the optimum value are:

where:

A commonly used approximation for this function is:­­­

An alternative expression that gives accurate answers over the whole range of Q is expressed as:


Minimum BER as a function of Q  where both formulas are compared.

BER to Q relation


e.g:  BER of 10–12, is Q » 7.03.

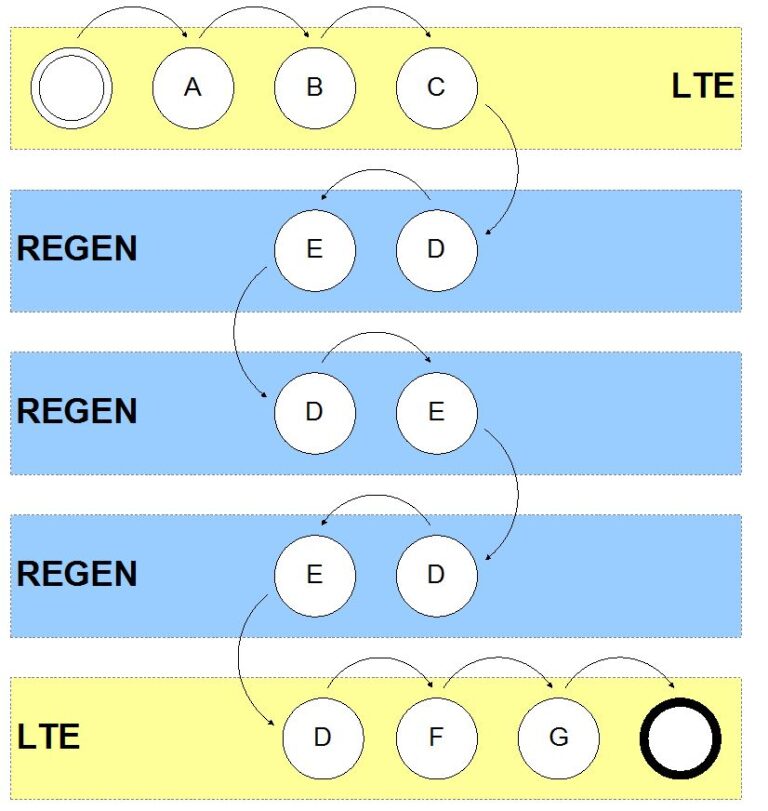
The first thing to note is that for each frame there are two sets of 20 parity bits. One set is associated with the end to end post FEC BER. The other is used to measure the span by span raw BER. The points at which these parity bits are terminated are illustrated below.

postfec


Processing point

Process description

A

Calculate and insert the post FEC parity bits (those over which FEC is calculated) over the frame up to and including the MS OH.

B

Encode FEC over the frame up to and including the MS OH.

C

Calculate and insert the pre FEC parity bits (those over which FEC is not calculated) over the frame up to and including the RS OH.

D

Terminate the raw BER based on the pre FEC parity bits.

E

Re-calculate the pre FEC parity bits over the frame up to, and including, the RS OH.

F

Decode FEC to produce the final data.

G

Terminate the post FEC BER based on the post FEC parity bits.


We can use the raw BER extracted at each RS terminating point (regens and LTEs) to estimate the post FEC BER. Note that this estimate is based on an assumption of a Poisson distribution of errors. In contrast the real post FEC BER can only be extracted at the MS terminating equipment (LTEs), and this is used to feed into the PM error counts.

Following are the terminologies you will come across when referring FEC Performance parameters:

PRE-FEC BER are the bit errors caused by attenuation, ageing, temperature changes of the optical fiber. PRE-FEC indicates that the signal on the optical fiber is FEC
encoded. The FEC decoder will recover the original signal, but depending on the PRE_FEC BER it will succeed to recover the original signal completely without errors.
Or, if the BER on the fiber is too high, the recovered signal will  contain bit errors.

If the signal was FEC encoded the remaining bit errors after the decoder are called POST_FEC BER. 

The NO_FEC BER are the bit errors detected when no FEC coding is used on the optical fiber.

Uncorrected words are the word that FEC is not able to corrects.It shows that the current FEC is not able to correct anymore and we need to look for more advance FEC.

Bit error rate, BER is a key parameter that is used in assessing systems that transmit digital data from one location to another.

BER can be affected by a number of factors. By manipulating the variables that can be controlled it is possible to optimise a system to provide the performance levels that are required. This is normally undertaken in the design stages of a data transmission system so that the performance parameters can be adjusted at the initial design concept stages.

  • Interference:   The interference levels present in a system are generally set by external factors and cannot be changed by the system design. However it is possible to set the bandwidth of the system. By reducing the bandwidth the level of interference can be reduced. However reducing the bandwidth limits the data throughput that can be achieved.
  • Increase transmitter power:   It is also possible to increase the power level of the system so that the power per bit is increased. This has to be balanced against factors including the interference levels to other users and the impact of increasing the power output on the size of the power amplifier and overall power consumption and battery life, etc.
  • Lower order modulation:   Lower order modulation schemes can be used, but this is at the expense of data throughput.
  • Reduce bandwidth:   Another approach that can be adopted to reduce the bit error rate is to reduce the bandwidth. Lower levels of noise will be received and therefore the signal to noise ratio will improve. Again this results in a reduction of the data throughput attainable.

It is necessary to balance all the available factors to achieve a satisfactory bit error rate. Normally it is not possible to achieve all the requirements and some trade-offs are required. However, even with a bit error rate below what is ideally required, further trade-offs can be made in terms of the levels of error correction that are introduced into the data being transmitted. Although more redundant data has to be sent with higher levels of error correction, this can help mask the effects of any bit errors that occur, thereby improving the overall bit error rate.

“In analog world the standard test message is the sine wave, followed by the two-­tone signal  for more rigorous tests.  The property being optimized is generally  signal-to-noise ratio (SNR). Speech  is  interesting, but does not lend itself easily to mathematical analysis, or measurement. 

ln digital world a binary sequence, with a known pattern of ‘ 1’ and ‘0’ ,  i s common .   It i s more common  to measure Bit error  rates (BER) than  SNR, and this is simplified by the fact that  known binary sequences are easy to generate and reproduce. A common sequence is the pseudo random  binary sequence.”

**********************************************************************************************************************************************************

“A PRBS (Pseudo Random Binary Sequence) is a binary PN (Pseudo-Noise) signal. The sequence of binary 1’s and 0’s exhibits certain randomness and auto-correlation properties.Bit-sequences like PRBS are used for testing transmission lines and transmission equipment because of their randomness properties.Simple bit-sequences are used to test the DC compatibility of transmission lines and transmission equipment.”

**********************************************************************************************************************************************************

 Pseudo-Random-Bit-Sequence (PRBS) is used to simulate random data for transmission across the link.The different types of PRBS and the suggested data-rates for the different PRBS types are described in the ITU-T standards O.150, O.151, O.152 and O.153.In order to properly simulate real traffic, a pseudo-random bit sequence (PRBS) is also used. The rate of the PRBS can range between 2^-9 and 2^-31. Typically, for higher-bit-rate devices, a high-rate PBRS pattern is preferable so that the device under test is effectively stressed

**********************************************************************************************************************************************************

 Bit-error measurements are an important means of assessing the performance of digital transmission. It is necessary to specify reproducible test sequences that simulate real traffic as closely as possible. Reproducible test sequences are also a prerequisite to perform end-to-end measurement.  Pseudo-random bit sequences (PRBS) with lengths of 2n – 1 bits are the most common solution to this problem.

PRBS bit-pattern are generated in a linear feed-back shift-register. This is a shift-register with a xored– feedback of the output-values of specific flip-flops to the input of the first flip-flop.2*X (X = PRBS shift register length). 

Example : PRBS-Generation of the sequence 2^9  -1 :


PRBS_TYPE   


ERROR TYPE   


Note:(PRBS) of order 31 (PRBS31), which is the inverted bit stream.

G(x) = 1 + x28 + x31 (1)

The advantage of using a PRBS pattern for BER testing is that it is a deterministic signal with properties similar to those of a random signal for the link , i. e. of white noise.

Bit error counting

Whereas a mask of the bit errors in the stream can be created by ANDing the received bytes after coalescing them with the locally generated PRBS31 pattern, counting the number of bits set in this mask in order to calculate the BER is a bit tricky. So we need to follow this


Typical links are designed for BERs better than 10-12

The Bit Error Ratio (BER) is often specified as a performance parameter of a transmission system, which needs to be verified during investigation. Designing an experiment to demonstrate adequate BER performance is not, however, as straightforward as it appears since the number of errors detected over a practical measurement time is generally small. It is, therefore, not sufficient to quote the BER as simply the ratio of the number of errors divided by the number of bits transmitted during the measurement period, instead some knowledge of the statistical nature of the error distribution must first be assumed.

The bit error rate (BER) is the most significant performance parameter of any digital communications system. It is a measure of the probability that any given bit will have been received in error. For example a standard maximum bit error rate specified for many systems is 10-9. This means that the receiver is allowed to generate a maximum of 1 error in every 109 bits of information transmitted or, putting it another way, the probability that any received bit is in error is 10-9.

 The BER depends primarily on the signal to noise ratio (SNR) of the received signal which in turn is determined by the transmitted signal power, the attenuation of the link, the link dispersion and the receiver noise. The S/N ratio is generally quoted for analog links while the bit-error-rate (BER) is used for digital links. BER is practically an inverse function of S/N. There must be a minimum power at the receiver to provide an acceptable S/N or BER. As the power increases, the BER or S/N improves until the signal becomes so high it overloads the receiver and receiver performance degrades rapidly.

 The formula used to calculate residual BER assumes a gaussian error distribution:

C = 1 – e–nb

C = Degree of confidence required

(0.95 = 95% confidence)

n = No. of bits examined with no error found.

b = Upper bound on BER with a confidence C

(b = 10–15)

To determine the length of time, that is, the number of bits needed to test for (at a given bit rate), requires the above equation to be transposed:

n = loge(1 – C)/b


So, to test for a residual BER of 10–13 with a 95% confidence limit requires a test pattern equal to 3 x 1013 bits. This equates to only 0.72 hours using an OC-192c/STM-64c payload rather than 55.6 hours using an STS-3c/VC-4 bulk filled payload (149.76 Mb/s).The graph in Figure plots test time versus residual BER and shows the difference in test time for OC-192c/STM-64c payloads versus an OC-48c/STM-16c payload.The graphs are plotted for different confidence limits and they clearly indicate that the payload capacity is the dominant factor in improving the test time and not the confidence limit. Table 1 shows the exact test times for each BER threshold and confidence limit.


collected from::Product Note-OmniBER

FEC codes in optical communications are based on a class of codes know as Reed-Solomon.

Reed-Solomon code is specified as  RS (nk), which means that the encoder takes k data bytes and adds parity bytes to make an n bytes codeword. A Reed-Solomon decoder can correct up to t bytes in the codeword, where 2t=n – k.


ITU recommendation G.975 proposes a Reed-Solomon (255, 239). In this case 16 extra bytes are appended to 239 information-bearing bytes. The bit rate increase is about 7% [(255-239)/239 = 0.066], the code can correct up to 8 byte errors [255-239/2 =8] and the coding gain can be demonstrated to be about 6dB.

The same Reed-Solomon coding (RS (255,239)) is recommended in ITU-T G.709. The coding overhead is again about 7% for a 6dB coding gain. Both G.975 and G.709 improve the efficiency of the Reed-Solomon by interleaving data from different codewords. The interleaving technique carries an advantage for burst errors, because the errors can be shared across many different codewords. In the interleaving approach lies the main difference between G.709 and G.975: G.709 interleave approach is fully standardized,while G.975 is not.

The actual G.975 data overhead includes also one bit for framing overhead, therefore the bit rate exp ansion is [(255-238)/238 = 0.071]. In G.709 the frame overhead is higher than in G.975, hence an even higher bit rate expansion. One byte error occurs when 1 bit in a byte is wrong or when all the bits in a byte are wrong. Example: RS (255,239) can correct 8 byte errors. In the worst case, 8 bit errors may occur, each in a separate byte so that the decoder corrects 8 bit errors. In the best case, 8 complete byte errors occur so that the decoder corrects 8 x 8 bit errors.

There are other, more powerful and complex RS variants (like for example concatenating two RS codes) capable of Coding Gain 2 or 3 dB higher than the ITU-T FEC codes, but at the expense of an increased bit rate (sometimes as much as 25%).

FOR OTN FRAME: Calculation of RS( n,k) is as follows:-

*OPU1 payload rate= 2.488 Gbps (OC48/STM16)


*Add OPU1 and ODU1 16 bytes overhead:


3808/16 = 238, (3808+16)/16 = 239

ODU1 rate: 2.488 x 239/238** ~ 2.499Gbps

*Add FEC

OTU1 rate: ODU1 x 255/239 = 2.488 x 239/238 x 255/239

=2.488 x 255/238 ~2.667Gbps


NOTE:4080/16=(255)

**Multiplicative factor is just a simple math :eg. for ODU1/OPU1=3824/3808={(239*16)/(238*16)}

Here value of multiplication factor will give the number of times  for rise in the frame size after adding header/overhead.

As we are using Reed Soloman(255,239) i.e we are dividing 4080bytes in sixteen frames (The forward error correction for the OTU-k uses 16-byte interleaved codecs using a Reed- Solomon S(255,239) code. The RS(255,239) code operates on byte symbols.).

Hence 4080/16=255…I have understood it you need to do simpler maths to understand..)