Signal integrity is the cornerstone of effective fiber optic communication. In this sphere, two metrics stand paramount: Bit Error Ratio (BER) and Q factor. These indicators help engineers assess the performance of optical networks and ensure the fidelity of data transmission. But what do these terms mean, and how are they calculated?
What is BER?
BER represents the fraction of bits that have errors relative to the total number of bits sent in a transmission. It’s a direct indicator of the health of a communication link. The lower the BER, the more accurate and reliable the system.
ITU-T Standards Define BER Objectives
The ITU-T has set forth recommendations such as G.691, G.692, and G.959.1, which outline design objectives for optical systems, aiming for a BER no worse than 10−12 at the end of a system’s life. This is a rigorous standard that guarantees high reliability, crucial for SDH and OTN applications.
Measuring BER
Measuring BER, especially as low as 10−12, can be daunting due to the sheer volume of bits required to be tested. For instance, to confirm with 95% confidence that a system meets a BER of 10−12, one would need to test 3×1012 bits without encountering an error — a process that could take a prohibitively long time at lower transmission rates.
The Q Factor
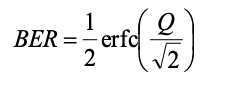
The Q factor measures the signal-to-noise ratio at the decision point in a receiver’s circuitry. A higher Q factor translates to better signal quality. For a BER of 10−12, a Q factor of approximately 7.03 is needed. The relationship between Q factor and BER, when the threshold is optimally set, is given by the following equations:
The general formula relating Q to BER is:
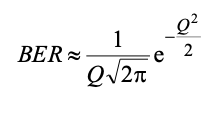
A common approximation for high Q values is:
For a more accurate calculation across the entire range of Q, the formula is:
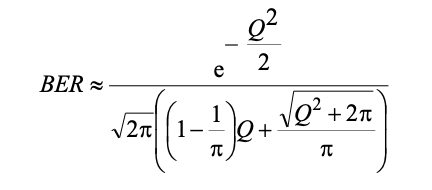
Practical Example: Calculating BER from Q Factor
Let’s consider a practical example. If a system’s Q factor is measured at 7, what would be the approximate BER?
Using the approximation formula, we plug in the Q factor:
This would give us an approximate BER that’s indicative of a highly reliable system. For exact calculations, one would integrate the Gaussian error function as described in the more detailed equations.
Graphical Representation
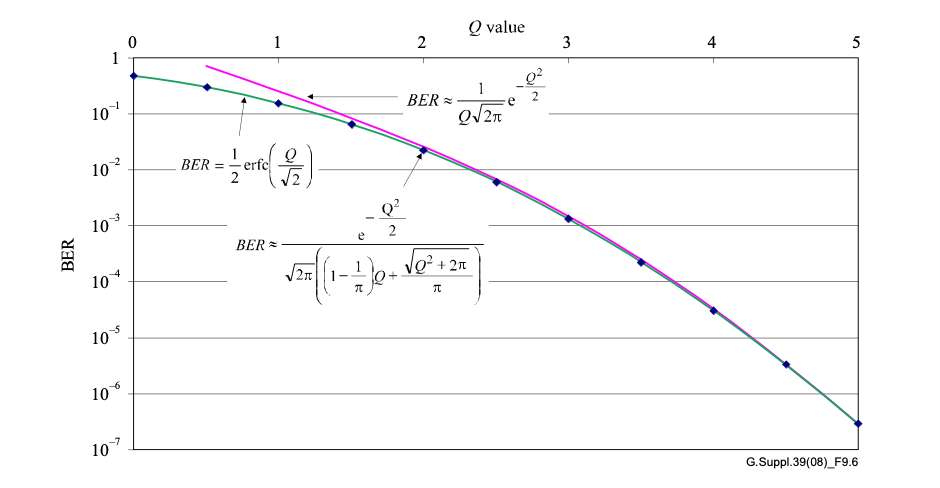
The graph typically illustrates these relationships, providing a visual representation of how the BER changes as the Q factor increases. This allows engineers to quickly assess the signal quality without long, drawn-out error measurements.
Concluding Thoughts
Understanding and applying BER and Q factor calculations is crucial for designing and maintaining robust optical communication systems. These concepts are not just academic; they directly impact the efficiency and reliability of the networks that underpin our modern digital world.
References
https://www.itu.int/rec/T-REC-G/e