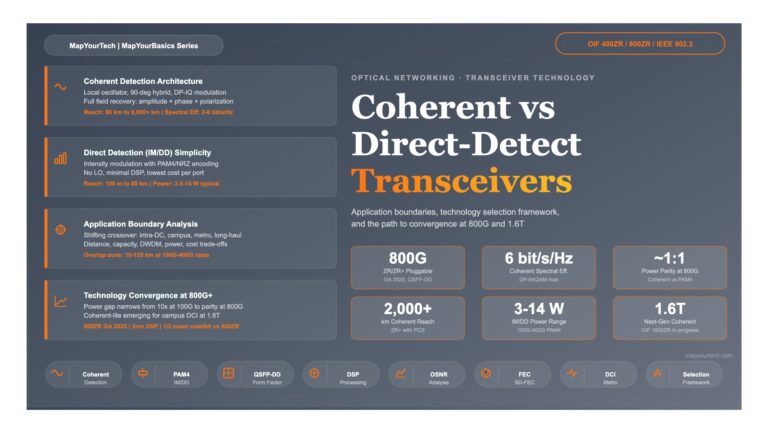
Coherent vs Direct-Detect Transceivers: Application Boundaries and Technology Selection Coherent vs Direct-Detect Transceivers: Application Boundaries and Technology Selection A comprehensive...
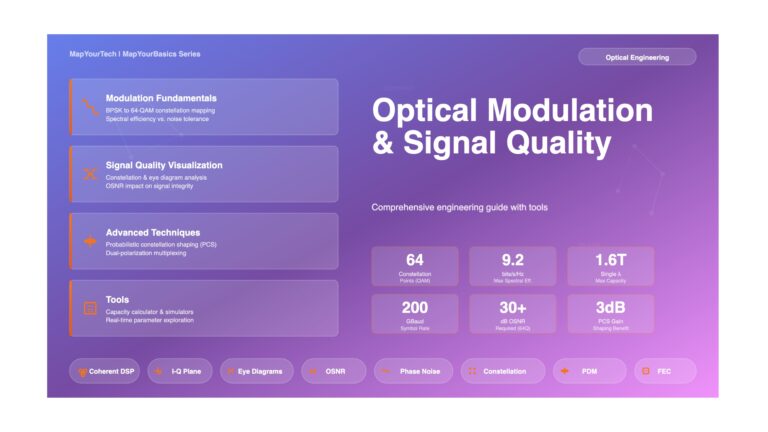
Optical Modulation and Constellation Diagrams: A Comprehensive Engineering Guide Optical Modulation and Constellation Diagrams: A Comprehensive Engineering Guide Understanding the...