Tag

SDH

Browsing

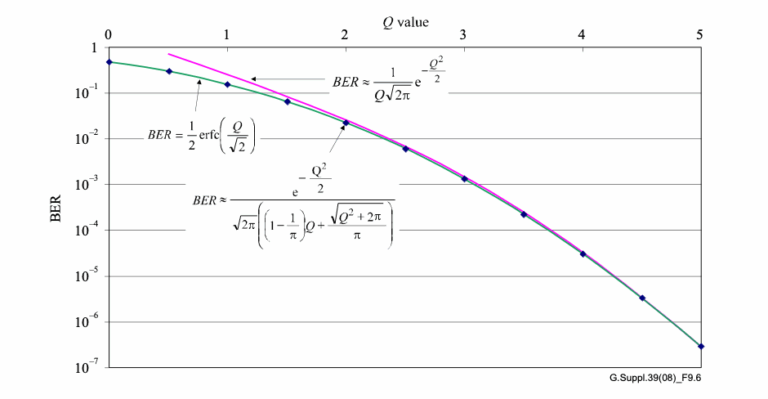
Signal integrity is the cornerstone of effective fiber optic communication. In this sphere, two metrics stand paramount: Bit Error Ratio (BER) and Q factor. These indicators help engineers assess the performance of optical networks and ensure the fidelity of data transmission. But what do these terms mean, and how are they calculated?

What is BER?

BER represents the fraction of bits that have errors relative to the total number of bits sent in a transmission. It’s a direct indicator of the health of a communication link. The lower the BER, the more accurate and reliable the system.

ITU-T Standards Define BER Objectives

The ITU-T has set forth recommendations such as G.691, G.692, and G.959.1, which outline design objectives for optical systems, aiming for a BER no worse than 10−12 at the end of a system’s life. This is a rigorous standard that guarantees high reliability, crucial for SDH and OTN applications.

Measuring BER

Measuring BER, especially as low as 10−12, can be daunting due to the sheer volume of bits required to be tested. For instance, to confirm with 95% confidence that a system meets a BER of 10−12, one would need to test 3×1012 bits without encountering an error — a process that could take a prohibitively long time at lower transmission rates.

The Q Factor

The Q factor measures the signal-to-noise ratio at the decision point in a receiver’s circuitry. A higher Q factor translates to better signal quality. For a BER of 10−12, a Q factor of approximately 7.03 is needed. The relationship between Q factor and BER, when the threshold is optimally set, is given by the following equations:

The general formula relating Q to BER is:

bertoq

A common approximation for high Q values is:

ber_t_q_2

For a more accurate calculation across the entire range of Q, the formula is:

ber_t_q_3

Practical Example: Calculating BER from Q Factor

Let’s consider a practical example. If a system’s Q factor is measured at 7, what would be the approximate BER?

Using the approximation formula, we plug in the Q factor:

This would give us an approximate BER that’s indicative of a highly reliable system. For exact calculations, one would integrate the Gaussian error function as described in the more detailed equations.

Graphical Representation

ber_t_q_4

The graph typically illustrates these relationships, providing a visual representation of how the BER changes as the Q factor increases. This allows engineers to quickly assess the signal quality without long, drawn-out error measurements.

Concluding Thoughts

Understanding and applying BER and Q factor calculations is crucial for designing and maintaining robust optical communication systems. These concepts are not just academic; they directly impact the efficiency and reliability of the networks that underpin our modern digital world.

References

https://www.itu.int/rec/T-REC-G/e

Actually  SPE(synchronous payload envelope)  can start anywhere within the SONET payload, which necessitates the need for a pointer to point to the beginning of the SPE.

Lets consider that  the SPE begins on byte 276 (fourth row, sixth column) of frame i, and ends at byte 275 (fourth row, fifth column) of the next frame + 1. The next SPE starts immediately, on byte 276 of frame + 1, and so on. In general, SONET assumes that the SPE can be floated within the payload of the frame, and it provides a pointer in the overhead section for locating its beginning.

As we know that  the beginning location of frame is given by H1H2 value and also that H1+H2 indicates the offset (in bytes) from H3 to the SPE (i.e. if 0 then J1 POH byte is immediately after H3 in the row). Similarly end can be found because each SPE has a fixed number of bytes.

In H1+H2, 4 MSBs are New Data Flag, 10 LSBs are actual offset value (0 – 782).

So, When offset=522 the STS-1 SPE is in a single STS-1 frame. And In all other cases the SPE straddles two frames When offset is a multiple of 87, the SPE is rectangular. This all happens with ideal synchronization conditions else H3 byte take cares further.
Some fixed start and end locations for various payloads are:-
Pointer Range: 0-103 (VT1.5 type)
Pointer Range: 0-139 (VT2 type)
Pointer Range: 0-211 (VT3 type)
Pointer Range: 0-427 (VT6 type)
Pointer Range: 0-782 (SPE,STS-1 type)
Pointer Range: 0-2339 (STS-3c type)

If SDH is based on node and signal synchronization, why do fluctuations occur?Very general question for a Optics beginner.

The answer lies in the practical limitations of synchronization. SDH networks use high-quality clocks feeding network el- ements. However, we must consider the following:

  • A number of SDH islands use their own reference clocks, which may be nominally identical, but never exactly the same.
  • Cross services carried by two or more operators always generate offset and clock fluctuations whenever a common reference clock is not used.
  • Inside an SDH network, different types of breakdown may occur and cause a temporary loss of synchronization. When a node switches over to a secondary clock reference, it may be different from the original, and it could even be the internal clock of the node.
  • Jitter and wander effects

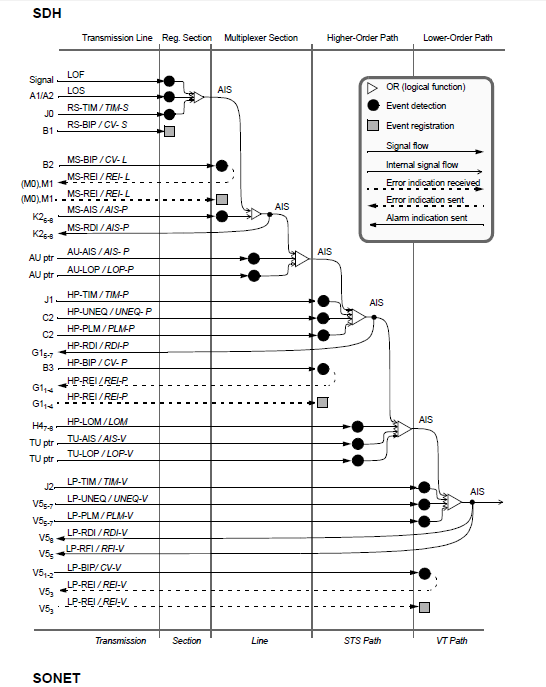
SDH/SONET:Maintenance and Performance Events

We know SDH/SONET is older technology now but just have a glimpse for the revision of basic FM process:

SDH SONET MAINTENANCE

SDH and SONET transmission systems are robust and reliable; however they are vulnerable to several effects that may cause malfunction. These effects can be clas- sified as follows:

  • Natural causes: This include thermal noise, always present in regeneration systems; solar radiation; humidity and Raleigh fading in radio systems; hardware aging; degraded lasers; degradation of electric connections; and electrostatic discharge.
  • A network design pitfall: Bit errors due to bad synchronization in SDH. Timing loops may collapse a transmission network partially, or even completely.
  • Human intervention: This includes fiber cuts, electrostatic discharges, power failure, and topology modifications.


Anomalies and defects management. (In regular characters for SDH; in italic for SONET.)

All these may produce changes in performance, and eventually collapse transmission services.

SDH/SONET Events

SDH/SONET events are classified as anomalies, defects, damage, failures, and alarms depending on how they affect the service:

  • Anomaly: This is the smallest disagreement that can be observed between mea- sured and expected characteristics. It could for instance be a bit error. If a single anomaly occurs, the service will not be interrupted. Anomalies are used to monitor performance and detect defects.

Defect: A defect level is reached when the density of anomalies is high enough to interrupt a function. Defects are used as input for performance monitoring, to con- trol consequent actions, and to determine fault causes.

  • Damage or fault: This is produced when a function cannot finish a requested action. This situation does not comprise incapacities caused by preventive maintenance.
  • Failure: Here, the fault cause has persisted long enough so that the ability of an item to perform a required function may be terminated. Protection mechanisms can now be activated.
  • Alarm: This is a human-observable indication that draws attention to a failure (detected fault), usually giving an indication of the depth of the damage. For example, a light emitting diode (LED), a siren, or an e-mail.
  • Indication: Here events are notified upstream to the peer layer for performance monitoring and eventually to request an action or a human intervention that can fix the situation .

Errors reflect anomalies, and alarms show defects. Terminology here is often used in a confusing way, in the sense that people may talk about errors but actually refer to anomalies, or use the word, “alarm” to refer to a defect.


OAM management. Signals are sent downstream and upstream when events are detected at the LP edge (1, 2); HP edge (3, 4); MS edge (5, 6); and RS edge (7, 8).

In order to support a single-end operation the defect status and the number of detected bit errors are sent back to the far-end termination by means of indications such an RDI, REI, or RFI

 Monitoring Events

SDH frames contain a lot of overhead information to monitor and manage events  When events are detected, overhead channels are used to notify peer layers to run network protection procedures or evaluate performance. Messages are also sent to higher layers to indicate the local detection of a service affecting fault to the far-end terminations.

Defects trigger a sequence of upstream messages using G1 and V2 bytes. Down- stream AIS signals are sent to indicate service unavailability. When defects are detected, upstream indications are sent to register and troubleshoot causes.

 Event Tables


PERFORMANCE MONITORING

SDH has performance monitoring capabilities based on bit error monitoring. A bit parity is calculated for all bits of the previous frame, and the result is sent as over- head. The far-end element repeats the calculation and compares it with the received


overhead. If the result is equal, there is considered to be no bit error; otherwise, a bit error indication is sent to the peer end.