Animated CTA Banner
MapYourTech
MapYourTech has always been about YOUR tech journey, YOUR questions, YOUR thoughts, and most importantly, YOUR growth. It’s a space where we "Map YOUR Tech" experiences and empower YOUR ambitions.
To further enhance YOUR experience, we are working on delivering a professional, fully customized platform tailored to YOUR needs and expectations.
Thank you for the love and support over the years. It has always motivated us to write more, share practical industry insights, and bring content that empowers and inspires YOU to excel in YOUR career.
We truly believe in our tagline:
“Share, explore, and inspire with the tech inside YOU!”
Let us know what YOU would like to see next! Share YOUR thoughts and help us deliver content that matters most to YOU.
Share YOUR Feedback
Tag

optical signal to noise ratio

Browsing

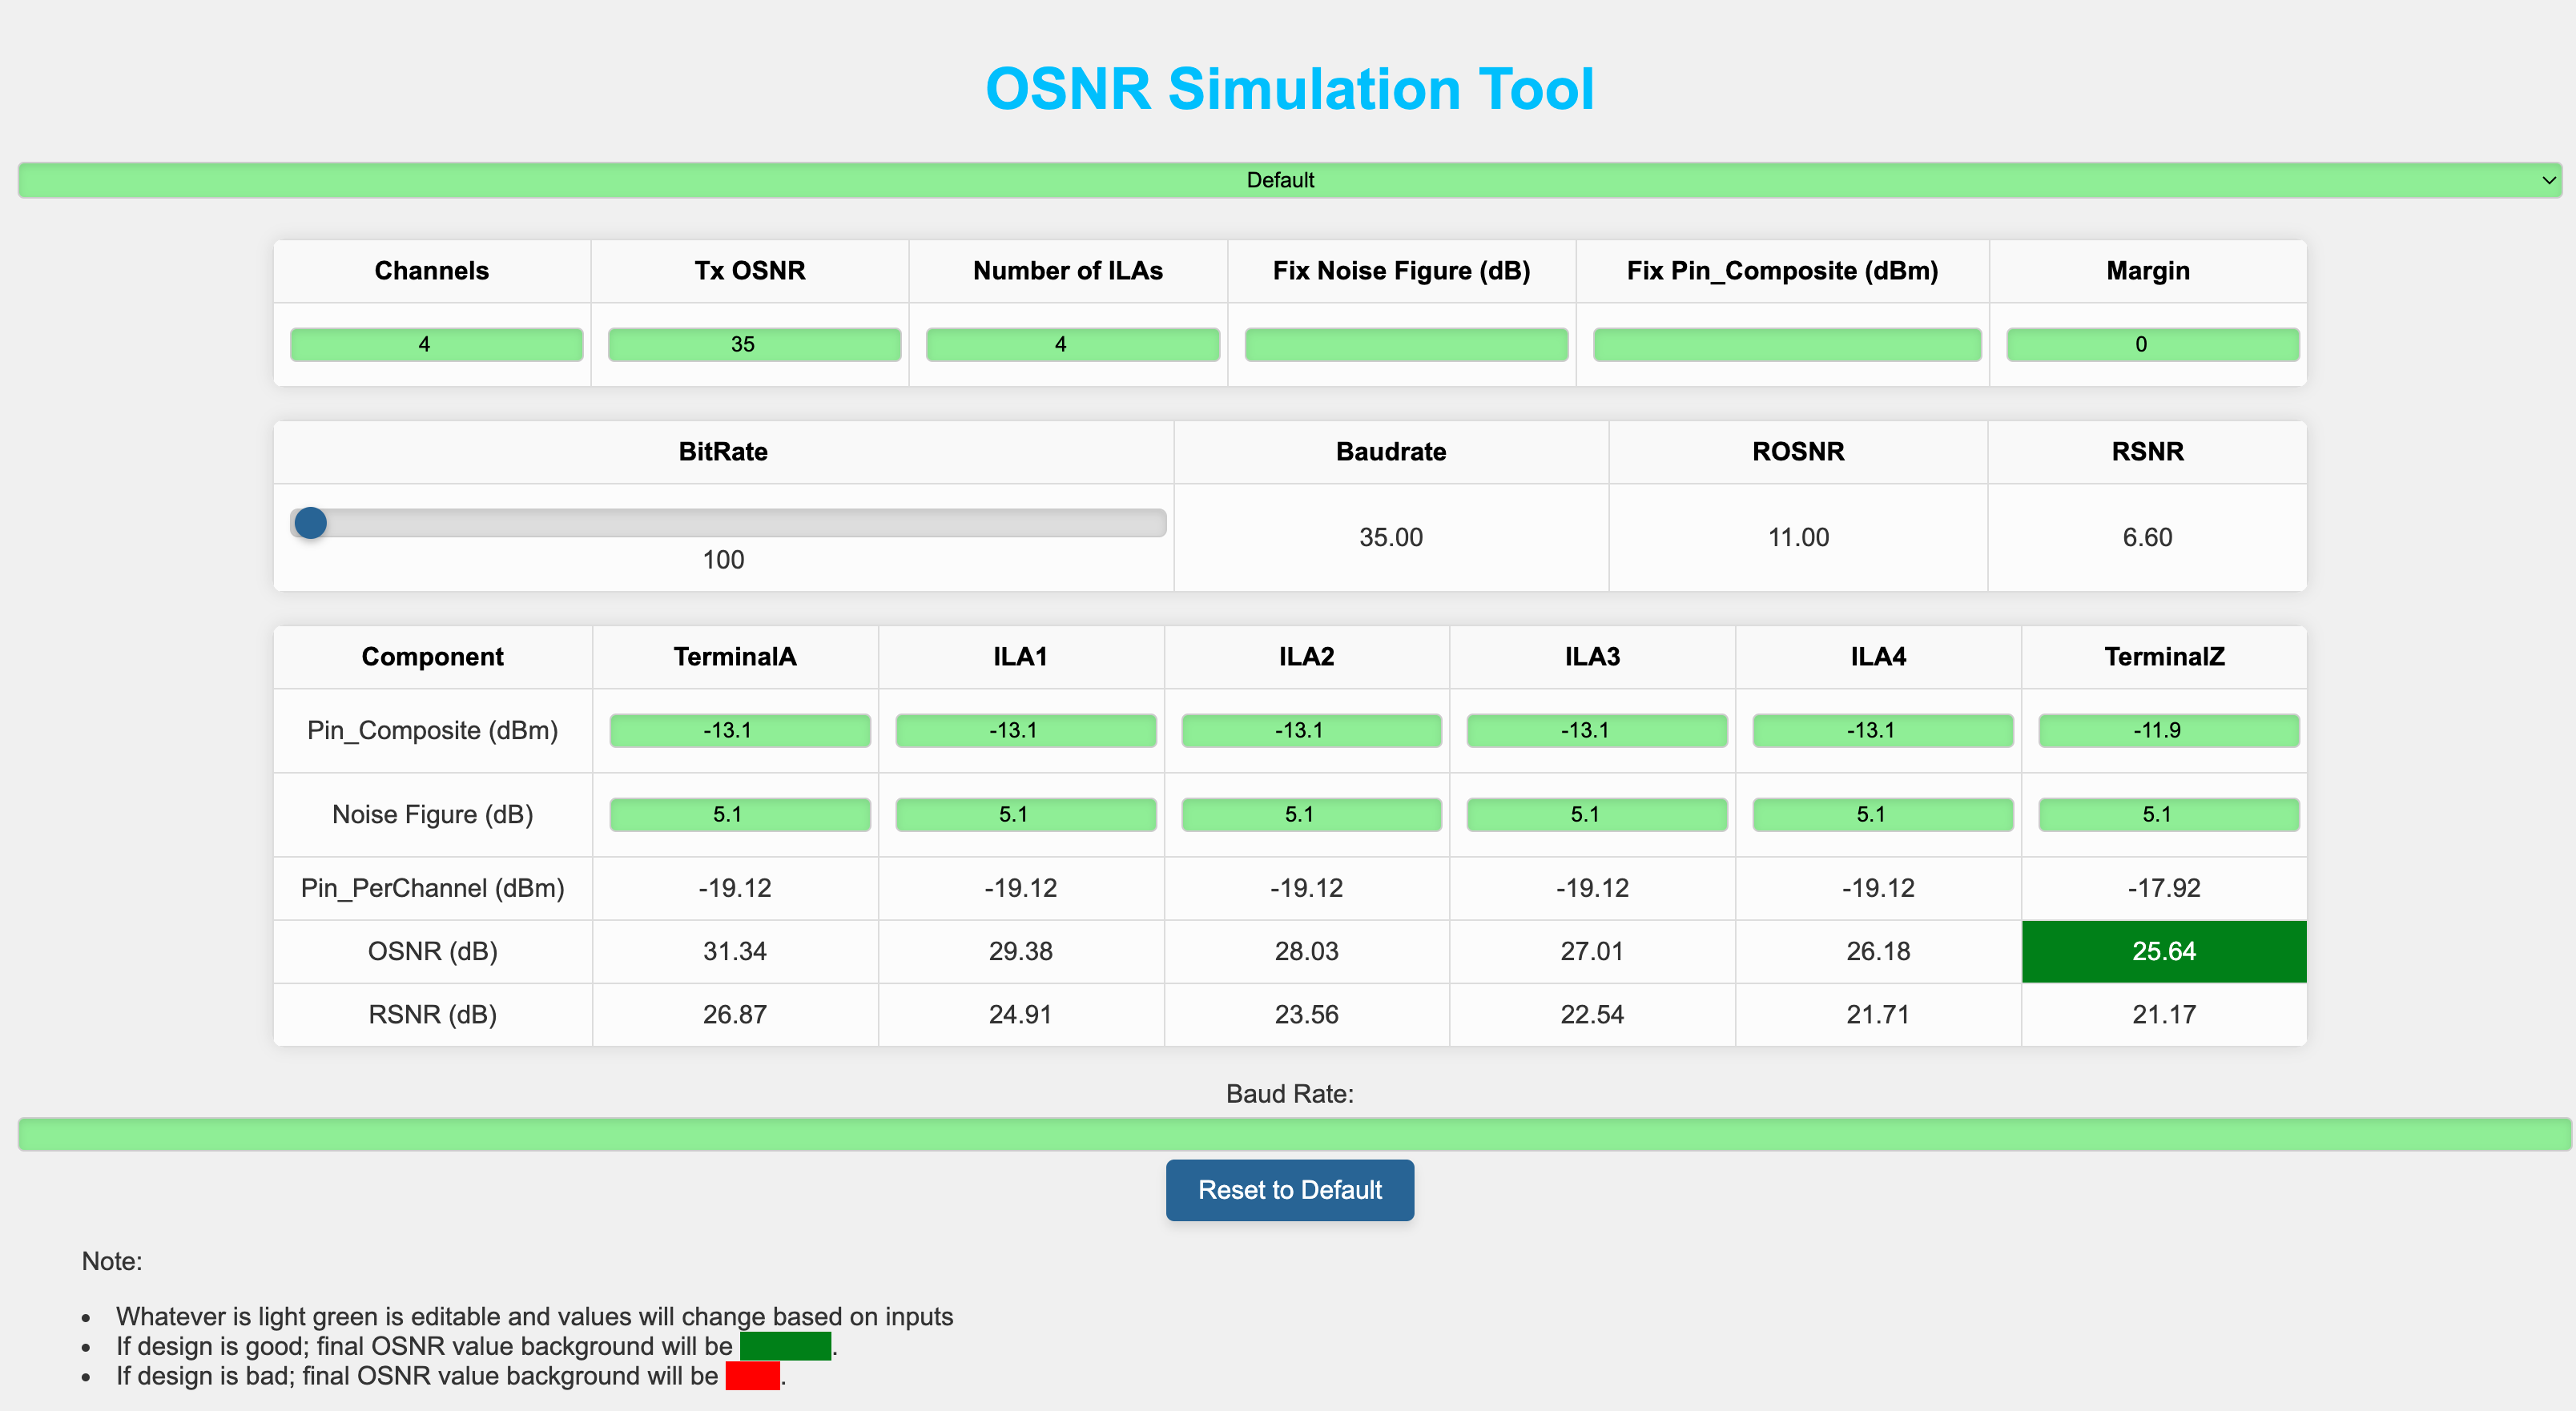
Based on my experience ,I have seen that Optical Engineers need to estimate Optical Signal-to-Noise Ratio (OSNR) often specially when they are dealing with network planning and operations .Mostly engineers use spreadsheet to perform these calculation or use available planning tool .This handy tool provides a method for user to quickly estimate the OSNR for a link and ensures flexibility to simulate by modifying power levels,Tx OSNR, number of channels . In this blog post, I will walk you through the features and functionalities of the tool, helping you understand how to use it effectively for your projects.For simplicity ,we have not considered Non-Linear penaltie which user is requested to add as needed .

What is OSNR?

Optical Signal-to-Noise Ratio (OSNR) is a critical parameter in optical communication systems. It measures the ratio of signal power to the noise power in an optical channel. Higher OSNR values indicate better signal quality and, consequently, better performance of the communication system.

Features of the OSNR Simulation Tool
osnr_simulation_tool
#osnr_simulation_tool


This OSNR Calculation Tool is designed to simplify the process of calculating the OSNR across multiple channels and Intermediate Line Amplifiers (ILAs). Here’s what the tool offers:

  1. Input Fields for Channels, Tx OSNR, and Number of ILAs:

              • Channels: The number of optical channels in the network. Adjust to simulate different network setups.
              • Tx OSNR: The initial OSNR value at the transmitter.
              • Number of ILAs: The number of in-line amplifiers (ILAs) in the network. Adjust to add or remove amplifiers.
              • Set Noise Figure (dB) for all ILAs: Set a common noise figure for all ILAs.
              • Margin: The margin value used for determining if the final OSNR is acceptable.
              • Set Pin_Composite (dBm) for all: Set a common Pin_Composite (dBm) value for all components.
              • BitRate: Controlled via a slider. Adjust the slider to select the desired bit rate.
              • BaudRate: Automatically updated based on the selected bit rate.
              • ROSNR: Automatically updated based on the selected bit rate.
              • RSNR: Automatically updated based on the selected bit rate.
              • Baud Rate: Additional input for manual baud rate entry.
  2. Dynamic ILA Table Generation:

              • The tool generates a table based on the number of ILAs specified. This table includes fields for each component (TerminalA, ILAs, TerminalZ) with editable input fields for Pin_Composite (dBm) and Noise Figure (dB).
  3. Calculations and Outputs:

              • Composite Power: The composite power calculated based on the number of channels and per-channel power.
              • Net Power Change: The net power change when channels are added or removed.
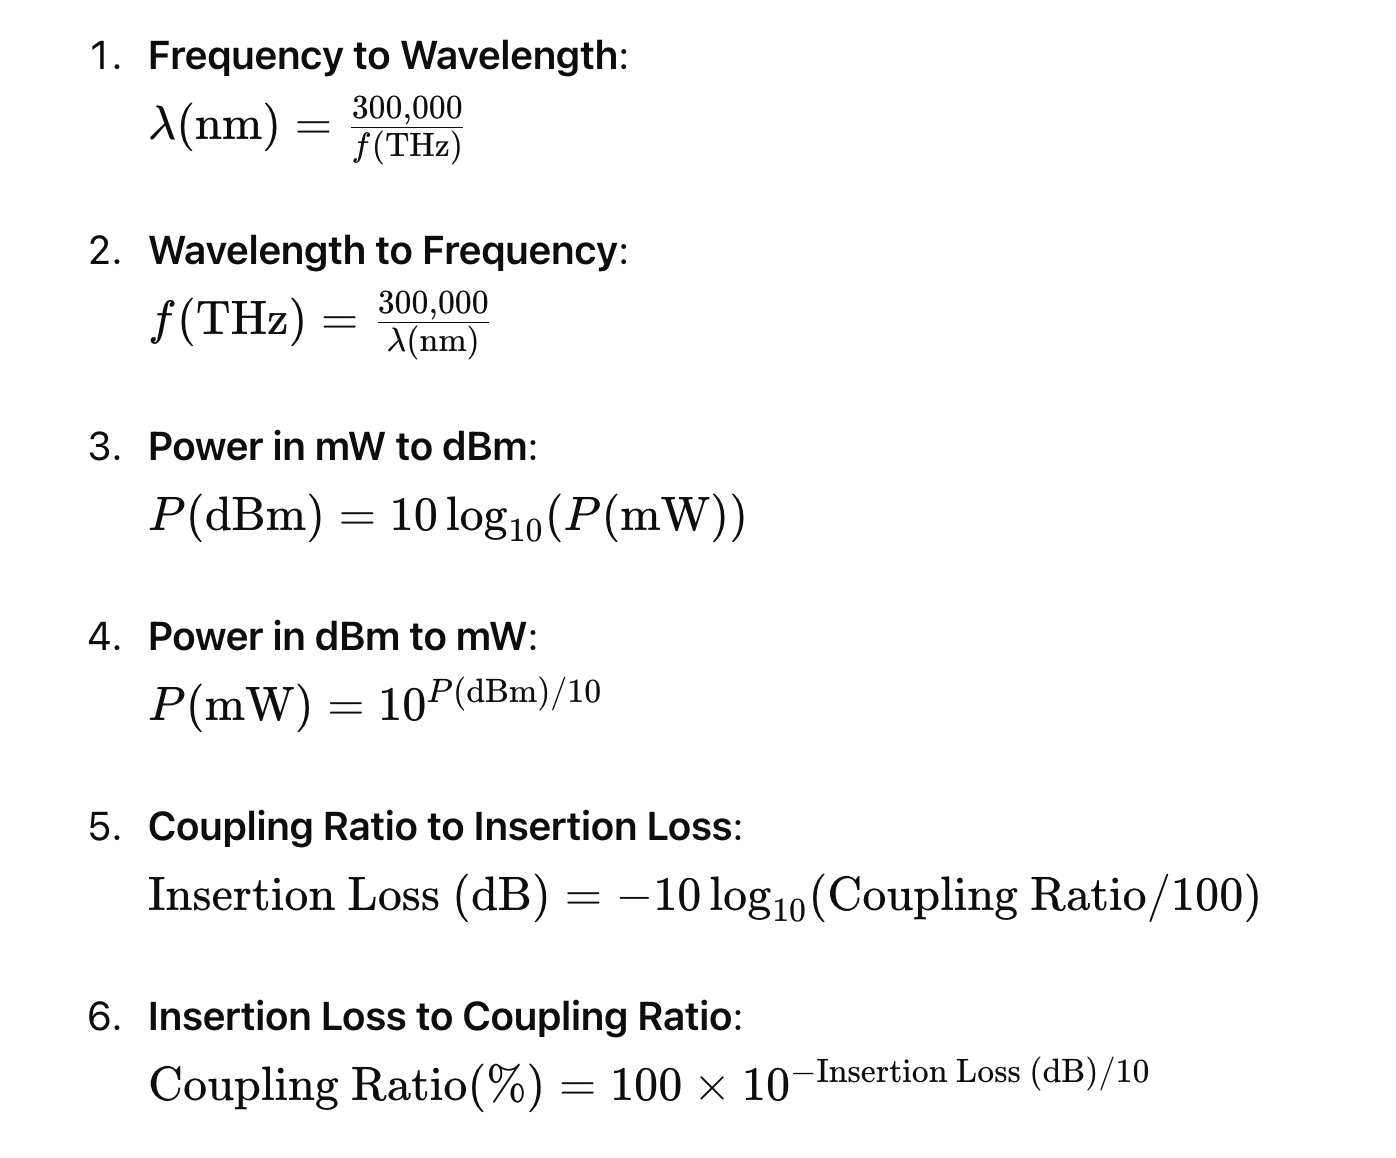
              • Optical Parameter Conversions:
                • Frequency to Wavelength and vice versa.
                • Power in mW to dBm and vice versa.
                • Coupling Ratio to Insertion Loss and vice versa.
              • OSNR (dB): Displays the OSNR value for each component in the network.
              • RSNR (dB): Displays the RSNR value for each component in the network.
  4. Baud Rate and Required SNR Calculation:

              • Input the Baud Rate to calculate the required Signal-to-Noise Ratio (SNR) for your system.SNR is related to Q-factor .
  5. Reset to Default:

              • A button to reset all fields to their default values for a fresh start.

Steps to Use the Tool

  1. Set the Initial Parameters:
            • Enter the number of channels.
            • Enter the Tx OSNR value.
            • Enter the number of ILAs.
            • Optionally, set a common Noise Figure for all ILAs.
            • Enter the margin value.
            • Optionally, set a common Pin_Composite (dBm) for all components.
  2. Adjust Bit Rate:
            • Use the slider to select the desired bit rate. The BaudRate, ROSNR, and RSNR will update automatically.
  3. Calculate:
            • The tool will automatically calculate and display the OSNR and RSNR values for each component.
  4. Review Outputs:
            • Check the Composite Power, Net Power Change, and Optical Parameter Conversions.
            • Review the OSNR and RSNR values.
            • The final OSNR value will be highlighted in green if it meets the design criteria (OSNR >= ROSNR + Margin), otherwise, it will be highlighted in red.
  5. Visualize:
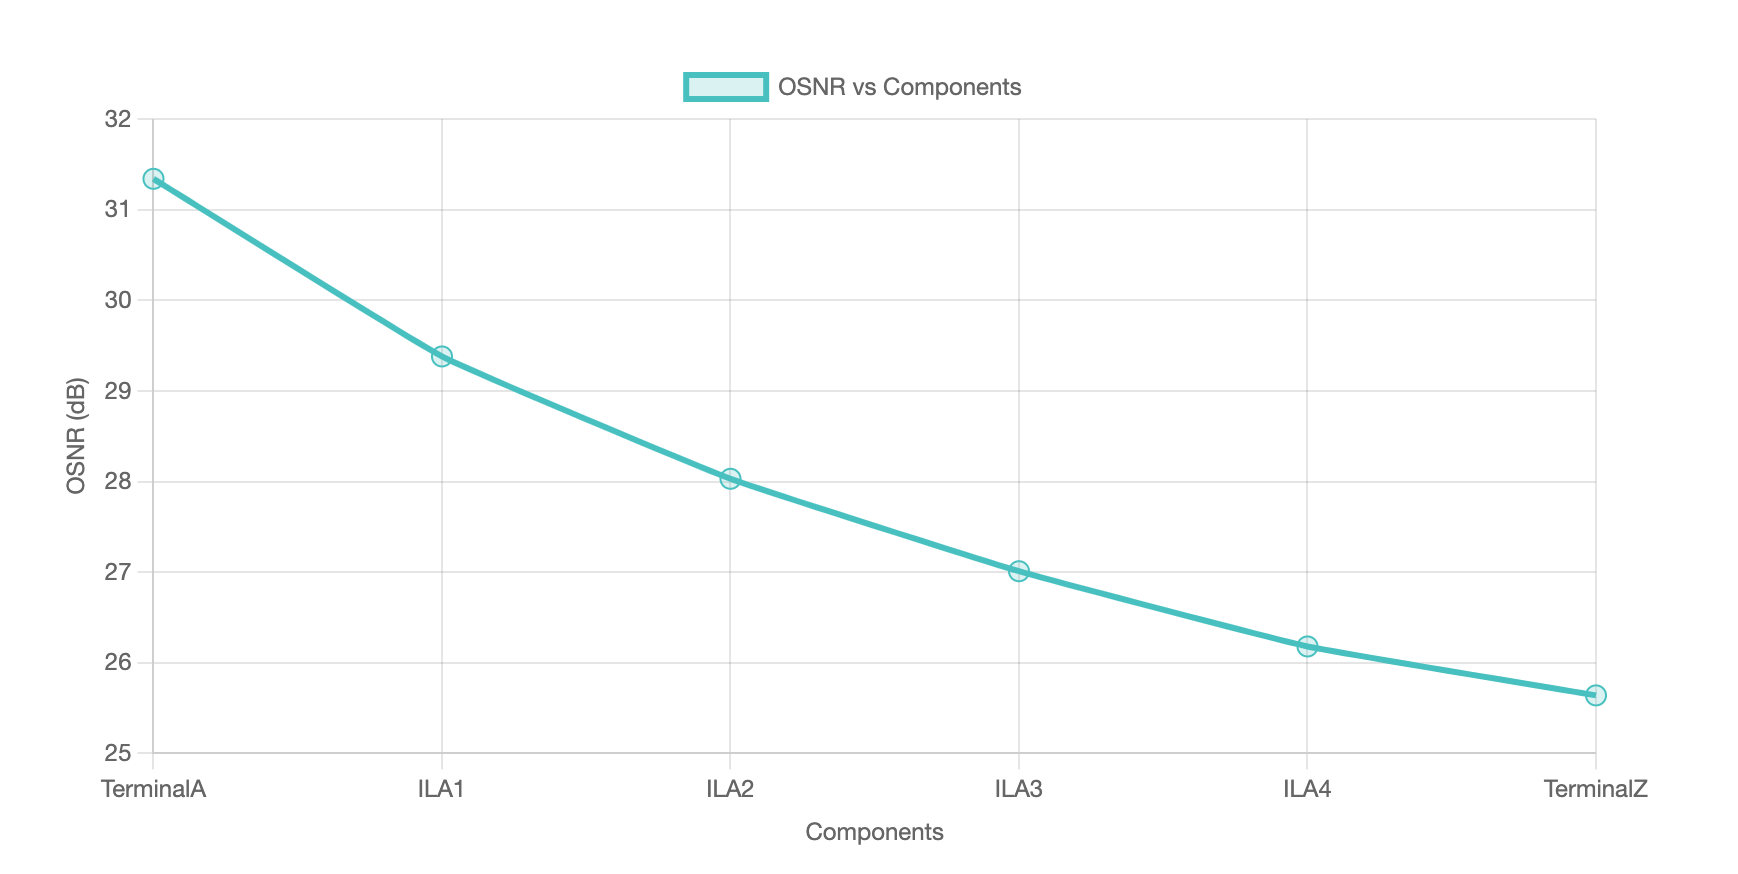
          • The OSNR vs Components chart will provide a visual representation of the OSNR values across the network components.
  6. Reset to Default:
            • Use the “Reset to Default” button to reset all values to their default settings.

Themes

You can change the visual theme of the tool using the theme selector dropdown. Available themes include:

          • Default
          • Theme 1
          • Theme 2
          • Theme 3
          • Theme 4

Each theme will update the colors and styles of the tool to suit your preferences.

Notes:

  • Editable fields are highlighted in light green. Adjust these values as needed.
  • The final OSNR value’s background color will indicate if the design is acceptable:
    • Green: OSNR meets or exceeds the required margin.
    • Red: OSNR does not meet the required margin.

Formulas used:

Composite Power Calculation

Composite Power (dBm)=Per Channel Power (dBm)+10log10(Total number of channels Insertion Loss of Filter (dB)

Net Power Change Calculation

Net Power Change (dBm)=10log10(Channels added/removed+Channels undisturbed)10log10(Channels undisturbed)

Optical Parameter Conversions
formulas

OSNR Calculation

osnr formula

RSNR Calculation

Shannon Capacity Formula

To calculate the required SNR given bit rate and baud rate:

Rearranged to solve for SNR:

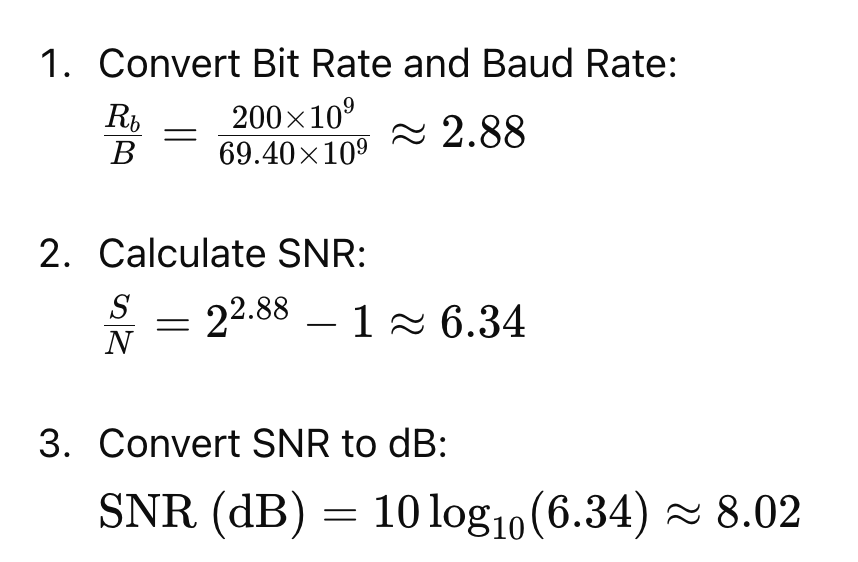
Example Calculation

Given Data:

  • Bit Rate (Rb): 200 Gbps
  • Baud Rate (Bd): 69.40 Gbaud

Example Tool Usage

Suppose you are working on a project with the following specifications:

            • Channels: 4
            • Tx OSNR: 35 dB
            • Number of ILAs: 4
  1. Enter these values in the input fields. (whatever is green is editable)
  2. The tool will generate a table with columns for TerminalA, ILA1, ILA2, ILA3, ILA4, and TerminalZ.
  3. Adjust the Pin_Composite (dBm) and Noise Figure (dB) values if necessary.
  4. The tool calculates the Pin_PerChannel (dBm) and OSNR for each component, displaying the final OSNR at TerminalZ.
  5. Input the Baud Rate to calculate the required SNR
  6. User can see the OSNR variation at each component level(ILA here) to see the variation.
OSNR Simulation Tool Link 

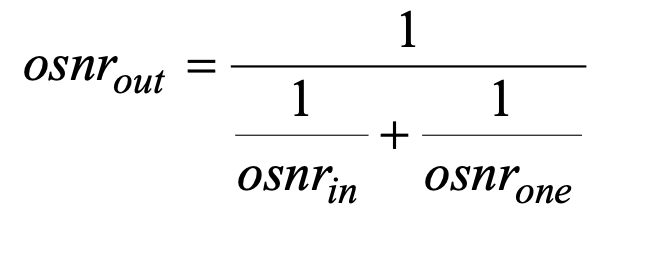
When we’re dealing with Optical Network Elements (ONEs) that include optical amplifiers, it’s important to note a key change in signal quality. Specifically, the Optical Signal-to-Noise Ratio (OSNR) at the points where the signal exits the system or at drop ports, is typically not as high as the OSNR where the signal enters or is added to the system. This decrease in signal quality is a critical factor to consider, and there’s a specific equation that allows us to quantify this reduction in OSNR. By using following equations, network engineers can effectively calculate and predict the change in OSNR, ensuring that the network’s performance meets the necessary standards.

Eq. 1
Eq.1

Where:

osnrout : linear OSNR at the output port of the ONE

osnrin : linear OSNR at the input port of the ONE

osnrone : linear OSNR that would appear at the output port of the ONE for a noise free input signal

If the OSNR is defined in logarithmic terms (dB) and the equation(Eq.1) for the OSNR due to the ONE being considered is substituted this equation becomes:

Eq.2

Where:

 OSNRout : log OSNR (dB) at the output port of the ONE

OSNRin : log OSNR (dB) at the input port of the ONE

 Pin : channel power (dBm) at the input port of the ONE

NF : noise figure (dB) of the relevant path through the ONE

h : Planck’s constant (in mJ•s to be consistent with in Pin (dBm))

v : optical frequency in Hz

vr : reference bandwidth in Hz (usually the frequency equivalent of 0.1 nm)

So if it needs to generalised the equation of an end to end point to point link, the equation can be written as

Eq.3

Where:

Pin1, Pin2 to PinN :  channel powers (dBm) at the inputs of the amplifiers or ONEs on the   relevant path through the network

NF1, NF2 to NFN : noise figures (dB) of the amplifiers or ONEs on the relevant path through the network

The required OSNRout value that is needed to meet the required system BER depends on many factors such as the bit rate, whether and what type of FEC is employed, the magnitude of any crosstalk or non-linear penalties in the DWDM line segments etc.Furthermore it will be discuss in another article.

Ref:

ITU-T G.680

As we move towards a more connected world, the demand for faster and more reliable communication networks is increasing. Optical communication systems are becoming the backbone of these networks, enabling high-speed data transfer over long distances. One of the key parameters that determine the performance of these systems is the Optical Signal-to-Noise Ratio (OSNR) and Q factor values. In this article, we will explore the OSNR values and Q factor values for various data rates and modulations, and how they impact the performance of optical communication systems.

General use table for reference

osnr_ber_q.png

What is OSNR?

OSNR is the ratio of the optical signal power to the noise power in a given bandwidth. It is a measure of the signal quality and represents the signal-to-noise ratio at the receiver. OSNR is usually expressed in decibels (dB) and is calculated using the following formula:

OSNR = 10 log (Signal Power / Noise Power)

Higher OSNR values indicate a better quality signal, as the signal power is stronger than the noise power. In optical communication systems, OSNR is an important parameter that affects the bit error rate (BER), which is a measure of the number of errors in a given number of bits transmitted.

What is Q factor?

Q factor is a measure of the quality of a digital signal. It is a dimensionless number that represents the ratio of the signal power to the noise power, taking into account the spectral width of the signal. Q factor is usually expressed in decibels (dB) and is calculated using the following formula:

Q = 20 log (Signal Power / Noise Power)

Higher Q factor values indicate a better quality signal, as the signal power is stronger than the noise power. In optical communication systems, Q factor is an important parameter that affects the BER.

OSNR and Q factor for various data rates and modulations

The OSNR and Q factor values for a given data rate and modulation depend on several factors, such as the distance between the transmitter and receiver, the type of optical fiber used, and the type of amplifier used. In general, higher data rates and more complex modulations require higher OSNR and Q factor values for optimal performance.

Factors affecting OSNR and Q factor values

Several factors can affect the OSNR and Q factor values in optical communication systems. One of the key factors is the type of optical fiber used. Single-mode fibers have lower dispersion and attenuation compared to multi-mode fibers, which can result in higher OSNR and Q factor values. The type of amplifier used also plays a role, with erbium-doped fiber amplifiers

being the most commonly used type in optical communication systems. Another factor that can affect OSNR and Q factor values is the distance between the transmitter and receiver. Longer distances can result in higher attenuation, which can lower the OSNR and Q factor values.

Improving OSNR and Q factor values

There are several techniques that can be used to improve the OSNR and Q factor values in optical communication systems. One of the most commonly used techniques is to use optical amplifiers, which can boost the signal power and improve the OSNR and Q factor values. Another technique is to use optical filters, which can remove unwanted noise and improve the signal quality.

Conclusion

OSNR and Q factor values are important parameters that affect the performance of optical communication systems. Higher OSNR and Q factor values result in better signal quality and lower BER, which is essential for high-speed data transfer over long distances. By understanding the factors that affect OSNR and Q factor values, and by using the appropriate techniques to improve them, we can ensure that optical communication systems perform optimally and meet the growing demands of our connected world.

FAQs

  1. What is the difference between OSNR and Q factor?
  • OSNR is a measure of the signal-to-noise ratio, while Q factor is a measure of the signal quality taking into account the spectral width of the signal.
  1. What is the minimum OSNR and Q factor required for a 10 Gbps NRZ modulation?
  • The minimum OSNR required is 14 dB, and the minimum Q factor required is 7 dB.
  1. What factors can affect OSNR and Q factor values?
  • The type of optical fiber used, the type of amplifier used, and the distance between the transmitter and receiver can affect OSNR and Q factor values.
  1. How can OSNR and Q factor values be improved?
  • Optical amplifiers and filters can be used to improve OSNR and Q factor values.
  1. Why are higher OSNR and Q factor values important for optical communication systems?
  • Higher OSNR and Q factor values result in better signal quality and lower BER, which is essential for high-speed data transfer over long distances.

Both composite power and per channel power are important indicators of the quality and stability of an optical link, and they are used to optimize link performance and minimize system impairments.

Composite Power Vs Per Channel power for OSNR calculation.

When it comes to optical networks, one of the most critical parameters to consider is the OSNR or Optical Signal-to-Noise Ratio. It measures the signal quality of the optical link, which is essential to ensure proper transmission. The OSNR is affected by different factors, including composite power and per channel power. In this article, we will discuss in detail the difference between these two power measurements and how they affect the OSNR calculation.

What is Composite Power?

Composite power refers to the total power of all the channels transmitted in the optical network. It is the sum of the powers of all the individual channels combined including both the desired signal and any noise or interference.. The composite power is measured using an optical power meter that can measure the total power of the entire signal.

What is Per Channel Power?

Per channel power refers to the power of each channel transmitted in the optical network. It is the individual power of each channel in the network. It provides information on the power distribution among the different channels and can help identify any channel-specific performance issues.The per channel power is measured using an optical spectrum analyzer that can measure the power of each channel separately.

Difference between Composite Power and Per Channel Power

The difference between composite power and per channel power is crucial when it comes to OSNR calculation. The OSNR calculation is affected by both composite power and per channel power. The composite power determines the total power of the signal, while the per channel power determines the power of each channel.

In general, the OSNR is directly proportional to the per-channel power and indirectly influenced by the composite power. This means that as the per-channel power increases, the OSNR also increases. On the other hand, if the composite power becomes too high, it can introduce nonlinear effects in the fiber, potentially degrading the OSNR.

The reason for this is that the noise in the system is mostly generated by the amplifiers used to boost the signal power. As the per channel power decreases, the signal-to-noise ratio decreases, which affects the overall OSNR.

OSNR measures the quality of an optical signal by comparing the power of the desired signal to the power of any background noise or interference within the same bandwidth. A higher OSNR value indicates a better signal quality, with less noise and interference.

Q factor, on the other hand, measures the stability of an optical signal and is related to the linewidth of the optical source. A higher Q factor indicates a more stable and coherent signal.

This acceptable OSNR is delivered through a relatively sophisticated analysis of signal strength per channel, amplifier distances, and the frequency spacing between channels.


OSNR=Pout-L-NF-10 Log N-10 Log[h vv 0

Pout: Per channel output power(dBm)
L:     Attenuation between two amplifiers (dB)
NF :  Noise figure of amplifier(dB)
N:    number of spans
10 Log [h vv0= - 58 dBm1.55μm, 0.1nm spectrum width)     

OSNR=Pout-L-NF-10 Log N-10 Log[h vv 0

The total transmit power is limited by the present laser technology and fiber non linearities .The key factors are the span (L) and the number of spans(N).

To calculate OSNR using per-channel power, you would measure the power of the signal and the noise in each individual channel and then calculate the OSNR for each channel. The OSNR for the entire system would be the average OSNR across all channels.

In general, using per-channel power to calculate OSNR is more accurate, as it takes into account the variations in signal and noise power across the spectrum. However, measuring per-channel power can be more time-consuming and complex than measuring composite power.

Analysis

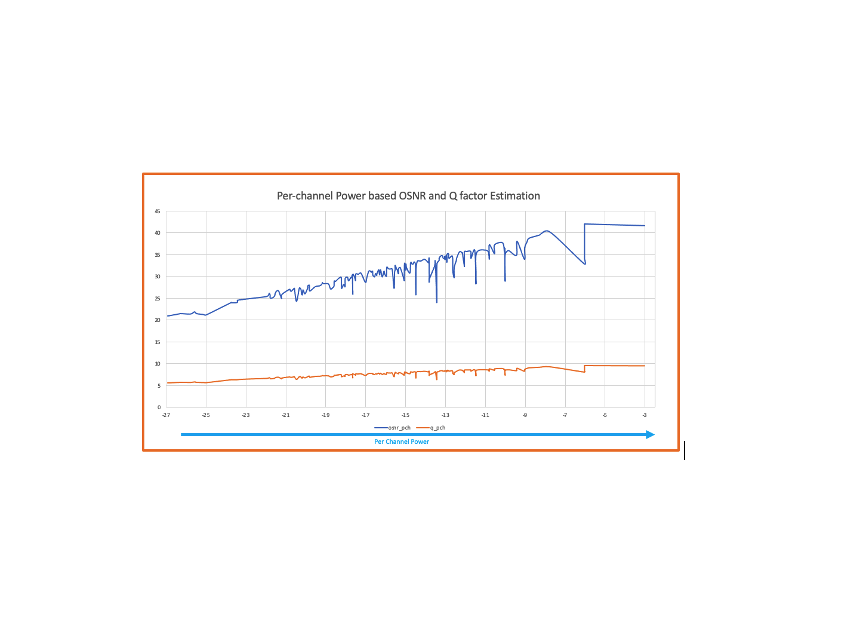
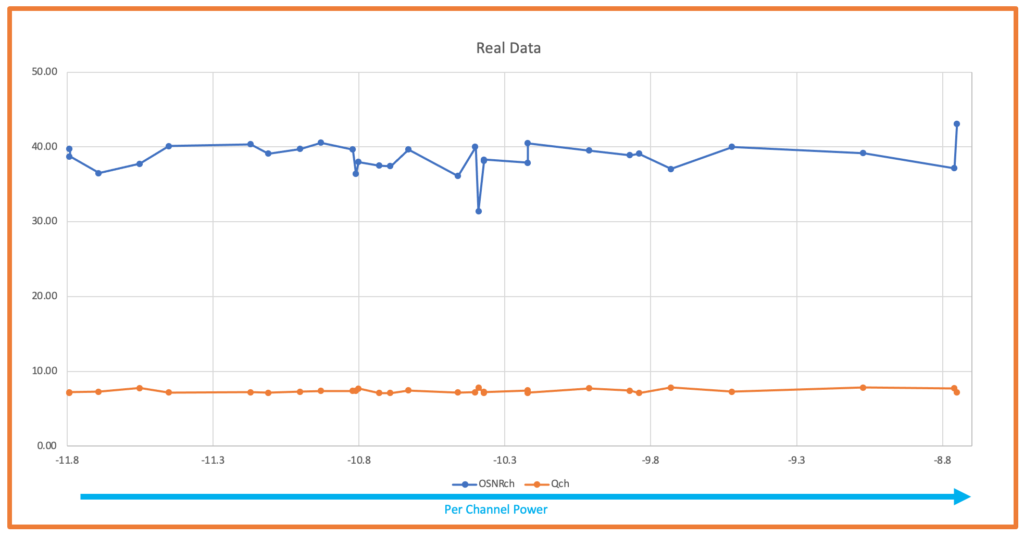
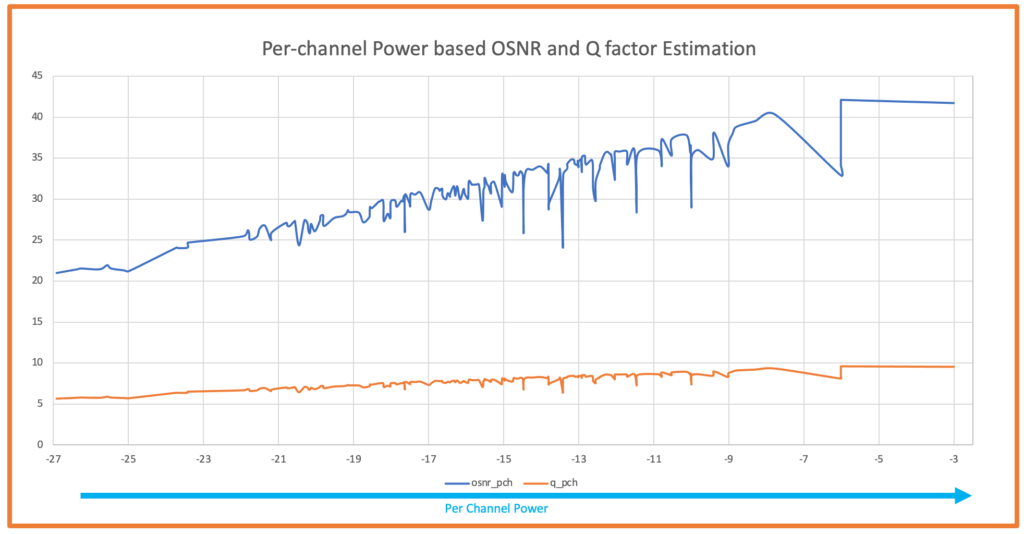
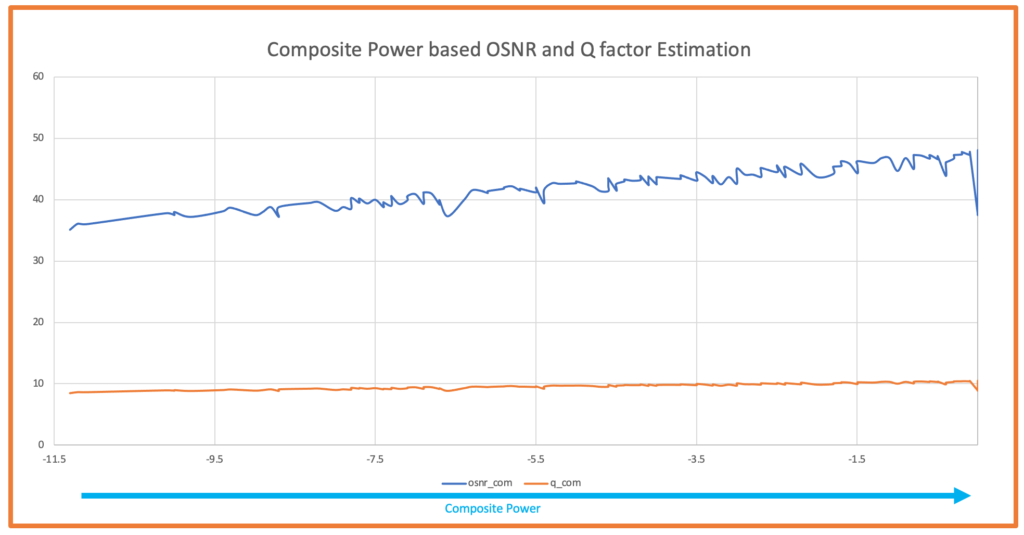
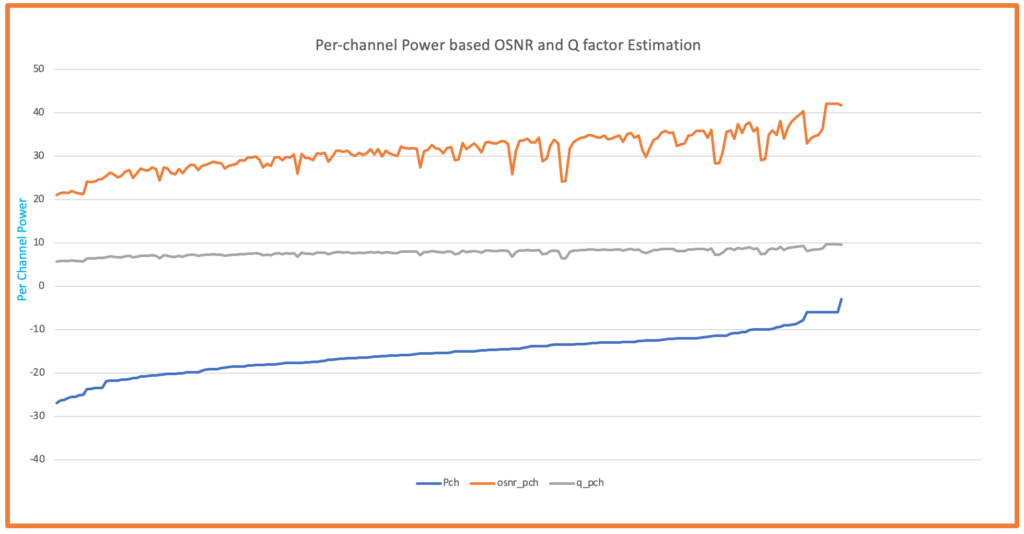
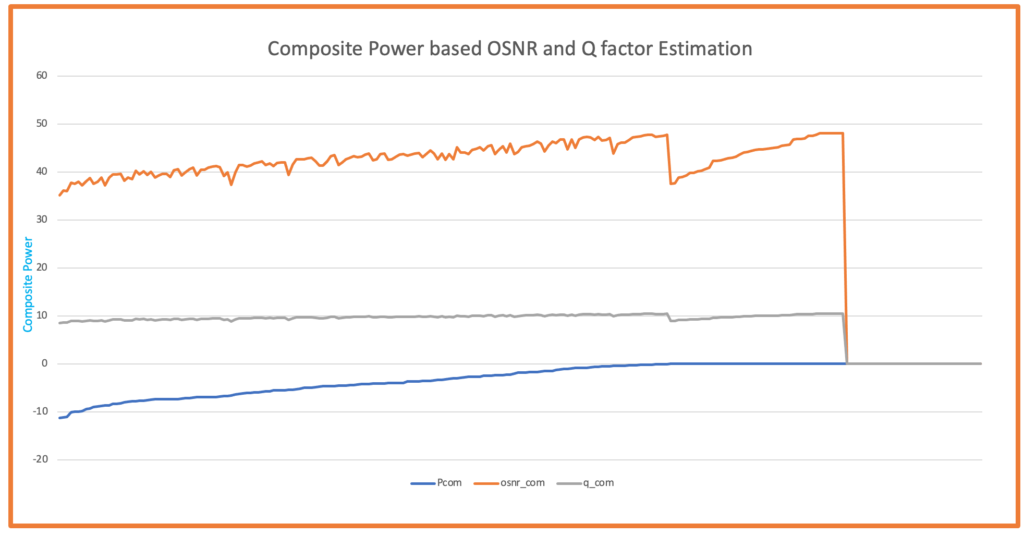
Following charts are used to deduce the understanding:-

Collected from Real device for Reference

Calculated OSNR and Q factor based on Per Channel Power.

Calculated OSNR and Q factor based on composite Power.

Calculated OSNR and Q factor based on Per Channel Power.

Calculated OSNR and Q factor based on composite Power.

Formulas used for calculation of OSNR, BER and Q factor


Useful Python Script 

import math
def calc_osnr(span_loss, composite_power, noise_figure, spans_count,channel_count):
"""
Calculates the OSNR for a given span loss, power per channel, noise figure, and number of spans.

Parameters:
span_loss (float): Span loss of each span (in dB).
composite_power (float): Composite power from amplifier (in dBm).
noise_figure (float): The noise figure of the amplifiers (in dB).
spans_count (int): The total number of spans.
channel_count (int): The total number of active channels.

Returns:
The OSNR (in dB).
"""
total_loss = span_loss+10*math.log10(spans_count) # total loss in all spans
power_per_channel = composite_power-10 * math.log10(channel_count) # add power from all channels and spans
noise_power = -58 + noise_figure # calculate thermal noise power
signal_power = power_per_channel - total_loss # calculate signal power
osnr = signal_power - noise_power # calculate OSNR
return osnr


osnr = calc_osnr(span_loss=23.8, composite_power=23.8, noise_figure=6, spans_count=3,channel_count=96)
if osnr > 8:
ber = 10* math.pow(10,10.7-1.45*osnr)
qfactor = -0.41667 + math.sqrt(-1.9688 - 2.0833* math.log10(ber)) # calculate OSNR
else:
ber = "Invalid OSNR,can't estimate BER"
qfactor="Invalid OSNR,can't estimate Qfactor"

result=[{"estimated_osnr":osnr},{"estimated_ber":ber},{"estimated_qfactor":qfactor}]
print(result)

Above program can be tested by using exact code at link.