16 min read

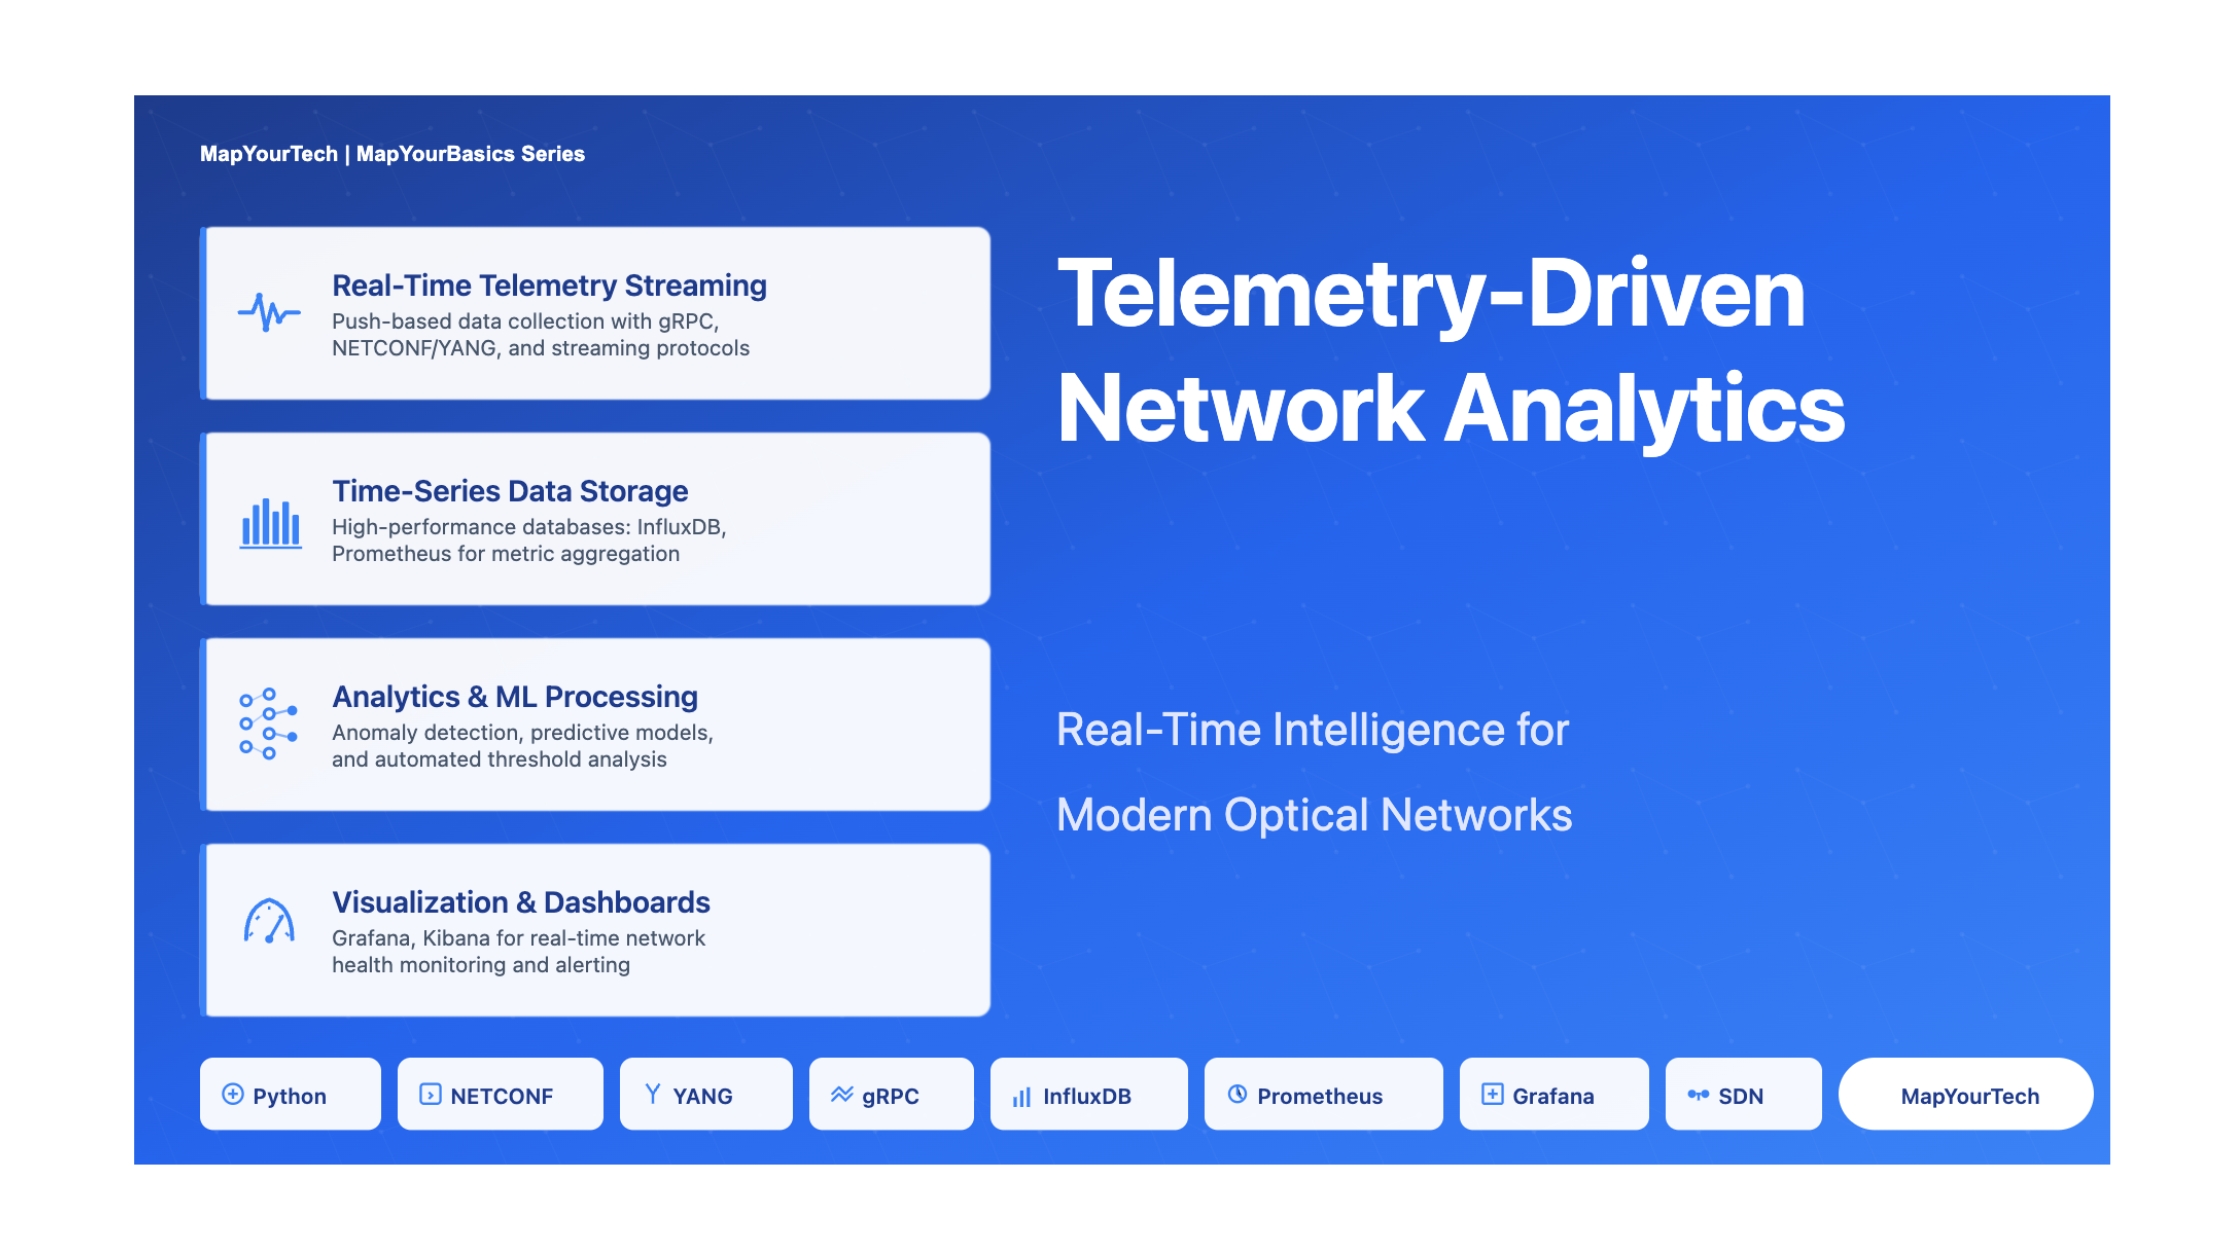
Telemetry-Driven Network Analytics
Real-Time Intelligence for Modern Optical Networks
Fundamentals & Core Concepts
Understanding Telemetry-Driven Network Analytics
Telemetry-driven network analytics represents a paradigm shift in how optical networks are monitored, managed, and optimized. At its core, this approach leverages continuous streams of real-time data from network elements to provide unprecedented visibility into network behavior, performance, and health. Unlike traditional polling-based monitoring systems that collect data at fixed intervals, telemetry enables the streaming of network state information at high frequencies, enabling operators to detect anomalies, predict failures, and optimize performance with minimal latency.
Modern optical networks generate vast quantities of data from diverse sources including network equipment, optical wavelengths, environmental sensors, and Service Level Agreement metrics. This data forms the foundation upon which intelligent automation systems are built. The ability to collect, process, analyze, and act upon this telemetry data has become essential for maintaining high-performance networks that can meet stringent availability targets and deliver superior customer experiences.
The Evolution of Network Monitoring
Traditional network management relied heavily on Simple Network Management Protocol (SNMP), which operates on a request-response model where network management systems periodically poll devices for status information. While SNMP has served the industry for decades, it presents significant limitations in modern high-speed optical networks. The polling model introduces delays, consumes bandwidth, and cannot scale effectively to handle the data volumes generated by contemporary network infrastructures.
Telemetry-driven analytics addresses these limitations through push-based streaming models where network devices continuously transmit performance metrics to centralized collection systems. This approach reduces latency from minutes to milliseconds, enables near-instantaneous fault detection, and provides the granular data required for advanced analytics and machine learning applications. The transition from reactive polling to proactive streaming represents one of the most significant advances in network operations technology.
Key Components of Telemetry Systems
A comprehensive telemetry-driven analytics system consists of several interconnected components working in harmony. Data producers include network elements such as optical transponders, amplifiers, switches, and routers that generate performance metrics. Collection systems aggregate and normalize data from multiple sources, often using protocols like NETCONF or gRPC. Time-series databases store the massive volumes of timestamped data, optimized for high-throughput writes and efficient queries. Analytics engines process the data streams, applying statistical models, machine learning algorithms, and business logic to extract actionable insights. Finally, visualization platforms present the analyzed data through intuitive dashboards that enable operators to understand network state at a glance.
Critical Performance Metrics
Mathematical Framework
OSNR and Q-Factor Relationship
The relationship between Optical Signal-to-Noise Ratio and Q-factor provides a fundamental mathematical framework for understanding signal quality in optical networks. The Q-factor can be derived from OSNR measurements, enabling engineers to predict bit error rates without extensive testing.
Where B₀ represents the optical bandwidth (typically 0.1 nm or 12.5 GHz) and Bₑ denotes the electrical bandwidth. This relationship demonstrates that Q-factor is proportional to OSNR, with typical designs maintaining a margin where OSNR exceeds Q-factor by at least 1-2 dB. For high-bit-rate systems, the receiver margin is approximately 2 dB, meaning Q-factor runs about 2 dB below the OSNR value.
BER and Q-Factor Correlation
The bit error rate demonstrates an inverse relationship with Q-factor, quantified through the complementary error function. This mathematical relationship enables network operators to estimate transmission quality based on Q-factor measurements.
A Q-factor of 6 corresponds to a BER of approximately 10⁻⁹, while higher Q-factors yield exponentially lower error rates. This relationship underscores the importance of maintaining adequate Q-factor margins to ensure reliable communication, particularly in systems employing forward error correction where pre-FEC BER values may reach 10⁻³ while post-FEC BER achieves 10⁻¹⁵.
Statistical Analysis for Anomaly Detection
Telemetry-driven analytics employs statistical methods to identify deviations from normal network behavior. Time-series analysis techniques enable the detection of trends, patterns, and anomalies that may indicate impending failures or performance degradation. Machine learning algorithms can establish baseline performance characteristics and automatically flag measurements that exceed predefined thresholds or exhibit unusual patterns, enabling proactive maintenance and optimization.
Performance Monitoring Metrics & Thresholds
Types & Components
Telemetry Collection Protocols
Modern network telemetry relies on several standardized protocols, each offering distinct advantages for different deployment scenarios. The choice of protocol significantly impacts system performance, scalability, and integration capabilities.
| Protocol | Model | Characteristics | Use Cases |
|---|---|---|---|
| SNMP | Pull-based | Legacy protocol with polling overhead, limited scalability | Traditional monitoring, basic device management |
| NETCONF/YANG | Session-based | Structured data models, vendor-neutral management | Configuration management, standardized interfaces |
| gRPC | Push-based streaming | High-performance, low latency, efficient encoding | Real-time telemetry streaming, SDN controllers |
| RESTful APIs | Request-response | HTTP-based, simple integration, human-readable | Orchestration systems, dashboard integration |
| In-band Network Telemetry (INT) | Embedded | Telemetry data embedded in packet headers | Per-packet monitoring, path tracing |
Time-Series Database Architecture
Time-series databases form the backbone of telemetry storage systems, optimized specifically for handling timestamped data with high write throughput and efficient query performance. These specialized databases support the massive data volumes generated by modern optical networks while enabling rapid retrieval for analysis and visualization.
InfluxDB excels in push-based data collection scenarios, often paired with Telegraf agents for metrics gathering. Prometheus adopts a pull-based model with integrated alerting capabilities and a powerful query language (PromQL). The selection between these platforms depends on deployment architecture, data volume requirements, and integration needs with existing monitoring infrastructure.
Visualization and Dashboard Platforms
Effective visualization transforms raw telemetry data into actionable intelligence. Modern dashboard platforms provide real-time views of network health, enabling operators to identify issues at a glance and drill down into specific metrics for detailed analysis. Grafana has emerged as the leading open-source platform for analytics and interactive visualization, supporting multiple data sources and offering extensive customization capabilities.
Advanced visualization tools integrate AI-powered analytics, predictive models, and multi-layer visualizations, enabling engineers to analyze network layers from physical optical characteristics through IP routing. Dynamic network heatmaps visualize performance across the entire infrastructure, highlighting congestion points and resource utilization patterns. Threshold-based alerting triggers real-time notifications when performance metrics breach predefined limits, enabling rapid response to emerging issues.
Data Collection Architecture
Telemetry-Driven Analytics Architecture
Effects & Impacts
Operational Excellence Through Real-Time Visibility
Telemetry-driven analytics fundamentally transforms network operations by providing unprecedented visibility into system behavior. Operators gain the ability to detect performance degradation within milliseconds rather than minutes or hours, enabling proactive intervention before issues impact service quality. This real-time awareness extends across all network layers, from physical optical parameters to application-level performance metrics.
The impact on Mean Time To Detect (MTTD) and Mean Time To Repair (MTTR) is substantial. Traditional monitoring systems often require multiple polling cycles to confirm issues, introducing delays of several minutes. Streaming telemetry eliminates this latency, enabling instant fault detection and dramatically reducing service downtime. Organizations implementing comprehensive telemetry systems report MTTD reductions of 80-90% and corresponding improvements in overall system availability.
Predictive Maintenance and Failure Prevention
The continuous data streams generated by telemetry systems enable sophisticated predictive analytics that identify potential failures before they occur. Machine learning models trained on historical performance data can recognize patterns indicative of impending component failures, allowing maintenance teams to replace or repair equipment during planned maintenance windows rather than responding to emergency outages.
Predictive analytics capabilities extend to various failure modes including gradual OSNR degradation indicating amplifier aging, increasing BER suggesting transponder issues, power fluctuations signaling fiber stress or connector problems, and temperature anomalies pointing to environmental control failures. By analyzing trends across multiple parameters simultaneously, intelligent systems can predict failures days or weeks in advance, transforming reactive break-fix operations into proactive asset management.
Capacity Planning and Resource Optimization
Telemetry data provides the foundation for intelligent capacity planning and resource optimization. By analyzing historical traffic patterns and growth trends, operators can forecast future bandwidth requirements with high accuracy. Predictive analytics enable automated bandwidth provisioning, dynamically allocating network resources to meet anticipated demand without over-provisioning infrastructure.
Service providers leverage these capabilities to optimize Total Cost of Ownership (TCO) by precisely matching network capacity to actual requirements. Instead of deploying infrastructure based on conservative peak estimates, telemetry-driven insights enable just-in-time capacity expansion, reducing capital expenditure while maintaining service quality. The ability to identify underutilized resources also supports network consolidation initiatives and more efficient spectrum management in DWDM systems.
Service Level Agreement Management
Comprehensive telemetry enables precise SLA monitoring and verification, providing both operators and customers with transparent visibility into service performance. Automated systems continuously track key metrics including availability, latency, jitter, and packet loss, generating detailed reports that demonstrate SLA compliance or identify violations requiring remediation.
For enterprise customers with stringent performance requirements, such as financial institutions requiring sub-millisecond latency for trading applications, telemetry-driven analytics provides the granular monitoring necessary to ensure contractual obligations are met. Real-time dashboards display current performance against SLA targets, while historical analysis identifies trends that may threaten future compliance, enabling proactive optimization.
Techniques & Solutions
Automated Threshold-Based Alerting
Threshold-based alerting forms the foundation of proactive network management. Operators define acceptable performance ranges for critical metrics, with automated systems generating alarms when measurements exceed these boundaries. Effective threshold configuration requires careful consideration of normal operating conditions, environmental factors, and service requirements to minimize false positives while ensuring genuine issues receive immediate attention.
Advanced alerting systems implement multi-level thresholds with corresponding severity classifications. Minor threshold breaches may trigger informational notifications and automated data collection for trending analysis, while critical violations immediately escalate to on-call personnel and may initiate automated remediation workflows. Intelligent correlation algorithms group related alarms to identify root causes and prevent alert storms that overwhelm operations teams.
Machine Learning for Anomaly Detection
Machine learning techniques enhance telemetry analytics by identifying subtle anomalies that may escape threshold-based detection. Unsupervised learning algorithms establish baseline performance profiles from historical data, automatically flagging measurements that deviate significantly from expected patterns even when they remain within configured thresholds.
These AI-driven systems excel at detecting gradual degradation that occurs slowly enough to evade sudden threshold violations but ultimately leads to service impact. For example, progressive OSNR decline across multiple amplifier spans may indicate accumulated fiber stress or contamination, requiring preventive maintenance before customer-visible failures occur. Neural networks trained on years of operational data can recognize complex multi-parameter patterns indicative of specific failure modes, enabling precise diagnosis and targeted remediation.
Closed-Loop Automation
The ultimate expression of telemetry-driven analytics is closed-loop automation, where systems not only detect issues but automatically implement corrective actions without human intervention. This approach combines real-time telemetry, intelligent analytics, and automated control to create self-healing networks that maintain optimal performance despite changing conditions and emerging problems.
Closed-loop systems continuously monitor network state, compare observed performance against desired outcomes, and execute remediation workflows when discrepancies are detected. Applications include dynamic traffic rerouting around congested or degraded paths, automatic power level adjustments to maintain OSNR targets, wavelength reallocation to balance load across DWDM channels, and adaptive modulation format selection based on real-time channel conditions. These capabilities enable networks to self-optimize, adapting to traffic patterns and environmental changes without manual configuration.
Closed-Loop Automation Workflow
Integration with SDN Controllers
Software-Defined Networking controllers provide the programmatic interface necessary for closed-loop automation. Telemetry systems feed real-time performance data to SDN controllers, which execute control plane modifications to optimize network behavior. This integration enables centralized management of distributed optical infrastructure, with analytics-driven decisions implemented across all network layers.
Leading SDN platforms including ONOS (Open Network Operating System) and OpenDaylight provide robust APIs for telemetry integration and automated control. These controllers support NETCONF/YANG for standardized device management, gRPC for high-performance streaming, and RESTful APIs for orchestration system integration, creating a comprehensive automation framework that spans from raw telemetry collection through high-level policy implementation.
Practical Applications
Data Center Interconnect Monitoring
A cloud service provider operates a distributed data center infrastructure with 400G optical links interconnecting facilities across metropolitan regions. Real-time dashboards display critical metrics including OSNR, BER, and optical power levels for each wavelength across all links. Automated alerting systems monitor performance continuously, triggering email and SMS notifications when OSNR drops below 20 dB thresholds.
When telemetry indicates degrading performance on a primary link, automated systems initiate diagnostic workflows to determine root cause while simultaneously activating redundant paths to maintain service continuity. The telemetry data enables engineers to identify specific transponder or fiber issues, dispatching maintenance teams with precise troubleshooting information that accelerates restoration.
Predictive Traffic Management
A Tier-1 service provider leverages predictive analytics to manage bandwidth in metropolitan networks. Machine learning models analyze historical traffic data, identifying patterns associated with recurring events such as business hours peaks, weekend streaming surges, and special event demands. When the system predicts a traffic surge in specific regions, it automatically provisions additional wavelengths in affected routes and rebalances existing capacity to prevent congestion.
This proactive capacity management ensures seamless service delivery during high-demand periods while optimizing resource utilization during normal operations. The telemetry-driven approach eliminates the over-provisioning traditionally required to handle peak loads, reducing capital expenditure while maintaining superior customer experience.
Latency-Sensitive Application Support
Financial institutions operating high-frequency trading platforms require consistently low latency and minimal jitter to maintain competitive advantage. Telemetry systems continuously monitor latency and jitter metrics across optical networks, ensuring performance remains within stringent SLA targets of 1 ms latency with 0.1 ms jitter tolerance.
When real-time monitoring detects jitter increases or latency spikes, automated traffic engineering systems dynamically adjust routing to utilize less congested paths. Advanced analytics identify the root causes of performance variations, whether due to fiber path changes, equipment issues, or traffic patterns, enabling targeted optimization that maintains the ultra-low latency required for financial applications.
Automated Performance Reporting
National carriers implement automated performance reporting systems that generate comprehensive OSNR, BER, and availability reports for 100G and 400G optical backbone infrastructure. These reports provide transparency to both internal operations teams and enterprise customers, demonstrating SLA compliance and network health.
Telemetry data feeds automated report generation systems that produce daily, weekly, and monthly performance summaries. Historical trend analysis identifies gradual performance changes that may require attention, while real-time dashboards enable on-demand access to current network status. This comprehensive visibility supports proactive customer engagement and provides the documentation necessary for contractual compliance verification.
Implementation Best Practices
Successful telemetry-driven analytics implementations follow proven patterns that maximize value while minimizing operational disruption. Begin with clear objectives and measurable key performance indicators that align with business goals. Start small with pilot deployments that demonstrate value before scaling across the entire infrastructure. Ensure adequate network bandwidth and processing capacity to handle telemetry data volumes without impacting production traffic.
Invest in proper data modeling and schema design for time-series databases, as these architectural decisions significantly impact query performance and storage efficiency. Implement robust data retention policies that balance historical analysis requirements against storage costs. Establish comprehensive security controls to protect sensitive performance data and prevent unauthorized access to network intelligence. Finally, continuously refine threshold configurations and machine learning models based on operational experience to improve accuracy and reduce false positives.
Future Directions
The evolution of telemetry-driven network analytics continues toward increasingly sophisticated automation and intelligence. Intent-based networking represents the next frontier, where operators specify desired outcomes in high-level language and automation systems translate these intents into concrete network configurations. AI-driven systems will develop deeper understanding of complex multi-layer interactions, enabling holistic optimization that considers physical optical constraints, transport layer efficiency, and application requirements simultaneously.
Emerging technologies including digital twins will enable comprehensive network simulation and what-if analysis, allowing operators to test configuration changes and optimization strategies in virtual environments before production deployment. As networks continue scaling to terabit speeds and beyond, telemetry-driven analytics will become even more critical for maintaining the visibility and control necessary to deliver reliable, high-performance services in increasingly complex environments.
For educational purposes in optical networking and DWDM systems
Note: This guide is based on industry standards, best practices, and real-world implementation experiences. Specific implementations may vary based on equipment vendors, network topology, and regulatory requirements. Always consult with qualified network engineers and follow vendor documentation for actual deployments.
Unlock Premium Content
Join over 400K+ optical network professionals worldwide. Access premium courses, advanced engineering tools, and exclusive industry insights.
Already have an account? Log in here