OTN Error Performance Parameters: BBE, ES, SES, and UAS
A comprehensive guide to understanding and applying ITU-T G.8201 error performance events, parameters, and objectives in Optical Transport Networks — from block-level error detection to network-wide availability assessment.
1. Introduction
Optical Transport Networks (OTN), defined by ITU-T G.709, form the backbone of modern telecommunications infrastructure — carrying everything from enterprise Ethernet traffic and data center interconnects to long-haul backbone and submarine cable systems. As line rates scale from 100G (OTU4) to 400G and beyond, the ability to measure, quantify, and act on transmission quality becomes a non-negotiable requirement for network operators.
Bit Error Rate (BER) remains the most fundamental measure of signal quality in any digital transmission system. However, BER alone does not provide enough granularity for operational decision-making. A single BER figure averaged over hours or days masks critical information: Was the link error-free for 99% of the time and severely degraded for the remaining 1%? Did errors arrive in bursts or as a steady trickle? Was the link completely down during any interval?
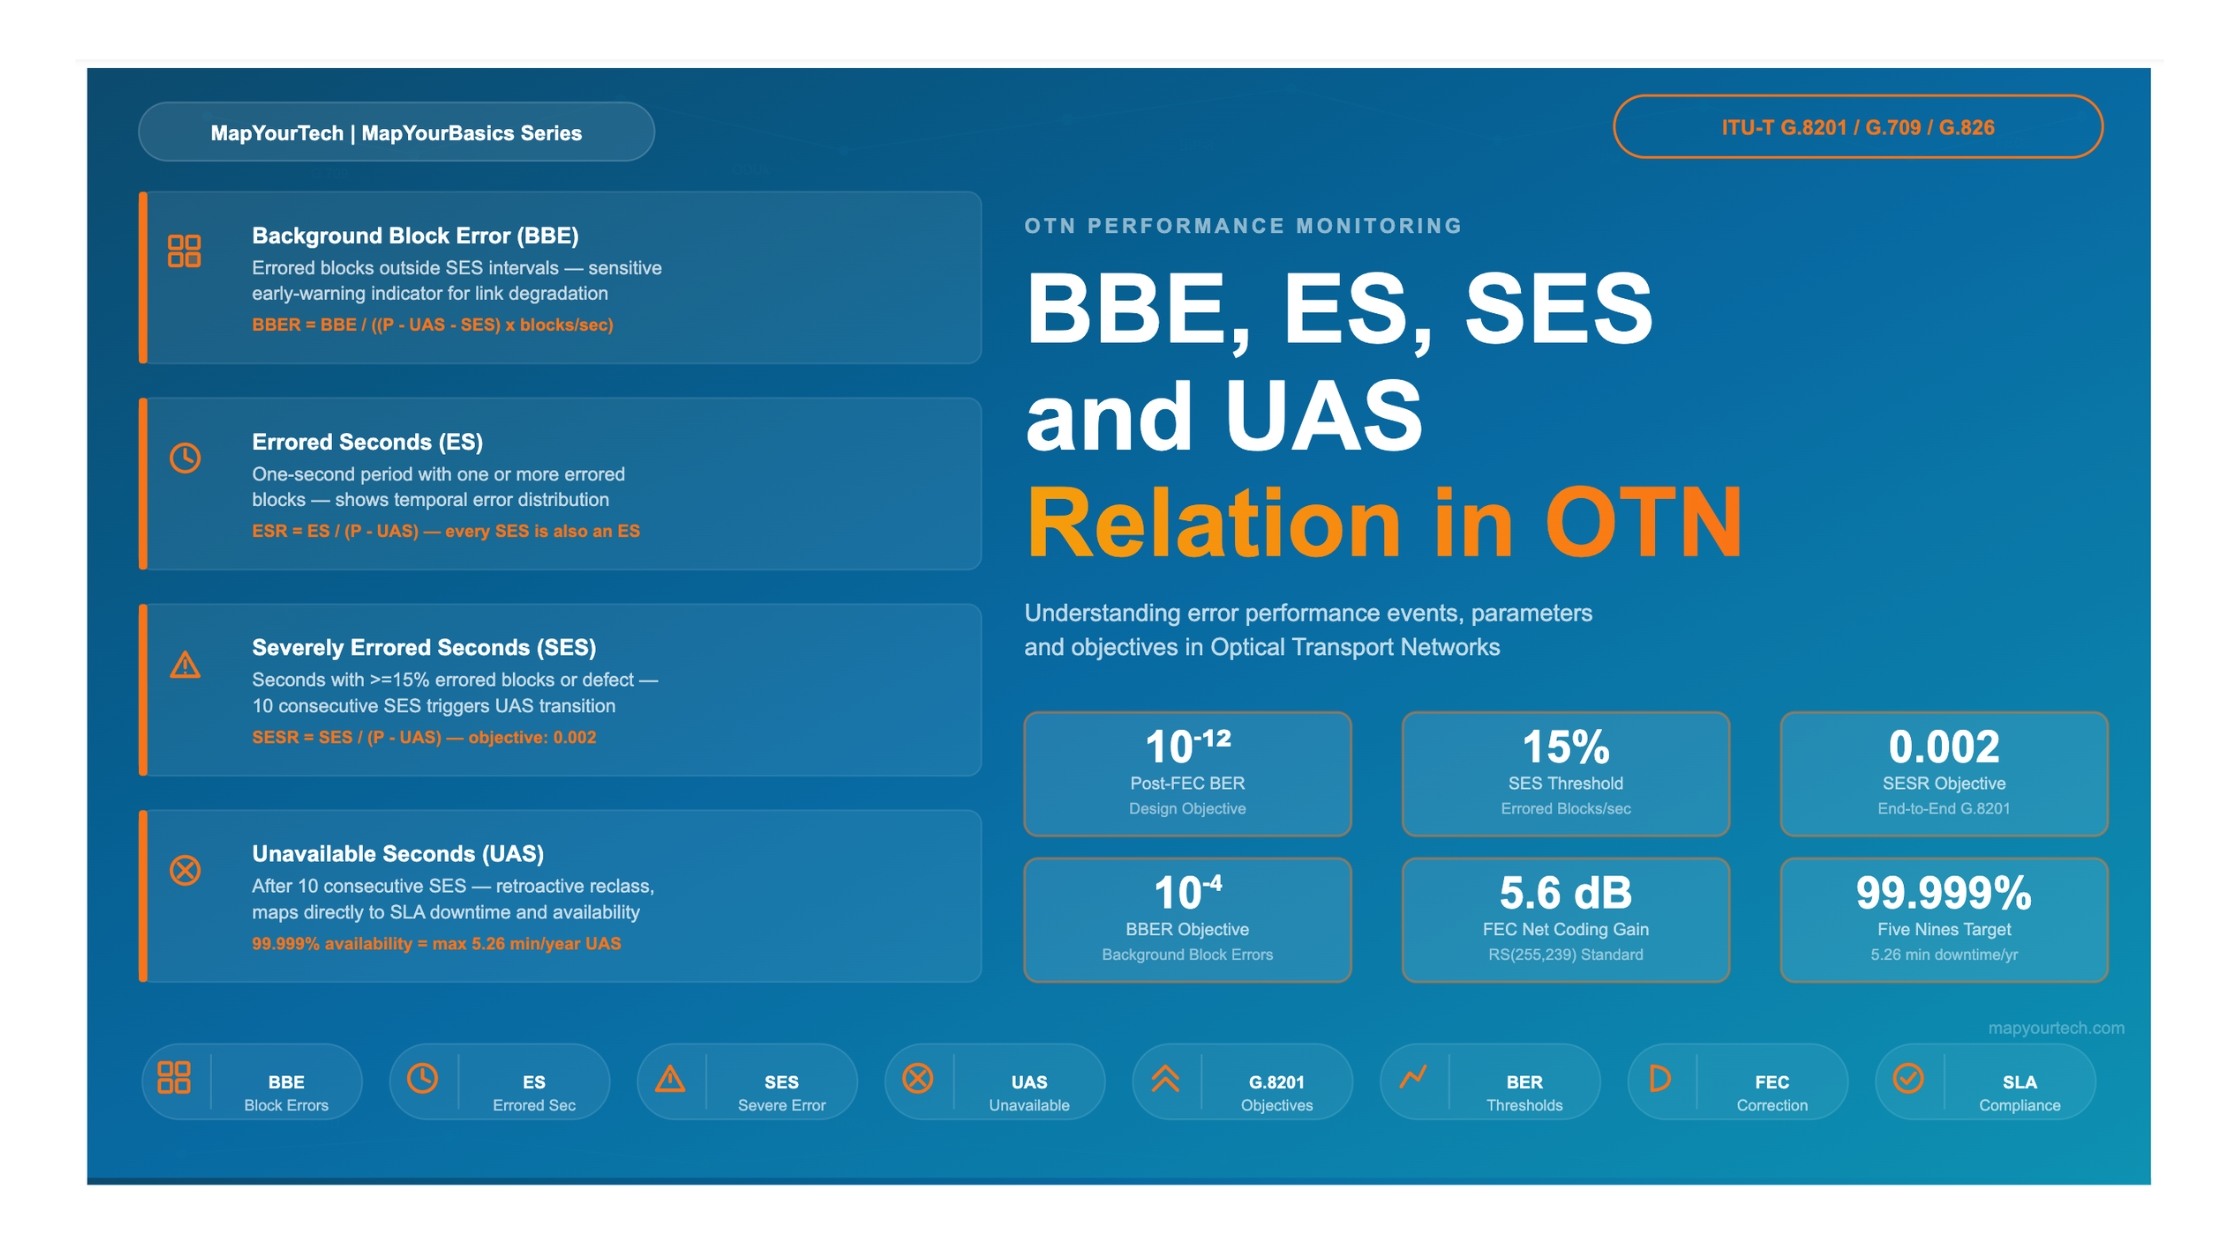
To answer these questions, the ITU-T developed a structured set of error performance events and parameters — Background Block Error (BBE), Errored Seconds (ES), Severely Errored Seconds (SES), and Unavailable Seconds (UAS). These parameters, defined for OTN paths in ITU-T G.8201, translate raw bit errors into operationally meaningful metrics that map directly to service-level agreements (SLAs), maintenance thresholds, and network availability targets.
This article explores each parameter in depth, covers the mathematical relationships and ITU-T objectives, and provides worked examples that optical networking professionals can apply to real deployment scenarios.
2. OTN Performance Monitoring Architecture
2.1 Layered Monitoring in OTN
OTN employs a multi-layered architecture that separates transport functions across three primary layers: the Optical Transport Unit (OTU), the Optical Data Unit (ODU), and the Optical Payload Unit (OPU). Each layer includes dedicated overhead bytes for performance monitoring, enabling operators to isolate degradation to specific network segments.
At the OTU layer, Section Monitoring (SM) provides link-by-link error detection between adjacent OTN nodes. The SM field carries a Bit Interleaved Parity (BIP-8) code that the receiving node checks against the incoming signal to detect block errors. At the ODU layer, Path Monitoring (PM) provides end-to-end supervision across the entire ODU path — from the point of origination to the point of termination. The PM overhead includes BIP-8 for error detection along with backward reporting mechanisms (BEI — Backward Error Indication) that enable far-end monitoring.
The error performance parameters BBE, ES, SES, and UAS are primarily derived at the ODU layer through Path Monitoring, making them true end-to-end quality indicators. Submarine cable systems, terrestrial long-haul networks, and metro DWDM deployments all rely on these ODU PM counters — collected and stored in 15-minute and 24-hour intervals — to assess ongoing path quality.
2.2 Performance Data Collection
Network management systems (NMS) collect OTN performance monitoring (PM) counters from each network element. These counters accumulate in two standard intervals: 15-minute bins (with 96 bins retained per 24-hour period, covering the latest 24 hours) and 24-hour bins. In submarine cable networks, the Shore Line Terminal Equipment (SLTE) stores PM data for the current 15-minute period and up to 192 previous 15-minute periods, covering the latest 48 hours. This data is transmitted to the NMS every 15 minutes. The PM counters include OTN performance parameters as defined in ITU-T G.8201, Ethernet counters as defined in ITU-T G.802.3 and G.828, and Forward Error Correction (FEC) counters.
| OTN Layer | Monitoring Scope | Error Detection | Key PM Counters |
|---|---|---|---|
| OTU (SM) | Section (link-by-link) | BIP-8 | BER, BBE, FEC corrections |
| ODU (PM) | Path (end-to-end) | BIP-8, BEI | BBE, ES, SES, UAS |
| OPU | Payload | Payload type/structure | CSF, PLM |
3. The Block-Based Error Detection Model
The ITU-T error performance framework is built on a block-based detection model, not a bit-by-bit model. This distinction is fundamental to understanding how BBE, ES, and SES are derived.
In OTN, a "block" corresponds to a set of bits monitored by a single BIP-8 calculation within one OTN frame. Each ODUk frame generates a fixed number of blocks per second, determined by the ODUk rate and frame structure. For example, an ODU0 path (approximately 1.25 Gbit/s) produces 10,168 blocks per second. An ODU4 path (approximately 100 Gbit/s) produces a much higher block count per second.
A block in which one or more bits are in error is called an Errored Block (EB). The EB is the fundamental building block for all higher-level error performance events. A single bit error within a block produces one EB — the same as if every bit in that block were in error. This binary "errored or not" classification per block is what makes block-based monitoring efficient and scalable at high line rates.
The block-based model has an important consequence: it does not distinguish between one bit error in a block and many bit errors in the same block. Both count as exactly one EB. This is acceptable because BIP-8 parity checks are also binary — they detect the presence of errors in a block but do not count the exact number of errored bits. For precise BER estimation, operators rely on FEC correction counts (which provide a granular bit-level error count), while block-based counters serve the complementary role of time-domain error characterization.
4. Error Performance Events — Definitions
ITU-T G.8201 defines four primary error performance events. Each builds upon the previous, creating a hierarchical view of network health from individual block errors up to complete service outages.
Background Block Error (BBE)
An errored block that does not occur as part of a Severely Errored Second (SES). BBE captures the "background noise" of errors on a path — the low-level, sporadic errors that occur during otherwise acceptable transmission conditions. BBE is the most sensitive indicator of link quality degradation and often serves as an early warning of emerging problems such as amplifier gain tilt, connector degradation, or increasing fiber attenuation.
Errored Second (ES)
A one-second period that contains one or more errored blocks. ES captures the time-domain distribution of errors. A path might accumulate many BBE counts, but if all those errored blocks fall within a few seconds, the ES count remains low. Conversely, a path with evenly distributed errors will show a high ES count even if the total BBE is modest. ES tells you how often errors occur.
Severely Errored Second (SES)
A one-second period that contains ≥15% errored blocks or at least one defect (such as LOS, LOF, or AIS). SES represents severe degradation — periods where the error density is so high that the path is effectively unusable. A one-second interval that contains a detected defect (regardless of the error count) is also classified as an SES. For ODU1, the SES threshold is 3,046 errored blocks per second; for ODU2 it is 12,304; and for ODU3 it is 49,424.
Unavailable Second (UAS)
A period of unavailable time begins at the onset of ten consecutive SES events. The ten SES that triggered the transition are retroactively counted as UAS (not as SES). The path returns to the available state after ten consecutive non-SES seconds. UAS directly maps to network downtime and is the primary metric for availability calculations and SLA compliance.
| Path Type | Approximate Bit Rate | SES Threshold (Errored Blocks) | Threshold as % of Blocks |
|---|---|---|---|
| ODU0 | 1.25 Gbit/s | 1,526 EBs | 15% |
| ODU1 | 2.5 Gbit/s | 3,046 EBs | 15% |
| ODU2 | 10 Gbit/s | 12,304 EBs | 15% |
| ODU3 | 40 Gbit/s | 49,424 EBs | 15% |
| ODU4 | 100 Gbit/s | Approximately 15% of total blocks/s | 15% |
Key relationship: Every SES is inherently an ES, but not every ES is an SES. Similarly, errored blocks that occur during an SES are not counted as BBE — they are excluded from the BBE count to prevent double-counting. This means BBE only captures errors during "available, non-severely-errored" time — the background error rate of an otherwise functioning path.
5. Error Performance Parameters and Ratios
While the events (EB, ES, SES, UAS) count occurrences, the ITU-T performance objectives are specified as ratios. Ratios normalize the measurements against the observation period, making it possible to compare performance across different measurement intervals and path lengths.
5.1 Errored Second Ratio (ESR)
ESR = ES / (P - UAS)ESR indicates the fraction of available time affected by at least one error. For OTN paths operating at high bit rates (ODU1 and above), ITU-T G.8201 does not specify ESR objectives because at high line rates, even a very low BER produces frequent ES. ESR monitoring is still recommended for maintenance purposes.
5.2 Severely Errored Second Ratio (SESR)
SESR = SES / (P - UAS)SESR is the primary quality indicator in ITU-T G.8201. The end-to-end SESR objective for a 27,500 km hypothetical reference path is 0.002 (or 0.2%). This means that over a 30-day evaluation period, no more than approximately 518 seconds (about 8.6 minutes) should be classified as SES.
5.3 Background Block Error Ratio (BBER)
BBER = BBE / ((P - UAS - SES) × blocks_per_second)BBER captures the underlying error floor of a path. A well-engineered link with adequate OSNR margin typically shows a BBER in the range of 10-6 or better. As components age or environmental conditions shift, rising BBER provides advance warning well before the path begins experiencing SES or UAS.
6. ITU-T G.8201 Objectives and Thresholds
ITU-T G.8201 specifies end-to-end error performance objectives for international ODUk paths. The objectives are evaluated over a one-month (30-day) measurement interval. A path meets the requirements only if all parameters simultaneously satisfy their respective objectives — failure of any single parameter constitutes non-compliance.
| Parameter | Objective | Practical Meaning (30-day period) |
|---|---|---|
| SESR | 0.002 | No more than ~5,184 SES in 30 days (approximately 86.4 minutes) |
| BBER | 10-4 | No more than 1 errored block per 10,000 blocks during non-SES available time |
| ESR | Not specified for ODUk | At high bit rates, ESR loses significance; monitoring still recommended |
These end-to-end objectives apply to a 27,500 km hypothetical reference path (HRP). For real deployments, the objectives are allocated across the path using length-based and complexity-based allocation rules defined in G.8201 clause 8.3. National portions of the path receive at least 17.5% of the end-to-end objective, with the remainder allocated proportionally across international portions based on distance.
The OTN optical section design objective specifies an end-of-life BER not worse than 10-12. This requirement derives from ITU-T G.826/G.828 for SDH applications and from G.8201 for OTN applications. For OTN interfaces using mandatory FEC (as specified in G.709), the BER requirement is met at the FEC decoder output. A pre-FEC BER as high as 1.8 × 10⁻⁴ can be corrected by the standard RS(255,239) FEC to achieve a post-FEC BER of 10-12. Modern SD-FEC implementations can tolerate pre-FEC BER up to approximately 10-2 (for 400G coherent systems).
7. The UAS State Machine
The transition between the Available and Unavailable states follows a specific state machine defined in ITU-T G.826 Annex A and adopted by G.8201. Understanding this state machine is essential for correct interpretation of PM counters and for writing accurate performance analysis software.
7.1 Entry into Unavailable State
A path enters the unavailable state at the onset of ten consecutive SES events. When this transition occurs, the ten SES that triggered it are retroactively reclassified as UAS. This means the NMS must buffer at least ten seconds of performance data before finalizing the classification of each second. In practice, equipment firmware maintains a rolling buffer and applies the reclassification retroactively once the tenth consecutive SES is confirmed.
7.2 Exit from Unavailable State
A path exits the unavailable state and returns to the available state after ten consecutive seconds that are not SES. The ten seconds that trigger the return are counted as available time (and may themselves be ES if they contain errored blocks below the SES threshold).
7.3 Counting Rules During State Transitions
Error performance events (ES, SES, BBE) are only counted during available time. Seconds classified as UAS are excluded from all available-time calculations. This means a path that is unavailable for a significant portion of the measurement period will have its ESR, SESR, and BBER calculated only over the remaining available time — potentially masking performance issues that occur during reactivation.
Consider a sequence of seconds labeled by their status: [SES, SES, SES, SES, SES, SES, SES, SES, SES, SES, SES, ES, ES, ES, OK, OK, OK, OK, OK, OK, OK, OK, OK, OK]
At the 10th consecutive SES, the path transitions to the unavailable state. The first 10 SES are retroactively reclassified as UAS. The 11th second (still SES) is also UAS. Seconds 12-14 (ES, meaning they contain errors but below the SES threshold) are still UAS because we haven't yet seen 10 consecutive non-SES seconds. Seconds 15-24 are 10 consecutive non-SES seconds, so the path returns to the available state at the end of second 24. Seconds 15-24 are counted as available time. Total UAS in this sequence: 14 seconds (seconds 1-14).
8. BER, Q-Factor, and FEC Context
8.1 BER and Q-Factor Relationship
The Q-factor provides a standardized measure of signal quality that directly correlates with BER under Gaussian noise assumptions. For On-Off Keying (OOK) systems, the relationship is expressed as:
BER ≈ (1 / (Q × √(2π))) × e-Q2/28.2 FEC and Error Performance
Forward Error Correction is a defining feature of OTN and directly impacts all error performance parameters. The standard G.709 RS(255,239) FEC provides a net coding gain (NCG) of approximately 5.6 dB at a reference BER of 10-12. This means the system can tolerate a pre-FEC BER of 1.8 × 10⁻⁴ while still delivering a post-FEC BER of 10-12.
In coherent 100G/200G/400G systems, enhanced SD-FEC (Soft-Decision FEC) provides NCG values of 10-12 dB, tolerating pre-FEC BER in the range of 1.5 × 10⁻² to 2.4 × 10⁻². The error performance parameters (BBE, ES, SES, UAS) are measured at the post-FEC output. In a well-functioning link, FEC corrects virtually all errors, resulting in zero or near-zero BBE and ES counts. When post-FEC errors begin appearing, this signals that the pre-FEC BER has exceeded or is approaching the FEC correction limit — a condition that demands immediate attention.
| FEC Type | Application | Max Pre-FEC BER Input | Post-FEC BER Output | NCG (dB) |
|---|---|---|---|---|
| RS(255,239) | G.709 standard OTN | 1.8 × 10⁻⁴ | 10-12 | 5.6 |
| BCH (4359,4320) | SDH in-band FEC | 2.9 × 10⁻⁶ | 10-12 | 3.8 |
| Enhanced SD-FEC | 100G-400G coherent | ~1.5-2.4 × 10⁻² | 10-15 | 10-12 |
8.3 Operational KPI Thresholds
In practice, network operators establish threshold values for key performance indicators that trigger alarms at progressively higher severity levels. The table below shows typical operational thresholds used in deployed optical networks.
| KPI | Normal Range | Warning | Critical | Action |
|---|---|---|---|---|
| OSNR | > 23 dB | 20-23 dB | < 20 dB | Optimize power |
| Q-Factor | > 7 | 6-7 | < 6 | Check FEC |
| BER (post-FEC) | < 10-12 | 10-9 | 10-6 | Troubleshoot |
| Rx Power | -5 to +5 dBm | ±7 dBm | ±10 dBm | Adjust VOA |
9. Worked Examples and Calculations
9.1 Example 1: 24-Hour Monitoring of an ODU2 Path
An operator monitors an ODU2 (10 Gbit/s) path for 24 hours and records the following data:
| Parameter | Recorded Value |
|---|---|
| Total seconds in period (P) | 86,400 |
| Seconds with ≥1 errored block (but <15% errored) | 120 |
| Seconds with ≥15% errored blocks (SES) | 5 |
| Consecutive SES events (max run) | 3 (not 10 consecutive, so no UAS) |
| Total errored blocks in non-SES seconds | 850 |
| Blocks per second (ODU2) | Approximately 40,893 |
UAS: The maximum consecutive SES run is 3, which is below the threshold of 10 consecutive SES required to trigger unavailability. Therefore, UAS = 0.
ES count: Total ES = seconds with errored blocks + SES = 120 + 5 = 125 (every SES is also an ES).
ESR:
ESR = ES / (P - UAS)
    = 125 / (86,400 - 0)
    = 1.447 × 10⁻³
SESR = SES / (P - UAS)
= 5 / (86,400 - 0)
= 5.787 × 10⁻⁵
G.8201 end-to-end objective: SESR ≤ 0.002
Result: 5.787 × 10⁻⁵ << 0.002 — PASSBBER = BBE / ((P - UAS - SES) × blocks/s)
= 850 / ((86,400 - 0 - 5) × 40,893)
= 850 / 3,533,092,845
= 2.406 × 10⁻⁷
G.8201 end-to-end objective: BBER ≤ 10-4
Result: 2.406 × 10⁻⁷ << 10-4 — PASSThis ODU2 path is performing well within ITU-T G.8201 objectives. The 120 ES (errored but not severely errored) suggest a low-level background error presence — perhaps from a marginal OSNR on one span or intermittent connector reflections — that warrants investigation but does not constitute a service-affecting condition.
9.2 Example 2: Scenario with UAS Transition
An ODU4 (100G) path is monitored over a 1-hour maintenance window. During this period, a fiber event causes 15 consecutive SES followed by recovery.
Total seconds: P = 3,600
SES sequence: 15 consecutive SES, then 10 consecutive non-SES (recovery)
UAS transition: At the 10th consecutive SES, the path enters the unavailable state. All 15 SES seconds plus any subsequent seconds until 10 consecutive non-SES are counted as UAS.
UAS count: 15 seconds (the 15 consecutive SES seconds; the path returns to available after the subsequent 10 non-SES seconds)
SES count (available time): 0 (the original SES were reclassified as UAS)
Available time: 3,600 - 15 = 3,585 seconds
This example illustrates a critical point: the 15 SES do not appear in the SES counter — they have been absorbed into the UAS counter. If an operator looks only at SES and sees zero, they might incorrectly conclude the path was healthy. The UAS counter reveals the true picture.
10. Practical Applications and Troubleshooting
10.1 Interpreting PM Counters Operationally
Error performance parameters serve different diagnostic roles. Rising BBE without any SES typically indicates gradual degradation — an aging amplifier, increasing connector loss, or fiber bending loss from environmental changes. This is the "canary in the coal mine" that enables proactive maintenance. Sudden SES bursts (without sustained UAS) often point to transient events: protection switching, power supply fluctuations, or intermittent connector vibration. Sustained UAS indicates a hard failure: fiber cut, complete equipment failure, or a protection path that has also failed.
| Error Pattern | Probable Cause | Severity | Typical Resolution Time |
|---|---|---|---|
| Rising BBE, stable SES = 0 | OSNR degradation, amplifier aging, connector contamination | Low (trending) | Scheduled maintenance: 2-4 hours |
| Intermittent ES/SES bursts | Environmental factors, loose connectors, BER spikes | Medium | Diagnosis: 24-48 hours |
| High SES without UAS | Near-threshold OSNR, fiber nonlinearities, PMD events | High | Investigation: 4-8 hours |
| UAS events | Fiber cut, equipment failure, protection failure | Critical | Emergency repair: 4-18 hours |
10.2 Availability Calculations from UAS
Network availability is directly calculated from UAS data. For a system with 99.999% availability ("five nines"), the allowable downtime is approximately 5.3 minutes per year, which translates to 315 UAS per year or approximately 26 UAS per month.
Availability (%) = ((Total_seconds - UAS) / Total_seconds) × 100

For a 30-day period:
Total_seconds = 2,592,000

Five Nines (99.999%):
Max UAS = 2,592,000 × 0.00001 = 25.9 seconds/month

Four Nines (99.99%):
Max UAS = 2,592,000 × 0.0001 = 259.2 seconds/month| Availability Level | Max Downtime/Year | Max UAS/Month | Typical Application |
|---|---|---|---|
| 99.9% (three nines) | 8.77 hours | 2,592 | Enterprise WAN |
| 99.99% (four nines) | 52.6 minutes | 259 | Carrier backbone |
| 99.999% (five nines) | 5.26 minutes | 26 | Financial services, healthcare |
| 99.9999% (six nines) | 31.5 seconds | 2.6 | Submarine cables (design target) |
10.3 Use in SLA Compliance
Service-level agreements between operators and customers typically specify both availability targets (derived from UAS) and quality targets (derived from SESR and BBER). A well-structured SLA might specify: availability of 99.99%, SESR not to exceed 0.001, and BBER not to exceed 5 × 10⁻⁵. The OTN PM counters provide the raw data to assess compliance against each of these targets, making BBE, ES, SES, and UAS not merely technical metrics but business-critical instruments.
11. Summary
OTN error performance monitoring through BBE, ES, SES, and UAS provides a layered, time-domain view of path quality that goes far beyond simple BER measurement. These parameters, defined by ITU-T G.8201, form the foundation for: quantitative assessment of transmission quality, objective SLA compliance verification, proactive fault detection through trend analysis, and availability reporting that directly maps to business requirements.
The key relationships to remember are: an Errored Block (EB) is the atomic unit, an ES is any second containing at least one EB, an SES is a second where more than 15% of blocks are errored (or a defect is present), a BBE is any EB that occurs outside of an SES, and UAS begins after 10 consecutive SES with retroactive reclassification. These events feed into three normalized ratios — ESR, SESR, and BBER — that are compared against ITU-T objectives to determine path compliance.
For the optical networking professional, mastering these parameters means understanding not just the definitions, but the operational implications: what each alarm pattern means, how to trace rising BBE back to a degrading amplifier, and how to translate UAS data into availability percentages that satisfy SLA commitments. As OTN scales to 800G and beyond, these fundamental monitoring principles remain unchanged — the block sizes and thresholds may evolve, but the hierarchical error performance framework continues to serve as the industry's shared language for quantifying optical path quality.
References
- ITU-T Recommendation G.709 — Interfaces for the optical transport network.
- ITU-T Recommendation G.8201 — Error performance parameters and objectives for multi-operator international paths within optical transport networks.
- ITU-T Recommendation G.826 — End-to-end error performance parameters and objectives for international, constant bit-rate digital paths and connections.
- ITU-T Recommendation G.828 — Error performance parameters and objectives for international, constant bit rate synchronous digital paths.
- ITU-T Recommendation G.798 — Characteristics of optical transport network hierarchy equipment functional blocks.
- Sanjay Yadav, "Optical Network Communications: An Engineer's Perspective" — Bridge the Gap Between Theory and Practice in Optical Networking.
Developed by MapYourTech Team
For educational purposes in Optical Networking Communications Technologies
Note: This guide is based on industry standards, best practices, and real-world implementation experiences. Specific implementations may vary based on equipment vendors, network topology, and regulatory requirements. Always consult with qualified network engineers and follow vendor documentation for actual deployments.
Feedback Welcome: If you have any suggestions, corrections, or improvements to propose, please feel free to write to us at [email protected]

Optical Communications & Network Automation Expert | Author of 3 Books for Optical Engineers | Founder, MapYourTech
Optical networking engineer with nearly two decades of experience across DWDM, OTN, coherent optics, submarine systems, and cloud infrastructure. Founder of MapYourTech. Read full bio →
Follow on LinkedInRelated Articles on MapYourTech