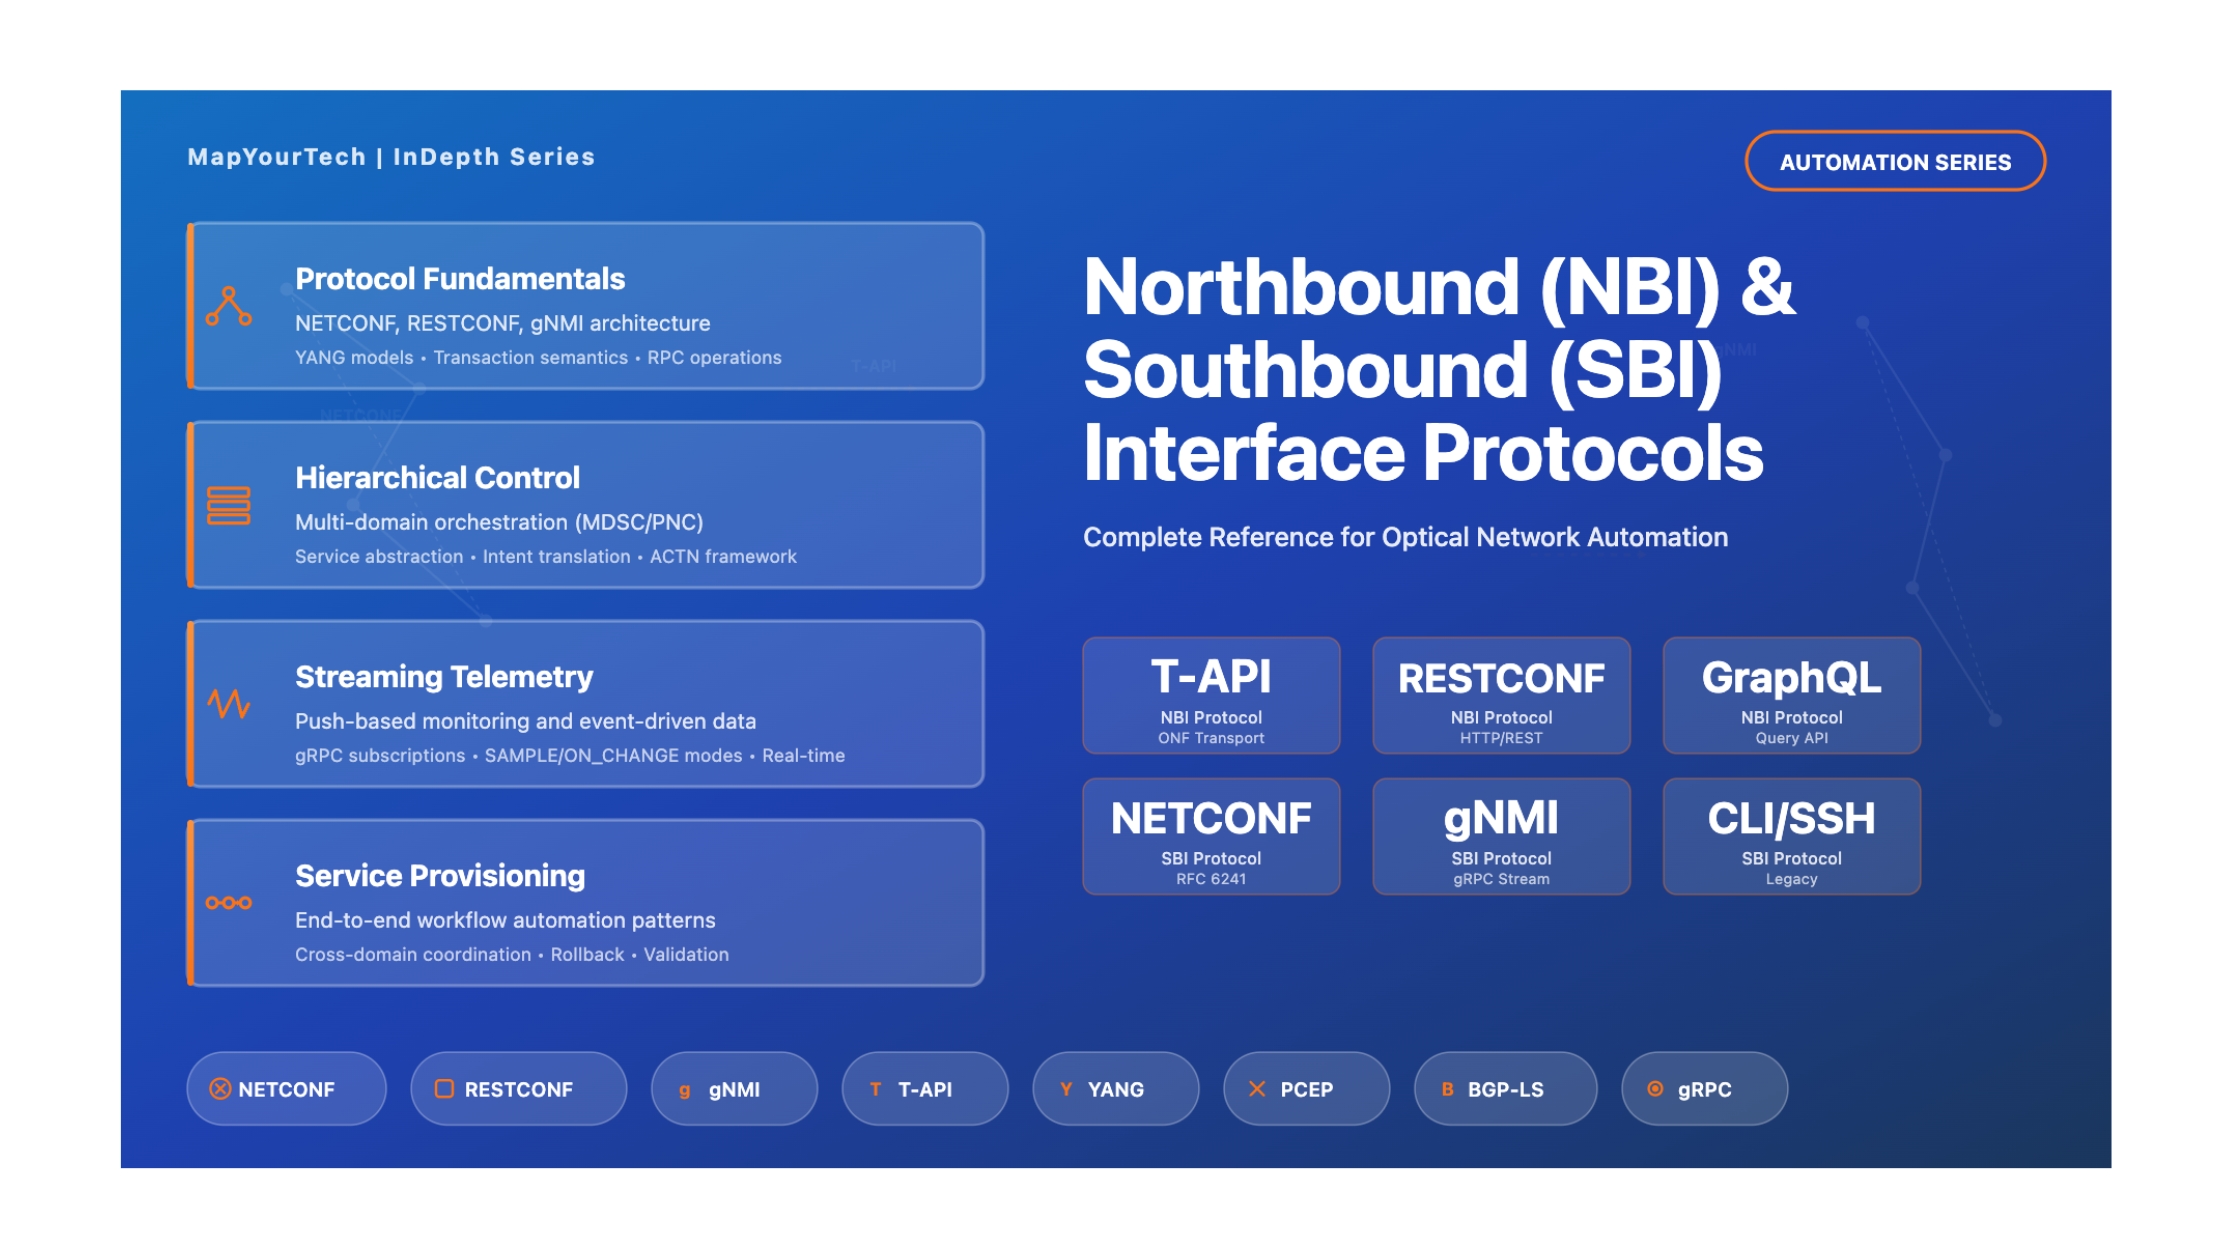

NBI and SBI Protocols at Different Layers
Foundation, Context & Core Concepts that helps you understand your Network Management
Introduction
Modern optical networks have undergone a fundamental transformation from manually configured, vendor-specific systems to programmable, automated infrastructures that enable rapid service deployment and dynamic resource optimization. At the heart of this evolution lies a critical architectural concept: the separation of network control planes through standardized interfaces. These interfaces, classified as Northbound Interfaces (NBI) and Southbound Interfaces (SBI), form the foundation of Software-Defined Networking (SDN) architectures in optical transport networks.
Understanding NBI and SBI protocols is essential for optical networking professionals engaged in network automation, multi-vendor integration, and service orchestration. These interfaces define how network controllers communicate upward with orchestration systems and downward with physical network elements, creating a programmable abstraction layer that decouples service intent from infrastructure implementation. The protocols operating at these interfaces—ranging from legacy management systems like TL1 and SNMP to modern model-driven frameworks like NETCONF with YANG data models—determine the capabilities, scalability, and interoperability of optical network automation systems.
The industry's migration toward disaggregated optical networks, where line systems, transponders, and control software originate from different vendors, has made standardized NBIs and SBIs not merely beneficial but essential. Operators deploying multi-vendor DWDM systems require common protocols that enable a single domain controller to manage heterogeneous equipment while exposing uniform service interfaces to higher-level orchestrators. This requirement has driven the convergence around open standards including ONF's Transport API (T-API) for northbound integration, NETCONF for southbound configuration management, and gNMI for streaming telemetry.
This comprehensive documentation covers the complete landscape of NBI and SBI protocols across different network layers, establishing the foundational knowledge necessary to understand why these interfaces exist, how they evolved from proprietary systems, and the core principles governing their operation. The hierarchical control plane architecture defined by frameworks such as IETF's ACTN (Abstraction and Control of Traffic Engineered Networks) and ONF's SDN architecture demonstrates how Multi-Domain Service Coordinators (MDSC), Provisioning Network Controllers (PNC), and network elements interact through standardized interfaces. Industry standards from ITU-T, IETF, ONF, and OIF define protocol requirements and interoperability specifications that enable modern optical network automation.
Complete Optical Network Management Protocol Stack
Historical Context and Evolution
The Era of Proprietary Network Management
Optical networking's first three decades were characterized by vertically integrated, vendor-specific management systems. From the SONET/SDH deployments of the 1990s through early DWDM systems of the 2000s, each equipment manufacturer provided proprietary Element Management Systems (EMS) that could only manage their own devices. These EMSs communicated with network elements using vendor-specific protocols, data models, and interfaces that precluded multi-vendor integration at the management layer.
The dominant management protocol during this era was Transaction Language 1 (TL1), developed by Bellcore in the 1980s for telecommunications network management. TL1 provided a standardized command syntax—a significant improvement over pure vendor CLIs—but suffered from fundamental limitations. While the command structure was consistent, the specific parameters, access identifiers, and capabilities varied substantially across vendors and even across product lines from the same manufacturer. A command to provision an optical cross-connect might require entirely different parameter sets on equipment from different vendors, necessitating vendor-specific mediation layers in any multi-vendor network.
Network Management Systems (NMS) attempted to provide a unified view across multiple vendor domains by integrating with individual EMSs. This integration typically occurred through CORBA (Common Object Request Broker Architecture), an object-oriented middleware that allowed distributed systems to communicate. CORBA-based interfaces between EMS and NMS required maintaining complex Interface Definition Language (IDL) files that mapped vendor-specific data models to standardized FCAPS (Fault, Configuration, Accounting, Performance, Security) functions. Any version mismatch between client and server CORBA implementations could break the integration, leading to significant operational challenges.
Simple Network Management Protocol (SNMP) provided another management avenue, particularly for basic fault monitoring and performance data collection. Defined in the late 1980s and standardized through multiple versions, SNMP used a hierarchical Management Information Base (MIB) structure to organize device data. However, SNMP's limitations became increasingly apparent as network complexity grew. The protocol's unreliable UDP transport, lack of transactional configuration support, and flat MIB structure made it unsuitable for the sophisticated configuration management required by modern optical networks. SNMP remained relevant primarily for monitoring and basic status polling, not for programmatic configuration.
Evolution Timeline: From Proprietary to Open Network Management
The Catalyst for Change: Software-Defined Networking
The introduction of Software-Defined Networking concepts in the late 2000s fundamentally challenged the proprietary management paradigm. Initially developed for data center networks, SDN proposed separating the network control plane from the data forwarding plane, centralizing intelligence in software controllers that could programmatically configure multiple network devices through standardized southbound interfaces. The OpenFlow protocol, introduced by researchers at Stanford University and subsequently championed by the Open Networking Foundation, demonstrated that network devices could be controlled through a common protocol independent of vendor implementations.
While OpenFlow gained initial traction in packet-switched networks, optical transport networks faced different challenges that required adapted approaches. Optical networks operate at multiple layers—photonic (Layer 0), OTN (Layer 1), and Ethernet (Layer 2)—with complex physical constraints including chromatic dispersion, polarization mode dispersion, and nonlinear impairments that must be managed through sophisticated signal processing. Simply applying OpenFlow's flow-based forwarding model to optical switching proved insufficient for the full complexity of optical network control.
The industry response came through standards development at multiple levels. The IETF's CCAMP (Common Control and Measurement Plane) working group developed extensions to routing protocols like OSPF and IS-IS to support optical network topology discovery and GMPLS (Generalized Multi-Protocol Label Switching) for signaling across optical networks. However, these distributed control plane protocols still required complementary centralized management and orchestration capabilities that could abstract multi-vendor complexity and provide unified service interfaces.
Emergence of Model-Driven Management
The breakthrough in optical network management came with the adoption of model-driven programmability. Rather than defining protocols in isolation, the industry converged on separating data modeling from transport protocols. YANG (Yet Another Next Generation), standardized by the IETF in RFC 6020, provided a hierarchical data modeling language that could define the structure, constraints, and relationships of network configuration and operational state in a vendor-neutral manner.
YANG fundamentally changed how network automation was approached. Instead of parsing unstructured CLI output or navigating flat SNMP MIBs, automation systems could interact with devices through structured, validated data models. A YANG model explicitly defines what configuration parameters exist, their data types, valid ranges, mandatory versus optional elements, and dependencies between parameters. This eliminates the ambiguity inherent in text-based interfaces and enables machine validation of configurations before they are applied to devices.
Complementing YANG, the NETCONF protocol (Network Configuration Protocol, RFC 6241) provided the transport mechanism for programmatic device management using YANG models. NETCONF introduced critical capabilities absent from earlier protocols: atomic transactions with candidate configuration validation, confirmed commit operations that automatically rollback if connectivity is lost, and fine-grained access control through NACM (NETCONF Access Control Model). These features made NETCONF suitable for automated configuration management at scale, where consistency and recoverability are essential.
The combination of YANG data modeling and NETCONF transport created the foundation for vendor-neutral device management. Industry consortiums, particularly the OpenConfig operator group, began developing common YANG models for optical transport equipment. The openconfig-terminal-device, openconfig-optical-amplifier, and related models defined standard abstractions for transponders, ROADMs, and amplifiers that worked across vendors supporting these models. Controllers using OpenConfig YANG models could manage multi-vendor optical equipment through a unified southbound interface, dramatically reducing the mediation layer complexity that plagued earlier systems.
Fundamental Concepts and Principles
Understanding Northbound and Southbound Interfaces
In network architecture terminology, "north" and "south" represent vertical relationships in a hierarchical control structure. Visualize the network infrastructure as positioned at the bottom of a diagram, with controllers above it, and orchestration systems at the top. Southbound interfaces point downward—from controllers toward the infrastructure—while northbound interfaces point upward—from controllers toward orchestrators and applications. This spatial metaphor provides an intuitive framework for understanding communication flows in SDN architectures.
A Southbound Interface (SBI) connects a controller to the network elements it manages. The SBI must provide sufficient expressiveness to configure all aspects of device behavior while abstracting vendor-specific implementation details to the extent possible. For optical networks, SBI protocols must handle complex parameters including wavelength assignments, modulation formats, forward error correction schemes, amplifier power levels, ROADM port configurations, and OTN framing structures. The protocol must support both configuration operations—setting desired state—and operational state retrieval—reading current measurements, alarm conditions, and performance metrics.
A Northbound Interface (NBI) connects a controller to higher-level systems—orchestrators, OSS/BSS platforms, or network applications. The NBI's primary purpose is abstraction: hiding the complexity of the underlying network infrastructure and exposing simplified, service-oriented interfaces. Rather than exposing individual device ports and configuration parameters, a properly designed NBI presents logical services like "create 100GE wavelength between Site A and Site B with 99.99% availability" or "retrieve topology of the optical network domain." This abstraction allows orchestrators to operate at the service level without needing detailed knowledge of the physical network implementation.
Key Principle: Abstraction Through Interface Separation
The fundamental value of NBI/SBI separation lies in creating abstraction boundaries that enable independent evolution of different system layers. Changes to the underlying network infrastructure—adding new equipment, upgrading device software, or replacing vendors—should not require modifications to orchestrator logic if the NBI contract remains stable. Similarly, changes to orchestrator requirements should be implementable through NBI extensions without requiring southbound protocol changes. This decoupling is essential for managing complexity in large-scale, multi-vendor networks.
Hierarchical SDN Control Architecture with NBI/SBI Interfaces
The Hierarchical Control Plane Architecture
Modern optical transport networks implement a hierarchical control architecture that separates concerns across multiple layers. At the foundation lies the Infrastructure Layer, comprising physical network elements including ROADMs, transponders, amplifiers, routers, and switches. These devices implement the data plane—the actual switching, routing, and transmission of traffic. Above the infrastructure sits the Control Layer, consisting of domain-specific controllers that manage technology segments. At the apex resides the Orchestration Layer, containing Multi-Domain Service Coordinators (MDSC) and OSS/BSS systems that orchestrate end-to-end services across multiple domains.
This three-tier architecture aligns with multiple industry frameworks. The IETF's ACTN (Abstraction and Control of Traffic Engineered Networks) architecture, defined in RFC 8453, specifies exactly this structure with Customer Network Controllers (CNC) at the top, MDSC in the middle, and Provisioning Network Controllers (PNC) managing individual technology domains. The ONF's SDN architecture for transport networks (TR-522) similarly defines application, control, and infrastructure layers with standardized interfaces between them. ITU-T's framework for service automation complements these architectures with its own terminology but equivalent structural principles.
The value of hierarchical separation becomes apparent when considering multi-vendor, multi-technology networks. An operator's network might include IP routers from one vendor, optical line systems from another, transponders from a third, and OTN switches from yet another. Each technology domain requires specialized management—optical systems need sophisticated impairment-aware routing, IP networks require BGP policy management, and OTN demands careful mapping and multiplexing control. Domain controllers (PNCs) encapsulate this technology-specific complexity, exposing simplified, abstracted interfaces upward through their NBIs.
The MDSC orchestrates across multiple domains by consuming their NBIs and presenting a unified multi-layer, multi-domain NBI to orchestration systems. When a service request arrives—for example, provisioning a 100GE connection between two data centers—the MDSC determines which domains must participate, computes an optimal multi-layer path, and issues provisioning commands to each relevant domain controller through their respective NBIs. Each domain controller then translates these abstract service requests into specific device configurations, pushing them to network elements through southbound interfaces.
Core Principles of Interface Design
Effective NBI and SBI design follows several fundamental principles that enable scalable, maintainable network automation. Understanding these principles helps engineers select appropriate protocols and design integration architectures that will remain robust as networks evolve.
Abstraction and Information Hiding: Interfaces should expose only the information necessary for the adjacent layer to perform its function while hiding implementation details. An NBI should present logical services and abstract topology, not raw device configurations. A controller requesting a wavelength from an optical domain controller doesn't need to know which specific ROADM ports will be configured or what modulation format the transponder will use—these are implementation details the domain controller should determine based on network state and policy. Proper abstraction prevents tight coupling between layers and allows independent evolution of implementations.
Declarative Rather Than Imperative: Modern interfaces favor declarative models where users specify desired state rather than imperative commands that specify how to achieve that state. A declarative interface for provisioning a connection describes the endpoints, bandwidth, and constraints, allowing the controller to determine the optimal path and configuration steps. This contrasts with imperative approaches where the orchestrator must specify exact device commands. Declarative interfaces enable controllers to apply sophisticated algorithms—traffic engineering, diversity routing, failure restoration—that would be complex to orchestrate through imperative commands.
Transaction Semantics and Atomicity: Network configuration changes often affect multiple devices that must remain synchronized. Interfaces should support transactional operations where a set of changes is applied atomically—either all succeed or all fail. NETCONF's candidate-commit model exemplifies this: configurations are staged in a candidate datastore, validated, and only committed to running configuration if all devices confirm successful application. This prevents partial configuration states that could leave the network in inconsistent, potentially broken conditions.
Bidirectional Information Flow: While the terms "northbound" and "southbound" imply directional communication, effective interfaces support bidirectional information flow. Southbound interfaces not only push configurations down but also pull telemetry, alarms, and operational state up. Northbound interfaces receive service requests downward and report events, topology changes, and performance data upward. Modern protocols like gNMI enable subscription-based streaming where devices push telemetry to controllers as data changes, rather than requiring continuous polling.
Versioning and Evolution: Interfaces must accommodate change over time as requirements evolve and capabilities expand. YANG's modularity and augmentation mechanisms allow data models to be extended without breaking existing implementations. A base YANG module defines core functionality that all implementations must support, while optional augmentations can add vendor-specific or advanced features. Clients can query a device's capabilities to discover which modules it supports, enabling graceful degradation when interacting with devices supporting different feature sets.
Protocol Stack: Data Models, Transport, and Encoding
Industry Standards and Frameworks
Standards Bodies and Their Roles
The development of NBI and SBI protocols involves multiple standards organizations, each contributing expertise in specific domains. Understanding their roles helps engineers navigate the standards landscape and evaluate which specifications apply to particular deployment scenarios.
The Internet Engineering Task Force (IETF) develops fundamental internet protocols including those used for network management and control. The NETCONF protocol (RFC 6241), RESTCONF (RFC 8040), and YANG data modeling language (RFC 7950) all originated from IETF working groups. The CCAMP (Common Control and Measurement Plane) working group focuses on traffic engineering and path computation, producing protocols like PCEP (Path Computation Element Protocol) and BGP-LS (BGP Link State) used for topology distribution. The TEAS (Traffic Engineering Architecture and Signaling) working group developed the ACTN framework and associated service models. IETF specifications undergo rigorous technical review and interoperability testing before advancing to Internet Standard status.
The International Telecommunication Union (ITU-T) addresses telecommunications-specific requirements through its study groups. Study Group 15 focuses on optical transport network standards, defining OTN frame structures, interfaces, and management requirements. Study Group 13 covers software-defined networks and future networks, developing recommendations for SDN architecture and network virtualization. ITU-T recommendations define management architectures including the Telecommunications Management Network (TMN) framework and newer SDN-oriented specifications. While IETF focuses on protocol mechanisms, ITU-T often emphasizes architectural frameworks and functional requirements that protocols must satisfy.
The Open Networking Foundation (ONF), an industry consortium, drives SDN standardization through specifications and reference implementations. The Transport API (T-API) defines standardized northbound interfaces for transport SDN controllers, enabling multi-vendor orchestration. ONF's OpenConfig project, initially developed by major network operators including Google and Microsoft, produces vendor-neutral YANG models for network devices. The OpenConfig approach prioritizes operational simplicity and multi-vendor consistency over complete feature coverage. ONF also sponsors open-source controller platforms including ONOS (Open Network Operating System) that implement T-API and other SDN interfaces.
The Optical Internetworking Forum (OIF) accelerates deployment of interoperable optical networking solutions through Implementation Agreements (IAs) and interoperability demonstrations. OIF's work includes specifications for optical physical layer interfaces, control plane protocols, and management interfaces. The organization conducts multi-vendor interoperability events where participants demonstrate standards-compliant implementations, validating that different vendors' equipment can successfully interoperate. OIF's Transport SDN framework document synthesizes requirements from multiple standards into practical deployment guidance.
The Metro Ethernet Forum (MEF) develops specifications for carrier Ethernet services and lifecycle service orchestration (LSO). MEF's LSO architecture defines reference points between different network and service layers, including interfaces between orchestrators, controllers, and infrastructure. The Sonata reference point covers inter-provider service automation, Presto addresses infrastructure management, and Cantata handles customer-to-provider interactions. MEF specifications complement ONF's T-API by adding service-layer semantics and business process integration.
Key Protocol Standards
Several protocol specifications have achieved broad industry adoption and form the foundation of modern optical network management. Understanding their capabilities, limitations, and appropriate use cases guides protocol selection for specific deployment requirements.
NETCONF (RFC 6241): The Network Configuration Protocol provides the primary southbound interface for device configuration in SDN optical networks. NETCONF operates over SSH (port 830), using XML encoding for data exchange. The protocol supports multiple datastores: candidate for staging configurations, running for active config, and startup for boot configurations. Operations include retrieving configuration and state data, editing configurations with merge/replace/delete semantics, copying configurations between datastores, and committing changes atomically. The confirmed-commit capability implements a safety mechanism where configurations automatically roll back after a timeout unless explicitly confirmed—critical for remote changes that might sever management connectivity. NETCONF's transaction semantics, combined with YANG data model validation, make it the preferred choice for configuration management requiring consistency guarantees.
RESTCONF (RFC 8040): RESTCONF provides HTTP-based access to YANG-modeled data, exposing the same data models as NETCONF through RESTful APIs. Operating over HTTPS (port 443), RESTCONF uses standard HTTP methods: GET retrieves data, POST creates resources, PUT replaces resources, PATCH modifies resources, and DELETE removes resources. Data can be encoded in JSON or XML, with JSON generally preferred for its conciseness and developer familiarity. RESTCONF URLs follow YANG model paths, enabling intuitive resource addressing. Unlike NETCONF's stateful sessions with explicit locking, RESTCONF operates statelessly—each request is independent. This simplifies load balancing and horizontal scaling but sacrifices multi-operation transaction semantics. RESTCONF suits web-based applications, simple CRUD operations, and environments where HTTP infrastructure is already deployed.
gNMI (gRPC Network Management Interface): Developed by the OpenConfig project, gNMI provides a unified protocol for both configuration and streaming telemetry. Built on gRPC (Google Remote Procedure Call), gNMI uses HTTP/2 for transport and Protocol Buffers for efficient binary encoding. The protocol defines three primary RPCs: Get retrieves snapshot data, Set modifies configuration, and Subscribe establishes telemetry streams. Subscribe supports multiple modes: ONCE returns a single snapshot, POLL updates on demand, STREAM provides continuous updates with ON_CHANGE (updates when values change) or SAMPLE (periodic sampling) sub-modes. gNMI's streaming capabilities make it ideal for high-frequency telemetry collection where SNMP's polling overhead becomes prohibitive. The compact Protocol Buffer encoding reduces bandwidth compared to XML/JSON, important for large-scale telemetry deployments. Organizations investing in OpenConfig YANG models often adopt gNMI for both configuration and telemetry due to the unified data model.
ONF T-API (Transport API): T-API defines standardized northbound interfaces for transport SDN controllers, enabling multi-domain orchestration and multi-vendor interoperability. The specification follows model-driven development: UML base models are automatically generated into YANG schemas and OpenAPI specifications. T-API 2.x provides core services including topology retrieval, connectivity service provisioning, path computation, OAM integration, and notification streaming. The Photonic Media Model (added in T-API 2.1) provides Layer 0/WDM support essential for optical networks. T-API uses resource abstractions including Node, Link, Service Interface Point (SIP), and Connection to represent network capabilities independent of vendor implementations. UUIDs ensure unique identification across federated domains. T-API complements rather than replaces device-level protocols—controllers use NETCONF/gNMI southbound while exposing T-API northbound to orchestrators.
| Protocol | Primary Use | Transport | Encoding | Key Strengths | Typical Interface |
|---|---|---|---|---|---|
| NETCONF | Device configuration | SSH (port 830) | XML | Transactions, candidate datastore, confirmed commit | Southbound (controller to NE) |
| RESTCONF | Web-friendly config | HTTPS (port 443) | JSON/XML | HTTP/REST integration, stateless, developer-friendly | Northbound/Southbound |
| gNMI | Config + Streaming telemetry | gRPC/HTTP/2 | Protocol Buffers | High-performance streaming, compact encoding, unified model | Southbound (controller to NE) |
| T-API | Multi-domain orchestration | RESTCONF/gRPC | JSON/YANG | Multi-vendor abstraction, service-oriented, standardized topology | Northbound (PNC to MDSC/OSS) |
| PCEP | Path computation | TCP (port 4189) | Binary TLV | Stateful path computation, LSP delegation, PCE-initiated paths | Controller to PCE |
| BGP-LS | Topology distribution | TCP (port 179) | BGP path attributes | Leverages BGP infrastructure, scales to large topologies | Network to controller |
YANG Data Model Families
YANG data models exist at different abstraction levels, serving distinct purposes in the network automation stack. Understanding these model families helps engineers select appropriate models for specific use cases and avoid mixing incompatible modeling approaches.
Device Models describe individual network element configuration and state at the device level. These models expose detailed platform capabilities including physical ports, logical interfaces, optical parameters, routing protocols, and hardware components. Device models subdivide into vendor-native models provided by equipment manufacturers and industry-standard models like OpenConfig. Vendor-native models expose full platform capability including proprietary features but require vendor-specific automation code. OpenConfig models prioritize multi-vendor consistency over complete feature coverage, defining common denominator functionality that works across vendors. Organizations typically use OpenConfig models where available, falling back to native models for advanced features not standardized in OpenConfig. Device models serve as the southbound data contract between controllers and network elements.
Network Models represent relationships between multiple network elements, abstracting device-level details to present logical network topology. T-API topology models exemplify this category, representing nodes, links, and connection endpoints without exposing individual device ports or internal cross-connects. Network models enable controllers to expose abstracted domain topology to orchestrators without revealing vendor-specific implementation details. These models typically define read-only views of discovered network state rather than configuration parameters, though they may include capacity reservations and service attachment points. Network models form the basis for multi-domain topology aggregation where an MDSC combines topology from multiple domain controllers into a unified view.
Service Models capture customer-facing service intent without specifying underlying network implementation. IETF's L3SM (L3VPN Service Model, RFC 8299) and L2SM (L2VPN Service Model, RFC 8466) exemplify this approach, defining VPN services through customer sites, routing requirements, and QoS parameters without mentioning specific device configurations. T-API's connectivity service model similarly describes desired connections through service endpoints, bandwidth, and constraints, leaving path computation and resource allocation to the controller. Service models enable operators to expose self-service portals where customers or internal service teams can request network services without networking expertise. The controller translates service model instances into device configurations, maintaining the mapping between service intent and infrastructure implementation.
YANG Model Abstraction Hierarchy
Basic Architecture Overview
Domain Controller (PNC) Functionality
The Provisioning Network Controller (PNC), also called a domain controller, manages a specific technology domain within the overall network architecture. A PNC might control all optical DWDM equipment in a metro region, all IP routers in a core network segment, or all OTN switches in a national backbone. The PNC abstracts the complexity of managing hundreds of individual network elements, providing a unified control point for the domain.
Southbound, the PNC connects to network elements using device-level protocols. For optical equipment, this typically means NETCONF with OpenConfig or vendor-native YANG models for configuration management and gNMI for streaming telemetry. Legacy equipment might require TL1 or proprietary protocols, necessitating protocol mediation within the PNC. The controller maintains a real-time topology model by discovering devices (manually provisioned or through protocols like LLDP), collecting link state information, and tracking resource availability. This topology model informs path computation algorithms that determine optimal routes through the domain considering constraints like available wavelengths, OSNR budgets, and diversity requirements.
Northbound, the PNC exposes abstracted interfaces to the MDSC or directly to orchestration systems. T-API typically provides this northbound abstraction for optical domains, presenting simplified topology (nodes and links without internal cross-connect details) and connectivity services (wavelength or Ethernet services) without exposing vendor-specific configuration parameters. The PNC translates incoming service requests into device-specific configurations, manages resource allocation to prevent conflicts, and reports service state and alarms upward through its NBI.
A well-designed PNC implements several critical functions beyond simple configuration proxy. Path computation considers physical constraints unique to optical networking—chromatic dispersion accumulation, available wavelengths across multi-hop paths, amplifier gain regions, and ROADM filtering constraints. Resource management tracks wavelength usage, port assignments, and bandwidth reservations, preventing over-subscription and ensuring service isolation. Service lifecycle management maintains the relationship between abstract service requests and concrete device configurations, enabling service modification and deletion without manual intervention. Fault management correlates device-level alarms into service-affecting conditions, filtering minor issues while escalating genuinely problematic events to the MDSC.
Multi-Domain Service Coordinator (MDSC) Functionality
The MDSC orchestrates services that span multiple technology domains or administrative boundaries. When a service request requires optical transport across three PNC domains plus IP routing, the MDSC coordinates provisioning across all four controllers, computing an end-to-end path that optimizes across multiple layers and domains.
The MDSC's topology management aggregates domain topologies received from multiple PNCs into a unified multi-domain, multi-layer view. This aggregated topology represents inter-domain links—connections between domains—and layer relationships—how IP routers connect to optical transponders, for example. Building this unified view requires reconciling different addressing schemes, matching abstract connectivity at domain boundaries, and tracking which PNC controls which network segments.
End-to-end path computation presents significant algorithmic challenges. The MDSC must determine which domains participate in a service path, select appropriate layers for different path segments (should traffic go over optical wavelengths or IP routers?), and sequence provisioning operations across domains to avoid race conditions or partial provisioning. For paths requiring diversity—primary and backup paths that don't share failure modes—the MDSC computes node-disjoint or link-disjoint paths across the multi-domain topology. Constraint satisfaction might require iterative computation if initial path attempts fail due to resource unavailability in one domain.
The MDSC orchestrates provisioning by issuing service requests to relevant PNCs through their NBIs (typically T-API). For a multi-domain wavelength service, the MDSC requests connectivity services from each optical domain PNC along the path, ensuring endpoints align at domain boundaries. It monitors provisioning progress, detecting failures and potentially triggering rollback if services cannot be established completely. Once established, the MDSC maintains the service lifecycle, handling modification requests, monitoring service health based on PNC-reported status, and orchestrating deletion when services terminate.
Service Provisioning Flow Through Hierarchical Architecture
Simple Deployment Models
Understanding how NBI/SBI protocols deploy in practical network scenarios helps engineers design integration architectures suited to their operational requirements. Several common deployment patterns have emerged, each addressing different scale, complexity, and interoperability needs.
Single Domain with Unified Controller: The simplest deployment involves a single technology domain—for example, a metro optical network from one vendor—managed by a domain controller. The controller connects southbound to network elements via NETCONF, providing transactional configuration management and retrieving operational state. Northbound, the controller exposes T-API to an orchestration system or OSS. This architecture provides abstraction benefits—the orchestrator operates on services rather than device configurations—while maintaining manageability with a single controller. Organizations often start with this model when initially adopting SDN, gaining experience with model-driven interfaces before tackling multi-domain complexity.
Multi-Domain with MDSC: As networks span multiple technology domains or geographic regions, a hierarchical architecture becomes necessary. An MDSC sits above multiple domain controllers, each managing its domain (optical metro, optical long-haul, IP core, etc.). The MDSC consumes T-API NBIs from each PNC, building a unified topology view and orchestrating multi-domain services. This model enables end-to-end service provisioning across vendor and technology boundaries. For example, a 100GE service might require optical wavelengths across three optical domains plus IP routing in a core network—the MDSC coordinates all four controllers to establish the complete service path.
Hybrid with Legacy Integration: Most production networks include legacy equipment that predates modern SDN protocols. A practical deployment architecture incorporates protocol mediation to bridge legacy and modern systems. Domain controllers implement adapters or mediation layers that translate between modern NBIs (T-API) and legacy SBIs (TL1, SNMP, proprietary protocols). This allows gradual migration—new equipment deployed with NETCONF/gNMI support while legacy systems remain accessible through mediation. The controller abstracts these differences, presenting a uniform NBI regardless of underlying device protocols. Over time, as legacy equipment cycles out, the mediation layer shrinks until the network operates entirely on modern protocols.
Disaggregated with Open Line Systems: Open optical networks disaggregate transponders from line systems, purchasing coherent pluggables and ROADMs from different vendors. This architecture requires careful interface definition: Who controls the transponders? How do optical controllers manage wavelength assignments across multi-vendor line systems? One common approach has the IP/optical controller (managing routers with pluggable optics) control transponder configuration while the optical line system controller manages ROADMs and amplifiers. The two controllers coordinate via their NBIs, with the MDSC determining wavelength assignments and notifying both controllers. This division of responsibility requires clear interface contracts to avoid conflicts and ensure end-to-end service activation.
Detailed System Architecture
Layer-by-Layer Protocol Stack Breakdown
Modern optical network management protocols operate through carefully orchestrated layers, each providing specific functionality while building upon the layer beneath. Understanding this layered architecture enables engineers to troubleshoot protocol issues, optimize performance, and design resilient automation systems. The protocol stack typically comprises five distinct layers: the transport layer providing secure connectivity, the encoding layer serializing data structures, the operations layer defining command semantics, the data model layer specifying information structure, and the application layer implementing business logic.
The transport layer establishes the fundamental communication channel between management clients and network devices. For NETCONF, this layer almost exclusively uses SSH (Secure Shell) operating on TCP port 830, providing both encryption and authentication. The SSH connection employs standard cryptographic algorithms—typically RSA or ECDSA for key exchange, AES for symmetric encryption, and HMAC-SHA2 for integrity verification. RESTCONF operates over HTTPS (HTTP over TLS) on port 443, leveraging the same TLS cryptographic mechanisms used throughout the web. The gNMI protocol uses gRPC, which itself runs over HTTP/2 with TLS, providing bidirectional streaming capabilities not available in traditional HTTP/1.1. This transport diversity reflects different protocol design philosophies: NETCONF prioritizes dedicated management sessions, RESTCONF emphasizes web integration, and gNMI optimizes for high-frequency telemetry streaming.
Above the transport layer sits the encoding layer, responsible for serializing structured data into byte streams for transmission. NETCONF exclusively uses XML (eXtensible Markup Language), representing configuration and operational data as hierarchical element trees with attributes and text content. XML's verbosity—opening and closing tags, namespace declarations, whitespace—makes it human-readable but bandwidth-intensive. A simple interface configuration might require several hundred bytes of XML encoding. RESTCONF supports both XML and JSON (JavaScript Object Notation) encoding, with JSON becoming overwhelmingly preferred due to its compactness and developer familiarity. The same interface configuration encoded in JSON typically consumes 30-50% fewer bytes than the XML equivalent. The gNMI protocol uses Protocol Buffers (protobuf), a binary encoding scheme developed by Google that achieves compression ratios 3-10x better than XML while maintaining strong typing and schema evolution capabilities. Protobuf's efficiency becomes critical when streaming telemetry at sub-second intervals across thousands of data paths.
Complete Protocol Stack: Transport Through Application Layers
Component Interactions and Data Flows
Protocol communication involves complex interactions between multiple software components, each implementing specific functionality within the overall management architecture. On the client side, management applications maintain session state, construct protocol messages, handle responses, and implement error recovery. These clients range from simple command-line utilities for manual configuration to sophisticated SDN controllers managing thousands of devices. The client-side protocol library abstracts transport-level details, providing higher-level APIs that application code invokes—for example, a NETCONF library might offer a `get_config(datastore='running', filter=xpath)` method that internally constructs the appropriate XML RPC message, transmits it over SSH, parses the response, and returns structured data to the caller.
On the device side, protocol servers accept incoming connections, authenticate clients, process received operations, interact with the device's internal configuration database, and generate responses. The server architecture typically separates the protocol handling layer from the device-specific implementation layer through well-defined internal APIs. When a NETCONF server receives an edit-config operation, it validates the XML against the advertised YANG models, translates the generic configuration data into device-specific internal representations, invokes the appropriate device driver functions to apply changes, and constructs an XML response indicating success or describing any errors encountered. This separation allows vendors to implement standard protocol interfaces while maintaining proprietary internal architectures.
Data flows through these systems follow predictable patterns that vary by protocol and operation type. Configuration operations typically involve request-response cycles: the client sends a request message, the server processes it and modifies device state if appropriate, and then returns a response message indicating success or failure. Telemetry operations invert this pattern in modern streaming protocols—the client establishes a subscription specifying which data to monitor and how frequently, and the server subsequently pushes data updates to the client as events occur or sampling intervals expire. This push model eliminates the polling overhead that plagued earlier management protocols, where clients repeatedly queried devices for updated information even when values hadn't changed.
Core Components Deep Dive
NETCONF Protocol Operations and Transaction Model
NETCONF's power derives from its sophisticated transaction model built around multiple datastores and atomic operations. The protocol defines three standard datastores: the running datastore contains the currently active configuration determining device behavior, the candidate datastore holds staged configuration changes not yet applied, and the startup datastore specifies the configuration loaded when the device boots. Additional vendor-specific datastores may exist for purposes like configuration validation or rollback snapshots. This separation enables safe configuration workflows where operators stage complex changes, validate them completely, and only then commit them atomically to the running configuration.
The transaction workflow typically follows a five-step sequence. First, the client locks the candidate datastore using the lock operation, preventing other clients from making concurrent modifications. Second, the client issues one or more edit-config operations to modify the candidate configuration, specifying whether each change should merge with existing configuration, replace it entirely, or create new elements. Third, the client optionally validates the candidate configuration using the validate operation, which checks for syntactic correctness, semantic consistency, and constraint satisfaction without actually applying changes. Fourth, the client commits the candidate configuration to running using the commit operation, which either succeeds completely or fails completely, rolling back all changes on any error. Finally, the client unlocks the candidate datastore, allowing other clients to access it.
NETCONF Transaction Workflow: Candidate Datastore Pattern
The confirmed commit mechanism extends this transaction model with a critical safety feature for remote management. When issuing a commit with the confirmed attribute and a timeout value, the device applies the configuration changes but simultaneously starts a countdown timer. If the client doesn't send a second, non-confirmed commit before the timeout expires, the device automatically reverts to the previous configuration. This prevents a common failure scenario: an engineer makes a configuration change that inadvertently breaks network connectivity to the device, leaving it inaccessible with the broken configuration active. With confirmed commit, the device would automatically roll back after the timeout, restoring connectivity.
RESTCONF HTTP Semantics and Stateless Operations
RESTCONF deliberately adopts HTTP semantics to integrate network management with web-based tooling and development practices. The protocol maps CRUD (Create, Read, Update, Delete) operations onto standard HTTP methods, enabling any HTTP client library to interact with network devices without specialized protocol knowledge. This design makes RESTCONF particularly accessible to developers familiar with web services but less experienced with telecommunications-specific protocols like NETCONF.
The HTTP method mapping follows RESTful principles where different methods indicate different operation semantics. GET retrieves resources without modifying server state, making it safe and idempotent—multiple identical GET requests produce the same result. POST creates new resources, with the server typically assigning the resource identifier. PUT creates or completely replaces resources at a client-specified URI, making it idempotent since repeated identical PUT requests produce the same final state. PATCH partially modifies existing resources by merging supplied data with current content, supporting incremental updates without requiring the client to retrieve and re-send the entire resource. DELETE removes resources, also providing idempotent semantics since deleting a non-existent resource typically succeeds as a no-op.
RESTCONF HTTP Operations: Resource-Oriented Interface Pattern
Unlike NETCONF's stateful sessions with explicit locking, RESTCONF operates statelessly—each HTTP request contains all information necessary for the server to process it, and the server doesn't maintain session context between requests. This simplifies horizontal scaling since any server instance can handle any request without requiring session affinity, and it eliminates the session management complexity that plagued earlier protocols. However, statelessness comes at the cost of transactional capabilities—RESTCONF lacks NETCONF's candidate datastore and multi-operation transactions. Each HTTP request represents an atomic operation that either succeeds or fails independently. For workflows requiring coordination across multiple configuration changes, applications must implement their own validation and rollback logic rather than relying on protocol-level transaction support.
RESTCONF URL paths directly map to YANG model structures, creating an intuitive resource hierarchy. The base path `/restconf/data/` provides access to the device's data resources, with subsequent path segments corresponding to YANG module names, container names, and list keys. For example, `/restconf/data/ietf-interfaces:interfaces/interface=GigabitEthernet0/1` addresses a specific interface resource, where `ietf-interfaces:interfaces` references the interfaces container in the IETF interfaces YANG model, `interface` specifies the interface list, and `GigabitEthernet0/1` provides the list key value identifying which interface. Query parameters modify request behavior—`depth` limits how many levels of the data hierarchy to include, `fields` filters to specific leaf nodes, and `content` specifies whether to return configuration data, operational state, or both.
gNMI Streaming Telemetry and Subscription Modes
The gNMI protocol represents a fundamental shift in network monitoring philosophy, moving from poll-based data collection to push-based streaming. Traditional SNMP monitoring requires management systems to repeatedly query devices for updated values, consuming device CPU cycles to process each poll and generating network traffic even when monitored values haven't changed. At scale—thousands of devices, millions of OIDs, sub-minute polling intervals—this overhead becomes prohibitive. The gNMI Subscribe RPC inverts this model: clients establish subscriptions specifying which data paths to monitor, and devices autonomously stream updates as events occur or sampling intervals expire.
gNMI defines three subscription modes optimizing for different monitoring scenarios. ONCE mode returns a single snapshot of requested data paths and then closes the subscription, functioning similarly to a traditional read operation but using the streaming infrastructure. This mode suits scenarios where applications need current values without ongoing monitoring—for example, populating a configuration UI or validating device state during troubleshooting. POLL mode keeps the subscription open but only transmits data when the client explicitly sends a Poll message, giving applications fine-grained control over when updates occur. This proves useful when monitoring needs aren't continuous but rather event-driven—perhaps triggered by user actions or external system events.
gNMI Subscription Modes: Push-Based Telemetry Streaming
STREAM mode provides continuous monitoring with two sub-modes optimizing for different data characteristics. SAMPLE sub-mode transmits values at regular intervals specified by the client—for example, every 5 seconds or 30 seconds. This suits monitoring continuously-varying analog values like optical power levels, OSNR measurements, or temperature readings where applications need regular updates regardless of whether significant changes occurred. ON_CHANGE sub-mode only transmits when monitored values change, dramatically reducing bandwidth and processing overhead for digital state data like interface administrative status, alarm conditions, or boolean flags that spend long periods static. A device monitoring thousands of interfaces might receive ON_CHANGE updates only when links actually go up or down, rather than polling all interfaces every few seconds to detect the rare state transition.
Implementation efficiency becomes critical at hyperscale. A network with 10,000 optical transport devices, each reporting 100 telemetry paths at 10-second intervals, generates 100 million updates per second. Protocol Buffer encoding typically compresses each update to 50-200 bytes compared to 200-1000 bytes for equivalent XML or JSON representations, reducing aggregate bandwidth by 5-10x. HTTP/2 multiplexing allows a single TCP connection to carry hundreds of concurrent subscription streams without the connection setup overhead that would plague protocols requiring separate connections per subscription. Production deployments have demonstrated sustained collection rates exceeding 4,000 messages per second per device with end-to-end latencies under 50 milliseconds.
Protocol Stack and Communication Patterns
YANG Data Modeling: Structure, Constraints, and Augmentation
YANG (Yet Another Next Generation) provides the schema language defining the structure, semantics, and constraints of data exchanged through NETCONF, RESTCONF, and gNMI. Understanding YANG's modeling constructs enables engineers to navigate device capabilities, construct valid configurations, and interpret operational state data. YANG models consist of hierarchical statements organized into modules and submodules, with each module representing a cohesive set of related definitions. The module header declares the module name, namespace URI, and version, establishing a unique identity for the data structures defined within.
YANG defines several fundamental statement types that combine to create complete data models. Container statements create interior nodes in the data tree, grouping related data elements without themselves holding values. Leaf statements define individual data values with specific types—integers, strings, booleans, IP addresses, MAC addresses, or derived types with additional constraints. Leaf-list statements represent arrays of values sharing a common type, useful for modeling things like DNS server lists or VLAN tag lists where order matters and values may repeat. List statements define sequences of entries identified by key values, modeling concepts like interface tables, routing table entries, or DWDM channel assignments where each entry has a unique key and multiple attributes.
Type definitions in YANG range from built-in primitives to sophisticated derived types with complex constraints. The int8, int16, int32, and int64 types represent signed integers of varying sizes, while uint8, uint16, uint32, and uint64 provide unsigned variants. The string type models textual data with optional length and pattern constraints specified through regular expressions. The boolean type represents true/false values. Enumeration types define finite sets of named values—for example, an interface operational status might enumerate "up", "down", "testing", "unknown", "dormant", "not-present", and "lower-layer-down". Union types allow multiple alternative types for a single leaf, enabling schemas where a value might be either an IP address or a domain name. Derived types build upon base types, adding semantic meaning and additional constraints—an ipv4-address type derives from string but adds pattern validation ensuring the string matches IPv4 dotted-decimal notation.
YANG Model Structure: Hierarchical Data Organization
YANG's augmentation mechanism enables incremental model extension without modifying original definitions. Organizations can define base models capturing common functionality, then augment them with technology-specific or vendor-specific extensions. For example, the IETF ietf-interfaces model defines generic interface characteristics applicable across all interface types. Optical equipment vendors augment this base model, adding optical-specific parameters like wavelength, transmit power, receive power, OSNR, chromatic dispersion, and modulation format. These augmentations integrate seamlessly into the base hierarchy—clients see a unified data tree where optical parameters appear as natural extensions of generic interface data. This pattern enables multi-vendor interoperability: controllers use standard IETF models for common operations and vendor augmentations for equipment-specific capabilities, gracefully handling devices that support different feature sets.
Mathematical Models and Analysis
Optical Path Computation and Link Budget Analysis
Optical network controllers must compute feasible paths considering physical layer constraints absent from traditional IP routing. An IP router selects paths based primarily on metrics like hop count or IGP weights, assuming all links can successfully forward packets if operationally up. Optical network path computation requires validating that proposed wavelength paths will achieve sufficient signal quality at the receiver after traversing amplifiers, fiber spans, ROADMs, and other optical elements. This Quality of Transmission (QoT) estimation involves complex mathematical models accounting for signal impairments that accumulate along the optical path.
The fundamental quantity determining optical signal quality is the Optical Signal-to-Noise Ratio (OSNR), measuring the ratio of signal power to optical noise power within a reference bandwidth. OSNR degrades as signals traverse optical networks due to amplified spontaneous emission (ASE) noise added by Erbium-Doped Fiber Amplifiers (EDFAs) and losses in passive components. Computing end-to-end OSNR requires summing noise contributions from each amplifier and accounting for signal attenuation through fiber spans and optical elements. The OSNR at the receiver must exceed a threshold determined by the modulation format—typically 15-18 dB for QPSK, 20-23 dB for 16-QAM, and higher for more spectrally-efficient formats.
Optical Signal-to-Noise Ratio (OSNR) Calculation
OSNR represents the ratio of signal power to noise power, determining maximum achievable BER.
OSNR[dB] = 10 × log₁₀(Psignal / Pnoise)

End-to-end OSNR accounting for multiple amplifiers:

OSNRtotal = Plaunch / (∑ᵢ NASE,i)

Where:
  Plaunch = Launch power at transmitter (typically -2 to +2 dBm)
  NASE,i = ASE noise from amplifier i

ASE Noise per amplifier:
NASE = 2 × nsp × h × ν × Bref × (G - 1)

Where:
  nsp = Spontaneous emission factor (1.5-2.5 typical)
  h = Planck's constant (6.626 × 10⁻³⁴ J·s)
  ν = Optical frequency (≈193 THz for C-band)
  Bref = Reference bandwidth (12.5 GHz standard)
  G = Amplifier gain (linear, not dB)

Minimum Required OSNR by Modulation Format:
  QPSK (100G):     15-18 dB
  16-QAM (200G):   20-23 dB
  64-QAM (400G):   27-30 dB
Chromatic dispersion (CD) represents another critical impairment that controllers must account for. Different wavelengths of light propagate at slightly different velocities through optical fiber, causing pulse broadening that limits achievable transmission distances. Standard single-mode fiber exhibits approximately 17 picoseconds of dispersion per nanometer of spectral width per kilometer of fiber—a 100 GHz channel (≈0.8 nm) traversing 1000 km accumulates roughly 13,600 ps/nm of chromatic dispersion. Digital Signal Processors in coherent transceivers compensate for chromatic dispersion up to device-specific limits, typically 60,000-120,000 ps/nm for modern 400G transceivers. Path computation algorithms must verify that total accumulated CD along proposed paths remains within transceiver compensation range.
Chromatic Dispersion Accumulation
CD causes pulse broadening due to wavelength-dependent propagation velocity.
CDtotal = ∑ᵢ Di × Li

Where:
  Di = Dispersion coefficient of fiber segment i (ps/nm·km)
  Li = Length of fiber segment i (km)

Standard fiber types:
  SSMF (G.652): D ≈ 17 ps/nm·km @ 1550nm
  LEAF (G.655): D ≈ 4 ps/nm·km @ 1550nm
  DCF (Dispersion Compensating): D ≈ -80 to -120 ps/nm·km

Example: 800km SSMF fiber
CDtotal = 17 ps/nm·km × 800 km = 13,600 ps/nm

Transceiver CD Tolerance:
  100G QPSK:  ±60,000 ps/nm typical
  400G 16QAM: ±80,000 ps/nm typical
  800G 64QAM: ±120,000 ps/nm (requires advanced DSP)

Path Feasibility Check:
|CDtotal| ≤ CDtolerance
Controller path computation algorithms integrate these physical layer models into constraint-based routing. When computing a path for a new wavelength service, the controller first identifies candidate paths through the topology based on connectivity and capacity availability. For each candidate path, it accumulates OSNR degradation, chromatic dispersion, polarization mode dispersion, and nonlinear effects. Paths failing to meet minimum OSNR requirements or exceeding transceiver compensation limits are rejected. Among remaining feasible paths, the controller selects based on optimization criteria—perhaps minimizing hop count, balancing load across fibers, or maximizing margin against quality thresholds. This computation may execute in real-time for interactive service provisioning or run periodically to validate network capacity and identify degraded links before they impact services.
Controller Performance Optimization and Scalability Analysis
SDN controllers managing large-scale optical networks must handle substantial computational loads while maintaining responsive operation. A controller managing 1000 ROADMs and 5000 transponders might maintain topology information for 15,000+ network elements, process 50,000+ telemetry updates per second, and respond to service provisioning requests targeting sub-second completion times. Achieving this performance requires careful architectural choices around data structure selection, algorithm optimization, and distributed processing strategies.
Topology representation significantly impacts path computation performance. Storing network topology as an adjacency list—where each node maintains a list of neighboring nodes and link attributes—enables efficient graph traversal for algorithms like Dijkstra's shortest path. However, querying whether a specific link exists between arbitrary nodes requires linear search through the adjacency list. An adjacency matrix using a two-dimensional array indexed by source and destination node provides O(1) link existence checks but consumes memory proportional to the square of node count, becoming prohibitive for networks exceeding several thousand nodes. Production controllers typically employ hybrid approaches: adjacency lists for core topology with hash maps providing O(1) average-case lookups for specific link queries.
Path Computation Complexity Analysis
Analyzing algorithmic complexity for constrained shortest path computation.
Dijkstra's Algorithm Complexity (unconstrained):
Tdijkstra = O(|E| + |V| × log|V|)

Where:
  |V| = Number of vertices (network nodes)
  |E| = Number of edges (optical links)
  Using Fibonacci heap priority queue

Constrained Shortest Path (CSP) with QoT validation:
TCSP = O(k × |E| × Tconstraint)

Where:
  k = Number of candidate paths explored (typically 3-10)
  Tconstraint = Constraint checking time per path

QoT Constraint Checking:
TQoT = O(nhops × c)

Where:
  nhops = Number of hops in path
  c = Constant time for OSNR/CD calculation per hop

Example: 500-node optical network
|V| = 500 nodes
|E| ≈ 2000 links (average degree 4)
Average path = 8 hops

Unconstrained path: T ≈ 2000 + 500×log(500) ≈ 6,500 operations
Constrained path:   T ≈ 5 paths × 16 links × 8 hops = 640 validations

Scalability Target:
Target: <100ms path computation latency
Requires: ~100,000 operations/sec capability
Parallelization strategies enable controllers to leverage multi-core processors and distribute load across server clusters. Path computation naturally parallelizes since computing k-shortest paths between source and destination can execute concurrently with minimal inter-thread communication. Telemetry processing pipelines benefit from streaming architectures where collection, parsing, validation, and database insertion stages operate in parallel on different CPU cores. The Kafka message bus, commonly used in production telemetry architectures, implements parallel consumption through partitioning—multiple consumer instances simultaneously process different subsets of the telemetry stream, achieving horizontal scalability limited primarily by partition count rather than single-threaded processing capacity.
Advanced Design Patterns and Implementation Strategies
Multi-Protocol Integration Architecture
Production optical network automation systems rarely rely exclusively on a single protocol but rather integrate multiple protocols serving complementary roles. A typical architecture might use NETCONF for transactional device configuration, gNMI for streaming telemetry, RESTCONF for northbound API exposure to web-based portals, T-API for multi-domain orchestration, PCEP for dynamic path computation in MPLS/SR networks, and BGP-LS for topology information distribution. Integrating these protocols coherently requires careful architectural design ensuring data consistency, avoiding redundant communication, and managing protocol-specific limitations.
The mediator pattern provides one effective integration approach. A controller core maintains canonical internal representations of network topology, device configuration, and operational state, with protocol-specific adapter modules translating between internal representations and external protocol messages. The NETCONF adapter converts internal configuration change requests into XML-encoded edit-config operations and translates received notifications into internal event objects. The gNMI adapter establishes subscriptions based on internal monitoring requirements and streams received updates into the controller's telemetry database. The RESTCONF adapter exposes internal data models through HTTP endpoints, converting REST requests into internal API calls and formatting responses as JSON or XML. This separation keeps protocol-specific complexity isolated in adapters while allowing the controller core to operate protocol-agnostically.
Multi-Protocol Controller Architecture with Adapter Pattern
Error Handling and Retry Strategies
Robust automation systems implement sophisticated error handling acknowledging that failures occur regularly in large-scale networks. Network devices reboot during software upgrades, fiber cuts temporarily partition networks, transient congestion drops packets, and device bugs cause intermittent protocol failures. Controllers must detect these failures, classify their severity and likely duration, and implement appropriate recovery strategies—immediate retry, delayed retry with exponential backoff, circuit breaker patterns temporarily suspending operations to failing devices, or escalating to human operators for manual intervention.
NETCONF's confirmed commit mechanism provides protocol-level safety for configuration changes that might break connectivity. When issuing a commit with a timeout, the device activates the new configuration but starts a countdown. If the controller doesn't send a confirmation commit before the timeout expires, the device automatically rolls back to the previous configuration. This prevents scenarios where configuration errors render devices unreachable—even if the controller loses connectivity, the device recovers automatically. Controllers using this mechanism attempt to validate connectivity after applying configuration (perhaps by querying device status), sending the confirmation commit only if validation succeeds.
Idempotent operations simplify retry logic by ensuring that repeating an operation produces the same result as executing it once. PUT operations in RESTCONF and merge operations in NETCONF exhibit this property—sending the same configuration multiple times leaves the device in the same final state regardless of how many times the operation executed. This allows controllers to retry operations without complex state tracking: if uncertain whether a configuration succeeded (perhaps due to a timeout), the controller can simply retry the operation, confident that duplicate execution won't cause problems. Non-idempotent operations like POST (creating new resources) require more careful handling, often involving query operations to check whether the resource already exists before retrying creation.
Testing and Validation Methodologies
Validating controller implementations requires multi-layered testing addressing unit functionality, protocol conformance, performance under load, and end-to-end service provisioning. Unit tests verify individual functions and methods in isolation—for example, testing that a YANG XML parser correctly handles all valid syntax variations and properly rejects invalid documents. Integration tests validate interactions between subsystems—perhaps verifying that the configuration manager correctly invokes the NETCONF adapter and updates the topology database when device configurations change. System tests exercise complete workflows through the controller and actual devices or high-fidelity simulators, provisioning services end-to-end and verifying correct device configuration and operational state.
Protocol conformance testing validates that controller protocol implementations adhere to specifications. For NETCONF, test suites verify correct handling of capabilities negotiation, datastore locking semantics, edit-config operation variants (merge, replace, create, delete), transaction rollback on errors, and notification delivery. Interoperability testing exercises controllers against devices from multiple vendors, exposing vendor-specific interpretations of protocol specifications or YANG models that might cause failures despite both parties claiming standards compliance. Organizations like the OIF (Optical Internetworking Forum) conduct multi-vendor interoperability demonstrations where participants validate that their implementations successfully communicate, identifying issues before production deployment.
Performance testing characterizes controller behavior under load representative of production environments. Load generators simulate thousands of devices establishing NETCONF sessions, subscribing to gNMI telemetry streams, and processing configuration operations, measuring controller throughput, latency distributions, resource utilization, and identifying bottlenecks. Soak testing runs these loads continuously for extended periods (hours to days) to expose memory leaks, resource exhaustion, or performance degradation over time. Chaos engineering intentionally introduces failures—killing processes, dropping packets, disconnecting devices—validating that controllers recover gracefully rather than entering error states requiring manual intervention.
T-API and Multi-Domain Service Orchestration
Transport API Architecture and Services
The Open Networking Foundation's Transport API (T-API) provides the standardized northbound interface enabling multi-domain service orchestration in optical transport networks. Unlike device-oriented protocols like NETCONF that expose equipment-specific configuration parameters, T-API operates at a higher abstraction level, defining services and resources through technology-agnostic models. This abstraction allows orchestrators and OSS systems to request connectivity services—"provision 100GE from Location A to Location B with 10ms latency"—without understanding the underlying optical infrastructure details like wavelength assignments, ROADM port configurations, or modulation formats.
T-API organizes functionality into distinct service groups, each addressing specific orchestration requirements. The Topology Service exposes abstract network topology, representing domains as collections of nodes connected by links without revealing vendor-specific internal structures. The Connectivity Service handles end-to-end connection provisioning, accepting service requests specifying endpoints and constraints while returning service identifiers tracking connection lifecycle. The Path Computation Service enables constrained path queries where orchestrators can request feasible paths between points considering bandwidth, latency, diversity, or other constraints. The OAM Service manages monitoring and diagnostics, including loopback testing and performance measurement. The Notification Service provides event streaming, informing subscribers about topology changes, alarm conditions, and service state transitions.
T-API Service Architecture: Northbound Orchestration Interface
T-API's data model employs a layered structure representing networks at multiple levels of abstraction. At the foundation, the Photonic Media Layer represents the physical wavelength infrastructure—fibers, wavelengths, amplifiers, and optical power management. The OTN Layer models digital wrapper framing including ODU multiplexing, overhead management, and forward error correction. The Ethernet Layer abstracts packet forwarding, VLAN tagging, and quality of service. This multi-layer modeling enables controllers to optimize service placement—perhaps placing a 10GE service directly over an Ethernet interface for local connectivity but using ODU framing for long-haul transport requiring enhanced monitoring and protection.
Topology Abstraction and Information Hiding
T-API topology models deliberately abstract implementation details, exposing only information necessary for service orchestration while hiding complexity that would burden higher-level systems. The fundamental topology primitive, the Topology Context, represents a network domain as a set of Nodes connected by Links. Nodes represent network elements or sub-networks without specifying whether a node is a single ROADM, an aggregated site with multiple ROADMs, or an entire metro network collapsed to a single logical entity. This flexibility allows controllers to adjust abstraction granularity based on orchestration requirements—detailed topology for path diversity analysis or highly aggregated topology reducing computational overhead in large networks.
Node Edge Points (NEPs) define attachment points where connections can terminate within nodes. An optical node might expose NEPs representing client-side ports accepting 100GE or 400GE signals, line-side wavelength ports, or add/drop capabilities at specific wavelengths. The controller associates capabilities with each NEP—supported rates, protocols, protection schemes—allowing orchestrators to verify compatibility when selecting service endpoints. Links connect NEPs between nodes, carrying attributes like available bandwidth, latency, shared risk groups, and administrative cost. Orchestrators use this link information for path computation without understanding that a link might represent a single fiber span, multiple parallel fibers, or a complex internal cross-connect within disaggregated equipment.
T-API Topology Model: Nodes, Links, and Service Endpoints
Real-World Implementation Patterns
Configuration Generation and Template Engines
Production controllers implement configuration generation using template engines that separate policy logic from device-specific syntax. The Jinja2 template engine, widely adopted in network automation, allows engineers to define configuration templates with embedded variables and control structures. A template for ROADM wavelength provisioning might accept parameters including wavelength number, input and output ports, attenuation settings, and protection mode, generating vendor-specific XML or JSON configuration payloads. This templating approach centralizes configuration logic in human-readable templates while enabling the same policy to target multiple vendor implementations through different template files.
<config xmlns="urn:ietf:params:xml:ns:netconf:base:1.0">
  <optical-channels xmlns="http://openconfig.net/yang/wavelength-router">
    <channel>
      <name>{{ channel_name }}</name>
      <config>
        <name>{{ channel_name }}</name>
        <wavelength>{{ wavelength_nm }}</wavelength>
        <operational-mode>{{ operational_mode }}</operational-mode>
        <target-output-power>{{ target_power_dbm }}</target-output-power>
      </config>
      {% if protection_enabled %}
      <protection>
        <type>1+1</type>
        <revertive>{{ protection_revertive }}</revertive>
      </protection>
      {% endif %}
    </channel>
  </optical-channels>
</config>


from jinja2 import Template
from ncclient import manager

template = Template(open('roadm_channel_template.j2').read())
config_xml = template.render(
    channel_name='och-1-0-1',
    wavelength_nm=1550.12,
    operational_mode='mode-100G-QPSK',
    target_power_dbm=-2.0,
    protection_enabled=True,
    protection_revertive=False
)

# Push via NETCONF
with manager.connect(host=device_ip, port=830,
                        username=user, password=pwd) as m:
    m.edit_config(target='candidate', config=config_xml)
    m.commit()
State Reconciliation and Desired State Management
Modern controllers implement declarative state management where users specify desired network state rather than sequences of configuration commands. The controller continuously compares actual device state against desired state, automatically applying corrections when discrepancies arise. This reconciliation loop operates on a cycle—typically every 30-60 seconds for configuration state, more frequently for operational state monitoring. When differences are detected, the controller generates minimal configuration changes (deltas) required to bring actual state into alignment with desired state, avoiding unnecessary device operations that might temporarily disrupt traffic.
Reconciliation logic must handle various state divergence scenarios. Configuration drift occurs when manual changes modify device configuration outside controller management—perhaps an operator executing CLI commands during troubleshooting. The controller detects this drift and either automatically corrects it (re-imposing desired configuration) or raises alarms for operator review, depending on configured policy. Operational state changes like interface down events or increased error rates trigger controller reactions—perhaps initiating protection switching, computing alternative paths, or updating topology databases to mark affected resources unavailable. External state dependencies require controllers to react to changes in adjacent systems—for example, when an IP router transitions a port to administratively down state, the optical controller should tear down the corresponding wavelength connection rather than maintaining unused optical capacity.
Performance Optimization at Scale
Database Design for Network State Management
Controllers managing large networks require carefully designed databases balancing query performance, update throughput, and consistency guarantees. Time-series databases like InfluxDB or TimescaleDB excel at storing telemetry data where each measurement includes timestamp, device identifier, metric name, and value. Queries typically access recent data—"show me OSNR for wavelength X over the past hour"—with older data retained for trend analysis and capacity planning. Indexing on timestamp and device identifier enables fast range queries while data retention policies automatically expire ancient data, preventing unbounded growth.
Graph databases like Neo4j naturally represent network topology where nodes (network elements) connect through edges (links). Graph queries express path computations and connectivity analysis elegantly: "find all paths between node A and node B with total latency under 15ms" translates directly to graph traversal algorithms without joining multiple relational tables. The database maintains indices enabling efficient graph operations—adjacency lookups to find all neighbors of a node, or path existence checks to validate end-to-end connectivity. Graph databases also simplify topology change management since adding or removing links updates graph structure directly without cascading foreign key constraints through normalized relational schemas.
Database Performance Scaling Analysis
Analyzing database query performance for network state operations.
Topology Query Complexity (Graph Database):
Tneighbors = O(d)  where d = node degree (typical: 2-8)
Tshortest-path = O(|E| + |V|×log|V|)  Dijkstra with heap
Tk-paths = O(k × |E|)  Yen's algorithm

Telemetry Write Throughput (Time-Series DB):
Writes/sec = (Ndevices × Mmetrics) / Tinterval

Example: 5,000 devices, 200 metrics/device, 10s interval
Writes/sec = (5000 × 200) / 10 = 100,000 writes/sec

Database Sizing:
Storage/day = Writes/sec × 86,400 × Record_size
            = 100,000 × 86,400 × 50 bytes
            = 432 GB/day

With 90-day retention:
Total_storage = 432 GB × 90 ≈ 40 TB

Index overhead (20-30%):
Total_with_index ≈ 50-52 TB

Query Performance Targets:
• Point query (single metric, device): <10ms
• Range query (hour of data): <100ms
• Aggregate query (average across domain): <1s
• Topology path computation: <100ms
Caching Strategies and Invalidation Patterns
Intelligent caching dramatically improves controller responsiveness by avoiding repeated expensive computations or database queries. Path computation results cache feasible paths between frequently-accessed node pairs, with cache entries including computed paths, quality metrics, and timestamps. When a new service request arrives, the controller first checks whether cached paths exist and remain valid—topology hasn't changed, cached entry hasn't expired. Cache hits eliminate path computation entirely, reducing latency from 50-100ms to sub-millisecond response times. Cache invalidation occurs when topology changes—link failures, capacity exhaustion, or administrative operations—require the controller to purge affected cache entries and recompute paths on subsequent requests.
Topology state caching reduces database query load for frequently-accessed topology views. Rather than fetching complete topology from the database on every northbound API request, controllers maintain in-memory topology representations updated incrementally as changes occur. When devices report link state changes via notifications, the controller updates the cached topology immediately, ensuring cache consistency without full database queries. Read-heavy workloads benefit tremendously from this pattern—orchestrators issuing hundreds of topology queries per minute access cached data rather than overwhelming the database. Write operations invalidate relevant cache entries or update them directly, maintaining consistency between cache and persistent storage.
End-to-End Integration: Complete Message Flow Analysis
Service Provisioning Workflow Across Protocol Layers
Understanding how protocols interact throughout a complete service provisioning workflow reveals the orchestration complexity that automation systems manage. Consider an end-to-end scenario: an enterprise customer requests a 100GE wavelength connection between two data centers through a self-service portal. This simple customer action triggers dozens of protocol interactions spanning multiple systems, controllers, and network devices. The complete flow demonstrates how northbound interfaces, southbound interfaces, data models, path computation, and configuration management integrate into cohesive network automation.
End-to-End Service Provisioning: Complete Protocol Message Flow
This complete workflow demonstrates several critical automation principles. Service abstraction allows the customer to request connectivity without understanding optical technology—they specify endpoints and bandwidth, not wavelengths and modulation formats. Protocol layering separates concerns: REST APIs handle web integration, T-API provides domain abstraction, NETCONF manages device configuration, and gNMI streams telemetry. Each protocol operates at its appropriate abstraction level, creating clean separation of responsibilities. Transactional semantics ensure atomicity: either the entire multi-device service succeeds or it fails completely with automatic rollback, preventing partial configurations that would break the network. Continuous monitoring through gNMI telemetry enables the controller to detect and respond to degradation immediately rather than waiting for customer complaints.
The performance characteristics of this workflow reveal why protocol selection matters. The northbound REST and T-API calls complete in milliseconds since they primarily involve database queries and in-memory path computation. The southbound NETCONF operations consume 10-25 seconds as devices validate configurations, apply changes to hardware, and verify operational state. Telemetry subscription setup adds negligible overhead—typically 100-200ms—but provides ongoing value through continuous monitoring. Total end-to-end provisioning time of 15-30 seconds represents dramatic improvement over manual processes requiring hours or days, while eliminating human error and ensuring configuration consistency across multi-vendor equipment.
Performance Optimization and Scaling Strategies
Controller Architecture for High-Performance Operation
Production optical network controllers must simultaneously handle multiple demanding workloads: processing high-frequency telemetry streams from thousands of interfaces, executing path computation algorithms across complex topologies, managing transactional state for concurrent service provisioning operations, and maintaining real-time synchronization with distributed databases. The architectural patterns that enable this performance differ significantly from traditional network management systems designed for infrequent polling and manual workflows.
The foundation of scalable controller architecture rests on asynchronous, event-driven programming models that decouple input/output operations from computational tasks. When a controller receives a northbound service provisioning request, the handling thread immediately queues the request and returns control rather than blocking while waiting for southbound device responses. Background worker threads process the queue, perform path computation, generate device configurations, and execute NETCONF transactions asynchronously. This non-blocking architecture allows a single controller instance to maintain thousands of concurrent operations without thread exhaustion, a critical requirement when provisioning services across multi-vendor networks where individual device response times vary unpredictably.
Thread pool management directly impacts controller throughput and resource utilization. A typical production controller allocates separate thread pools for distinct workload categories: northbound API handlers (CPU-bound, short-lived), path computation workers (CPU-intensive, medium duration), southbound protocol handlers (I/O-bound, variable duration), and telemetry processors (I/O-bound, continuous). This separation prevents resource contention between workload types and allows independent tuning of pool sizes based on empirical performance characteristics. Path computation pools, for example, might be sized to match available CPU cores since algorithms like Dijkstra's shortest path exhibit limited parallelism beyond core count, while southbound protocol pools scale larger to accommodate hundreds of concurrent device connections with minimal CPU utilization per connection.
Database Performance and Query Optimization
The controller's database layer stores network topology, service state, device inventory, and operational telemetry—data models spanning multiple dimensions of temporal, relational, and graph characteristics. Selecting appropriate database technologies for each data type dramatically affects performance. Network topology naturally forms a graph structure where nodes represent network elements and edges represent links or connections. Graph databases like Neo4j excel at path computation queries, executing k-shortest-paths algorithms in milliseconds across networks with thousands of nodes, while traditional relational databases struggle with recursive join operations required for the same computations.
Telemetry data presents distinct access patterns optimized by time-series databases. Production optical networks generate hundreds of gigabytes of metrics daily: optical power measurements every 10 seconds from thousands of interfaces, pre-FEC bit error rates streaming at sub-second intervals, OSNR values updated continuously. Time-series databases like InfluxDB or TimescaleDB compress this data efficiently through columnar storage and downsampling, reducing storage requirements by 10-20x compared to relational databases while accelerating time-range queries. A query requesting optical power trends over the past week completes in tens of milliseconds on a properly-indexed time-series database, enabling real-time dashboard visualization and AI model training on historical data.
Database Performance Scaling Analysis
Quantifying database requirements for large-scale optical network controllers.
Topology Query Complexity (Graph Database):
Tneighbors = O(d)  where d = node degree (typical: 2-8)
Tshortest-path = O(|E| + |V|×log|V|)  Dijkstra with heap
Tk-paths = O(k × |E|)  Yen's algorithm

Telemetry Write Throughput (Time-Series DB):
Writes/sec = (Ndevices × Mmetrics) / Tinterval

Example: 5,000 devices, 200 metrics/device, 10s interval:
Writes/sec = (5000 × 200) / 10 = 100,000 writes/sec

Database Sizing Requirements:
Storage/day = Writes/sec × 86,400 × Record_size
            = 100,000 × 86,400 × 50 bytes
            = 432 GB/day

With 90-day retention policy:
Total_storage = 432 GB × 90 ≈ 40 TB

Index overhead (20-30%):
Total_with_index ≈ 50-52 TB

Query Performance Targets:
• Point query (single metric, device): <10ms
• Range query (hour of data): <100ms
• Aggregate query (average across domain): <1s
• Topology path computation: <100ms
Intelligent Caching Strategies
Caching transforms controller responsiveness by eliminating repeated expensive computations and database queries. Path computation results represent prime caching candidates—once a controller computes feasible paths between node pairs considering current topology constraints, those results remain valid until topology changes occur. A path cache keyed by source-destination-bandwidth tuple allows instant response to subsequent service requests using identical parameters. Production deployments report cache hit rates exceeding 60% during steady-state operation, reducing average service provisioning latency from 800 milliseconds to under 50 milliseconds for cached paths.
Cache invalidation strategy critically determines data consistency. Network topology changes—link failures, capacity exhaustion, device additions—immediately invalidate cached paths traversing affected network segments. Controllers implement cache invalidation through pub-sub notification patterns where topology change events trigger selective cache purging. When a fiber cut occurs on a link, the controller invalidates all cached paths using that link rather than flushing the entire cache, preserving valid cached entries for unaffected network segments. This selective invalidation minimizes the cache cold-start penalty while ensuring path computation always reflects current topology.
Topology state caching reduces database load for read-heavy northbound API workloads. Rather than querying the database for every API request, controllers maintain in-memory topology representations synchronized incrementally as changes occur. When a device reports a new interface via NETCONF notification, the controller updates the in-memory topology directly, eliminating full database queries. Orchestrators issuing hundreds of topology queries per minute during service design workflows access cached data with sub-millisecond latency, while the controller asynchronously persists topology changes to the database for durability. This write-through caching pattern achieves microsecond read latencies while maintaining strong consistency guarantees.
Monitoring, Observability, and Analytics
Streaming Telemetry Architecture
Traditional network monitoring through SNMP polling suffers fundamental limitations that render it inadequate for modern optical networks. Polling intervals measured in minutes miss transient events and microbursts critical to optical performance characterization. The request-response model creates device CPU overhead as each poll requires MIB traversal and value computation. UDP-based SNMP traps provide unreliable event notification, frequently lost during network storms precisely when visibility is most critical. Perhaps most significantly, SNMP cannot capture the sub-second granularity data required for AI-driven analytics where millisecond-resolution metrics enable predictive models to identify degradation patterns before service impact.
gNMI streaming telemetry addresses these limitations through push-based architecture built on HTTP/2 and Protocol Buffers. Devices stream metric updates to collectors continuously without request overhead, with subscription modes tailored to different monitoring requirements. SAMPLE mode transmits data at configurable intervals from 10 milliseconds to hours, enabling fine-grained performance monitoring. ON_CHANGE mode sends updates only when values change, ideal for alarm state transitions and configuration modifications that occur infrequently but require immediate notification. This event-driven approach reduces bandwidth consumption by 80-90% compared to high-frequency polling while guaranteeing zero-delay notification of critical events.
Streaming Telemetry Architecture: Collection to Analytics Pipeline
Production streaming telemetry deployments achieve remarkable performance characteristics. End-to-end latencies under 50 milliseconds from device measurement to collector processing enable near-instantaneous dashboard updates. Collection rates exceeding 4,000 messages per second per device provide fine-grained visibility into transient optical phenomena. Binary Protocol Buffer encoding produces payloads 3-10 times smaller than equivalent XML, reducing network bandwidth consumption and accelerating deserialization. The combination of high-frequency, low-latency data delivery transforms network operations from reactive problem resolution to proactive performance optimization.
Alarm Management and Event Correlation
Traditional alarm systems built on SNMP traps suffer from unreliability and limited scalability. UDP-based trap delivery provides no delivery guarantee—traps lost during network congestion go undetected, creating blind spots precisely during fault conditions when visibility is most critical. As alarm volumes scale to thousands per minute during network storms, traditional network management systems experience database overload, with alarm ingestion latency growing to minutes or even causing complete system failure. The lack of structured alarm semantics forces operators to write fragile regular expressions parsing unstructured text messages, breaking whenever device software updates modify message formatting.
Modern alarm architectures address these limitations through message bus integration with Apache Kafka. Alarms published to Kafka topics benefit from persistent storage, guaranteed delivery, and massive throughput scalability—systems routinely processing millions of alarms per hour without performance degradation. Multiple consumers subscribe to alarm streams independently: real-time dashboards via WebSockets for operator visibility, AI analytics engines for pattern detection, ticketing systems for automated incident creation, and audit logging for compliance. This decoupled architecture allows independent scaling of alarm producers and consumers, eliminating the single point of failure inherent in traditional centralized alarm databases.
Event correlation transforms raw alarm floods into actionable intelligence. During fiber cuts, optical networks generate cascading alarm avalanches: downstream transponders report loss of signal, ROADMs detect missing wavelengths, client-side routers trigger interface down events. An uncorrelated alarm stream presents operators with thousands of individual alarms requiring manual analysis to identify the root cause. Event correlation engines apply temporal and topological analysis to identify the root fault—the fiber cut—suppressing derived alarms and presenting operators with a single actionable event. Production implementations reduce alarm presentation volumes by 95% through correlation, dramatically improving mean time to repair by focusing operator attention on actual failures rather than symptom alarms.
AI/ML Integration for Intelligent Networks
The Autonomous Network Vision
The integration of artificial intelligence and machine learning represents the most significant architectural shift in optical networking since the introduction of software-defined control. Traditional automation executes predefined workflows—receiving service requests, computing paths, configuring devices—but lacks the ability to adapt to changing conditions or predict future states. AI-driven systems transform controllers from reactive executors into proactive decision-making entities capable of learning from historical patterns, predicting future network behavior, and autonomously optimizing performance without human intervention. This evolution from automated to autonomous operations fundamentally redefines the network engineer's role from configuration specialist to machine learning model curator.
The path to network autonomy progresses through defined maturity levels. Level 0 represents fully manual operation requiring human intervention for every configuration change. Level 1 automation executes predefined workflows but requires human triggering. Level 2 systems detect conditions and automatically execute appropriate responses within predefined rules. Level 3 introduces AI-driven predictive capabilities, anticipating failures and proactively adjusting parameters. Level 4 achieves partial autonomy with systems managing routine operations independently while escalating complex scenarios. Level 5 represents full autonomy—networks that self-configure, self-optimize, self-heal, and self-protect without human involvement. Production optical networks currently operate between Levels 2 and 3, with leading operators piloting Level 4 capabilities in controlled environments.
Predictive Maintenance: Anticipating Failures Before Impact
Optical components exhibit predictable degradation patterns over their operational lifetime. Laser diodes gradually increase bias current to maintain constant output power as quantum efficiency declines. Optical amplifiers experience slow gain reduction from erbium-doped fiber aging. Fiber connectors accumulate micro-contamination that gradually increases insertion loss. These degradation trends, invisible in traditional polling-based monitoring with 15-minute granularity, become apparent in high-resolution streaming telemetry data collected at sub-second intervals. Machine learning models trained on historical component telemetry learn degradation signatures, enabling failure prediction days or weeks before actual service impact.
The predictive maintenance workflow begins with feature engineering—extracting meaningful patterns from raw telemetry streams. For laser degradation prediction, relevant features include bias current trend slope, temperature-compensated optical power variation, and correlation between bias current and output power. Time-series models like Long Short-Term Memory (LSTM) neural networks excel at learning temporal dependencies in component behavior, capturing subtle patterns indicating impending failure. A trained LSTM model analyzing transponder telemetry achieves 0.125 dB mean absolute error in OSNR prediction 24 hours into the future, sufficient to trigger preemptive component replacement before signal degradation causes service errors.
AI/ML Pipeline for Predictive Maintenance
Production deployments demonstrate remarkable failure prediction accuracy. One tier-1 operator reported 87% accuracy in predicting transponder failures 7-14 days before actual failure, enabling scheduled maintenance replacements during planned windows rather than emergency service-impacting interventions. The economic impact extends beyond avoided downtime: proactive replacement reduces spare inventory requirements by 30% as components are replaced based on predicted need rather than maintained as safety stock against unpredictable failures. The combination of improved availability and reduced operational costs creates compelling return on investment, with payback periods under 18 months reported by early adopters.
Traffic Forecasting and Capacity Planning
Network capacity planning traditionally relied on manual analysis of historical trend reports, with engineers reviewing monthly traffic growth rates and extrapolating future requirements through spreadsheet projections. This reactive approach leads to either over-provisioning—wasting capital on unused capacity—or under-provisioning—risking congestion and service degradation. Machine learning traffic forecasting transforms capacity planning into a predictive discipline, automatically identifying temporal patterns, seasonal variations, and growth trends that inform optimal capacity augmentation timing.
Time-series forecasting models like ARIMA (AutoRegressive Integrated Moving Average) and Prophet excel at learning traffic patterns spanning multiple time scales. Daily patterns show peak utilization during business hours with overnight troughs. Weekly patterns exhibit reduced weekend traffic for enterprise networks. Seasonal patterns capture holiday periods, academic calendars affecting research networks, or retail peak seasons. A trained Prophet model analyzing 18 months of historical telemetry predicts bandwidth utilization 30-90 days ahead with mean absolute percentage error under 8%, providing advance warning when links will exhaust capacity and require augmentation.
The practical value emerges when forecasts drive automated capacity management workflows. When the forecasting model predicts a link will reach 80% utilization within 60 days—the threshold triggering capacity planning cycles—it automatically generates a capacity augmentation ticket including predicted exhaust date, required additional capacity, and suggested implementation timeline. Network planners review AI-generated recommendations rather than manually analyzing thousands of link utilization graphs, reducing planning cycle time from weeks to days while improving accuracy through data-driven predictions rather than subjective judgment.
Quality of Transmission Estimation
Establishing new optical paths requires predicting whether the proposed route will deliver acceptable signal quality at the receiver. Traditional QoT calculation involves complex physics modeling: computing accumulated chromatic dispersion across fiber spans, estimating amplifier noise figure contributions, calculating nonlinear interference from other wavelengths, and determining if the resulting optical signal-to-noise ratio exceeds the receiver's threshold. Analytical models require detailed knowledge of fiber types, span lengths, amplifier configurations, and channel loading—information often incomplete or inaccurate in operational networks. Conservative assumptions lead to rejected paths that would actually work, while optimistic assumptions risk deploying paths that fail to meet BER requirements.
Machine learning QoT estimation sidesteps analytical complexity by learning directly from measured performance data. Convolutional neural networks trained on thousands of established lightpath measurements learn the relationship between path characteristics—hop count, total distance, ROADM traversals, wavelength assignment—and resulting OSNR. The trained model predicts OSNR for proposed new paths with 0.125 dB mean absolute error, accuracy sufficient for deployment decisions. More importantly, ML models continuously improve as new paths are deployed and measured, automatically capturing effects of equipment upgrades, fiber aging, and network topology changes without manual model recalibration.
Anomaly Detection and Root Cause Analysis
Identifying abnormal network behavior from massive telemetry streams challenges human operators overwhelmed by data volume. A single optical network element generates hundreds of metrics every 10 seconds—interface counters, optical power levels, error rates, environmental sensors. Across thousands of devices, operators must distinguish genuine anomalies requiring attention from benign variations like daily traffic patterns or temperature fluctuations. Unsupervised machine learning excels at this pattern recognition challenge, automatically learning normal behavior baselines and flagging statistically significant deviations warranting investigation.
Isolation Forest algorithms exemplify effective anomaly detection for optical networks. The algorithm builds decision trees partitioning the feature space of normal telemetry measurements. Anomalous data points—values significantly different from historical patterns—require fewer tree partitions to isolate, enabling efficient anomaly scoring. When optical power on an interface suddenly drops 3 dB while historically varying less than 0.5 dB, the Isolation Forest immediately flags the anomaly for operator review. False positive rates under 2% maintain operator trust while catching subtle degradation that escapes threshold-based alerting.
Root cause analysis extends anomaly detection by correlating multiple simultaneous anomalies to identify underlying faults. When a fiber span fails, dozens of downstream interfaces report anomalies—loss of light, increased error rates, missing OSNR measurements. Graph-based root cause analysis algorithms use network topology to trace anomalies back to their common cause, identifying the failed span as the root issue. This automated diagnosis reduces mean time to identify from hours of manual correlation to seconds of algorithmic analysis, dramatically accelerating service restoration.
Advanced Implementation Patterns
Multi-Vendor Network Integration
Production optical networks invariably involve equipment from multiple vendors, each with distinct management interfaces, data models, and operational characteristics. A typical metro network might include Ciena for long-haul DWDM, Infinera for metro aggregation, and Nokia for access—each vendor offering superior capabilities in specific applications. Controllers must abstract these vendor differences while preserving access to vendor-specific features that differentiate products. The architectural pattern enabling this balance separates vendor-agnostic service logic from vendor-specific device adapters through clearly-defined abstraction boundaries.
Device adapter architecture implements the strategy pattern from software engineering, with each vendor adapter encapsulating vendor-specific NETCONF/XML structures, configuration templates, and state translation logic. When the controller needs to configure a wavelength, the service orchestration layer determines the required abstract parameters—source node, destination node, bandwidth, protection type—and invokes a generic "provision_wavelength" interface. The vendor-specific adapter receives this abstract request and translates it into vendor-native NETCONF operations: Ciena adapters generate WaveLogic-specific XML, Infinera adapters produce Groove-specific configuration, Nokia adapters emit 1830 PSS-specific commands. Response translation flows in reverse, with adapters converting vendor-specific operational state into standardized data models for northbound API consumers.
OpenConfig YANG models provide vendor-neutral abstractions for common optical network functionality, enabling controllers to manage multi-vendor networks through uniform interfaces. The optical-channel model defines wavelength provisioning parameters—frequency, operational mode, output power—in vendor-agnostic terms. Transponders supporting OpenConfig accept these standardized configurations and map them to device-specific implementations internally. Controllers targeting OpenConfig achieve significant simplification: instead of maintaining separate code paths for five vendor platforms, a single OpenConfig-based implementation manages all supporting vendors. The operational reality involves hybrid approaches—OpenConfig for common functionality with vendor-native models filling gaps for advanced features.
DevOps and CI/CD for Network Automation
Applying software engineering practices to network automation improves quality, accelerates development, and reduces production incidents. Traditional network management software development involved months-long release cycles with manual testing, lengthy approval processes, and high-risk big-bang deployments. Modern DevOps approaches treat network automation code—Python scripts, Ansible playbooks, YANG models—as first-class software artifacts subject to version control, automated testing, and continuous integration pipelines.
The network automation CI/CD pipeline begins with engineers committing code changes to Git repositories. Automated build systems trigger on every commit, executing comprehensive test suites against virtual network labs built with Containerlab or GNS3. Unit tests verify individual functions—does the path computation algorithm correctly handle dual-homed nodes? Integration tests validate end-to-end workflows—does service provisioning successfully configure all necessary devices? Regression tests ensure new changes don't break existing functionality. Only code passing all automated tests advances to staging environments for human review before production deployment. This automated quality gate catches bugs before they impact production networks, reducing production incidents by 60% compared to manual testing approaches.
Infrastructure-as-code principles extend beyond application code to network controller deployment itself. Terraform templates define controller infrastructure—virtual machines, Kubernetes clusters, database instances—enabling identical environment recreation for development, staging, and production. Ansible playbooks configure operating systems, install dependencies, and deploy controller applications. GitOps workflows treat infrastructure definitions as authoritative sources stored in version control, with automated deployment pipelines applying changes declared in Git. This approach eliminates configuration drift between environments and enables rapid disaster recovery through automated infrastructure reconstruction from code.
Zero-Touch Provisioning and Service Activation
Traditional service provisioning involved manual steps spanning multiple teams: sales creates order, engineering designs path, provisioning configures devices, testing validates service, operations hands off to customer. Each handoff introduces delays and error opportunities as information transfers between systems and people. Zero-touch provisioning eliminates manual intervention by automating the entire workflow from order entry to service activation through end-to-end orchestration.
The zero-touch workflow begins when an order management system creates a service request via the controller's northbound REST API, providing abstract service parameters: customer identifier, A-end location, Z-end location, bandwidth, latency requirement, protection level. The controller orchestration engine executes a multi-step workflow automatically: query inventory databases for available resources, compute candidate paths satisfying service requirements, select optimal path based on cost or latency, reserve resources in the resource management database, generate vendor-specific device configurations, execute NETCONF transactions to all path devices, verify service operational state through telemetry, update service catalog with active service details, and send service ready notification to customer portal. The entire workflow completes in 15-30 seconds without human involvement, enabling self-service customer portals and eliminating provisioning backlogs.
Real-World Case Studies
Global Research Network: ESnet Deploys Grafana for Optical Telemetry
Energy Sciences Network (ESnet), the United States Department of Energy's dedicated science network, faced challenges visualizing optical performance across its transcontinental 100G and 400G coherent infrastructure. Traditional vendor element management systems provided limited customization and couldn't correlate optical metrics with application-layer performance. ESnet deployed Grafana as its primary optical network visualization platform, developing custom React plugins enabling constellation diagram display, real-time OSNR trending, and spectral analysis correlating wavelength performance across multiple ROADM hops.
The implementation streams gNMI telemetry from Cisco NCS and Juniper optical platforms into InfluxDB time-series storage at 10-second intervals. Custom Grafana dashboards provide operations teams real-time visibility into critical optical parameters: pre-FEC bit error rates identifying marginal links before service impact, chromatic dispersion accumulation validating compensation, and polarization-dependent loss tracking fiber health. The transition from 15-minute SNMP polling to sub-second streaming telemetry enabled proactive issue detection, with ESnet reporting 40% reduction in mean time to repair through earlier anomaly identification. The Grafana deployment costs under 5% of vendor NMS solutions while providing superior flexibility and customization.
Tier-1 Service Provider: Automated Optical Spectrum Analysis
A North American tier-1 telecommunications provider managing over 50,000 optical wavelengths across continental DWDM networks struggled with manual optical spectrum analyzer testing during network expansions and troubleshooting. Engineers manually collected OSA measurements from dozens of ROADM sites for each wavelength addition, requiring days of lab time and producing inconsistent measurement data due to varying operator practices. The provider implemented automated OSA workflows using Python scripts controlling programmable analyzers via SCPI commands, integrated with their network controller for orchestrated testing campaigns.
The automation system executes comprehensive spectral analysis campaigns overnight during maintenance windows. Upon receiving wavelength provisioning requests, the controller automatically generates test scripts configuring spectrum analyzers at relevant ROADM sites, sweeps wavelength channels from 1528nm to 1565nm with 0.1nm resolution, captures channel power levels and OSNR measurements, compares results against reference baselines, flags anomalies exceeding defined thresholds, generates automated test reports including graphical spectral plots, and updates the configuration management database with validated operational parameters. The automated workflow reduced testing time from 4-8 hours to 30 minutes while improving measurement consistency and documentation quality. The provider estimates 50% reduction in network turn-up time through test automation.
Hyperscaler Data Center Operator: AI-Driven Capacity Forecasting
A major cloud service provider operating optical data center interconnect networks between 50+ global facilities faced challenges predicting capacity exhaustion across thousands of inter-data center links. Traffic patterns exhibited complex temporal dependencies—daily application workload cycles, weekly backup schedules, monthly data migration campaigns, seasonal business variations. Manual capacity planning required teams of analysts reviewing utilization reports and predicting augmentation requirements through spreadsheet extrapolation, often missing capacity constraints until links approached congestion.
The operator deployed Prophet time-series forecasting models integrated with their network telemetry platform. The system continuously ingests 10-second interface counter data from all inter-DC links, aggregates to hourly and daily resolution, trains individual Prophet models per link capturing seasonal and trend components, generates 90-day forward capacity predictions, identifies links projected to exceed 80% utilization, automatically creates capacity augmentation tickets with predicted exhaust dates, and provides confidence intervals quantifying prediction uncertainty. After 18 months of operation, the forecasting system achieved 92% prediction accuracy for capacity exhaust events 60 days ahead, enabling proactive capacity additions before service impact. The automated forecasting eliminated the 8-person capacity planning team previously required for manual analysis, reallocating engineers to network architecture improvements.
Future Trends and Emerging Technologies
Intent-Based Networking: Shifting from How to What
Current network automation requires operators to specify detailed implementation mechanisms—exact paths, specific configurations, granular parameter settings. Intent-based networking represents a paradigm shift where operators declare desired outcomes rather than implementation details. Instead of "configure wavelength on ports 1/0/1 through 1/0/8 with frequency 193.1 THz," operators state intent: "provide 400 Gbps connectivity between data center A and data center B with latency under 10ms and 99.99% availability." The intent-based controller automatically determines optimal implementation paths, selects appropriate optical technologies, configures all necessary devices, continuously monitors service performance, and dynamically adapts configurations to maintain intent compliance as network conditions change.
The architectural components enabling intent-based networking include intent translation engines that convert high-level service requirements into measurable technical parameters, policy reasoning systems that evaluate candidate implementations against organizational constraints and optimization goals, continuous verification engines that monitor deployed services against intent specifications, and remediation systems that detect and correct intent violations through automated configuration adjustments. Research implementations demonstrate intent-based optical networking managing multi-domain wavelength services, automatically selecting appropriate modulation formats based on distance requirements, implementing protection mechanisms achieving specified availability targets, and dynamically adjusting optical power levels maintaining performance margins.
Digital Twins: Virtual Network Replicas for Predictive Analytics
Digital twin technology creates real-time virtual replicas of physical optical networks, synchronized continuously through streaming telemetry and state mirroring. The digital twin maintains a complete model of network topology, device configurations, traffic patterns, and operational state, enabling powerful what-if analysis and predictive simulation without touching production infrastructure. Engineers can test proposed configuration changes against the digital twin, simulating service impact and identifying potential issues before production deployment. AI systems can explore optimization scenarios at scale, testing thousands of parameter combinations virtually to identify optimal configurations deployed to the physical network.
The implementation architecture for optical network digital twins combines multiple technologies: streaming telemetry provides continuous state synchronization from physical devices to the digital model, physical layer simulation engines model optical propagation including chromatic dispersion and nonlinear effects, traffic generators replay historical patterns or synthesize representative workloads, and AI optimization engines explore configuration spaces seeking performance improvements. Production pilots demonstrate digital twin applications including failure impact analysis predicting which services would be affected by specific fiber cuts, upgrade planning simulating the performance impact of deploying new coherent transponders, and automated optimization using reinforcement learning to discover optimal ROADM configuration parameters maximizing network capacity.
Quantum-Ready Network Architectures
The emergence of quantum computing introduces both security threats and new capabilities for optical networks. Quantum computers capable of executing Shor's algorithm will break current RSA and elliptic curve cryptography protecting network control plane communications, rendering existing NETCONF, RESTCONF, and gNMI security mechanisms vulnerable. Quantum Key Distribution provides quantum-mechanical security for encryption keys transmitted over optical channels, offering security guaranteed by physics rather than computational complexity. Network architectures incorporating QKD require optical infrastructure supporting quantum channels alongside classical data channels, controllers managing quantum key lifecycle and distribution, and crypto-agile protocols capable of transitioning between classical and quantum-resistant encryption.
The transition to quantum-ready networks proceeds incrementally. Near-term deployments integrate QKD systems as dedicated out-of-band channels for key distribution to classical encryption systems, protecting against future quantum threats through post-quantum cryptographic algorithms standardized by NIST, and implementing crypto-agility in protocols enabling algorithm updates without complete system redesign. Long-term architectures envision quantum repeaters extending QKD range beyond fiber attenuation limits, quantum memories enabling quantum network routing, and integration of quantum communication and classical networking in unified management platforms. These developments position optical networks as the physical foundation for both quantum communication and quantum-resistant classical networking.
Open Optical Packet Transport: Converging IP and Optical Layers
The traditional separation between IP routers and optical transport equipment increasingly constrains network efficiency and scalability. Routers generate IP packets but rely on separate optical transponders for wavelength generation. This artificial boundary requires duplicate network management systems, introduces unnecessary protocol conversion overhead, and prevents coordinated optimization across layers. Open Optical Packet Transport initiatives promoted by the Telecom Infra Project dissolve these boundaries through highly integrated platforms combining packet forwarding, coherent optics, and optical switching in unified systems managed through common APIs.
The OOPT architecture eliminates dedicated transponders by integrating coherent DSPs directly with packet processors. IP routers generate wavelengths directly from packet interfaces, removing electrical-to-optical conversion stages. Disaggregated chassis separate packet processing blades from optical line systems connected via open interfaces, enabling mix-and-match of merchant silicon packet engines with optical transport optimized for specific applications. Management unification allows controllers to optimize across the IP-optical boundary—adjusting router queuing policies based on optical link impairments, selecting optical modulation formats based on IP traffic characteristics, and coordinating protection mechanisms spanning packet and optical domains. These converged architectures represent the endpoint of the automation journey: networks where artificial layer boundaries no longer constrain optimization and operations.
Conclusion
The convergence of multiple technological trends—software-defined control, streaming telemetry, machine learning, and open interfaces—creates unprecedented opportunities for network automation. Controllers no longer simply execute predefined workflows but actively learn from historical patterns, predict future network behavior, and autonomously optimize performance. The role of network engineers evolves in parallel, shifting from configuration specialists executing manual procedures to automation architects designing intelligent systems and machine learning engineers curating predictive models. These changes fundamentally redefine optical networking as a software discipline where code quality, testing practices, and continuous integration become as critical as optical physics and signal processing knowledge.
The path forward for organizations implementing optical network automation requires balanced attention to technology, process, and people. Technology investments should prioritize vendor-neutral standards and open interfaces maximizing implementation flexibility and avoiding lock-in. OpenConfig YANG models, gNMI streaming telemetry, and T-API service abstractions provide proven foundations for multi-vendor automation despite ongoing maturation. Process transformation through DevOps practices—version control, automated testing, continuous integration—improves automation code quality while accelerating development cycles. Investment in people through training programs developing Python proficiency, YANG modeling skills, and machine learning fundamentals ensures organizational capability keeps pace with technological possibility.
The quantified benefits of optical network automation—40-65% operational cost reduction, 50-80% provisioning time improvement, 30-40% availability gains—justify significant implementation investment. Early automation projects focusing on high-value, repetitive workflows demonstrate rapid ROI while building organizational expertise. Success requires executive sponsorship providing necessary resources, cross-functional collaboration bridging traditional organizational silos between network operations and software development, and realistic timelines acknowledging that transformation to fully autonomous networks spans years not months. Organizations approaching automation as strategic imperatives rather than tactical projects achieve sustainable competitive advantages through network agility, operational efficiency, and service innovation impossible with legacy manual processes.
Key Takeaways :
1. Start Small, Scale Progressively: Begin with focused automation of repetitive tasks—configuration backups, basic provisioning workflows—before attempting end-to-end orchestration. Early wins build organizational confidence and demonstrate value.
2. Invest in Observability First: Streaming telemetry and comprehensive monitoring provide the data foundation necessary for intelligent automation. Controllers making decisions without accurate network state inevitably introduce errors.
3. Embrace Standards and Open Interfaces: OpenConfig, gNMI, and T-API reduce vendor lock-in and simplify multi-vendor integration. Vendor-native solutions may offer richer features but constrain future flexibility.
4. Treat Automation Code as Production Software: Apply software engineering best practices—version control, automated testing, code review—to network automation. Poor code quality causes production incidents regardless of good intentions.
5. Plan for Continuous Learning: The automation landscape evolves rapidly. Dedicate time for engineers to learn new protocols, experiment with emerging technologies, and stay current with industry developments through conferences and training.
Looking ahead, the optical networking industry stands at the threshold of genuine network autonomy. Current automation represents Level 2-3 capabilities—systems that detect conditions and execute predefined responses. The integration of advanced AI techniques—reinforcement learning, transformer models, large language models—promises progression toward Level 4-5 autonomy where networks continuously optimize themselves without human intervention, adapting to changing traffic patterns, automatically upgrading software, and self-healing from failures without operational team involvement. This vision of self-driving networks, once relegated to research speculation, becomes increasingly tangible as production deployments demonstrate AI capabilities previously considered theoretical.
The technical foundation enabling this autonomous future—northbound and southbound interface protocols examined throughout this series—already exists in production form. The protocols themselves require refinement and evolution, but their fundamental architecture patterns have proven sound across thousands of production deployments. The challenge facing the industry is not technological but organizational: developing engineering cultures embracing automation as core competency, investing in training programs building necessary skills, and committing resources to multi-year transformation journeys. Organizations successfully navigating this transition will operate networks of unprecedented scale, reliability, and agility. Those maintaining manual processes will find competitive pressures from automation-native operators increasingly insurmountable. The choice between these futures is available today, but the window for action narrows as automation advantages compound over time.
References
- OpenConfig Working Group, "OpenConfig YANG Models for Optical Networks," 2024, https://openconfig.net/projects/models/
- IETF RFC 6241, "Network Configuration Protocol (NETCONF)," 2011
- IETF RFC 8040, "RESTCONF Protocol," 2017
- gRPC Network Management Interface (gNMI) Specification, OpenConfig, 2023
- Open Networking Foundation, "Transport API (T-API) 2.4," 2023
- Ciena Corporation, "Adaptive Network: AI-Powered Optical Networking," Technical White Paper, 2024
- Nokia Networks, "Network Services Platform: Multi-Vendor SDN Orchestration," Solution Brief, 2024
- Analysys Mason, "Quantifying the Benefits of Optical Network Automation," Research Report, 2024
- Energy Sciences Network (ESnet), "Grafana-Based Optical Telemetry Monitoring," Technical Documentation, 2023
- Telecom Infra Project, "Open Optical Packet Transport (OOPT) Architecture," Specification v2.0, 2024
- MEF Forum, "LSO Presto: Lifecycle Service Orchestration," MEF 55.1, 2023
- ITU-T Recommendation G.709, "Interfaces for the Optical Transport Network," 2020
- IEEE 802.3, "Ethernet Standard Including 400 Gigabit Ethernet," 2024
- Internet2 Community, "Network Automation with Ansible and Python," Workshop Materials, 2024
- Juniper Networks, "Paragon Automation Platform: Intent-Based Networking," Technical Overview, 2024
- Infinera Corporation, "Intelligent Transport Network: AI-Driven Optical Operations," White Paper, 2024
- Deutsche Telekom, "Zero-Touch Network Automation Case Study," Industry Report, 2023
- Netflix Tech Blog, "Streaming Telemetry at Scale," Engineering Blog Post, 2023
- Google Cloud, "Network Automation Best Practices for Hyperscale Operations," Technical Guide, 2024
- NIST, "Post-Quantum Cryptography Standardization," Project Documentation, 2024
- Sanjay Yadav, "Optical Network Communications: An Engineer's Perspective" – Bridge the Gap Between Theory and Practice in Optical Networking.
- Sanjay Yadav, "Automation for Network Engineers Using Python and Jinja2" – Practical Insights into Automation World in Optical Networking.
For educational purposes in optical networking automation and DWDM systems
Note: This guide is based on industry standards, best practices, and real-world implementation experiences. Specific implementations may vary based on equipment vendors, network topology, and regulatory requirements. Always consult with qualified network engineers and follow vendor documentation for actual deployments.