Syslog is one of the most widely used protocols for logging system events, providing network and optical device administrators with the ability to collect, monitor, and analyze logs from a wide range of devices. This protocol is essential for network monitoring, troubleshooting, security audits, and regulatory compliance. Originally developed in the 1980s, Syslog has since become a standard logging protocol, used in various network and telecommunications environments, including optical devices.Lets explore Syslog, its architecture, how it works, its variants, and use cases. We will also look at its implementation on optical devices and how to configure and use it effectively to ensure robust logging in network environments.
What Is Syslog?
Syslog (System Logging Protocol) is a protocol used to send event messages from devices to a central server called a Syslog server. These event messages are used for various purposes, including:
- Monitoring: Identifying network performance issues, equipment failures, and status updates.
- Security: Detecting potential security incidents and compliance auditing.
- Troubleshooting: Diagnosing issues in real-time or after an event.
Syslog operates over UDP (port 514) by default, but can also use TCP to ensure reliability, especially in environments where message loss is unacceptable. Many network devices, including routers, switches, firewalls, and optical devices such as optical transport networks (OTNs) and DWDM systems, use Syslog to send logs to a central server.
How Syslog Works
Syslog follows a simple architecture consisting of three key components:
- Syslog Client: The network device (such as a switch, router, or optical transponder) that generates log messages.
- Syslog Server: The central server where log messages are sent and stored. This could be a dedicated logging solution like Graylog, RSYSLOG, Syslog-ng, or a SIEM system.
- Syslog Message: The log data itself, consisting of several fields such as timestamp, facility, severity, hostname, and message content.
Syslog Message Format
Syslog messages contain the following fields:
- Priority (PRI): A combination of facility and severity, indicating the type and urgency of the message.
- Timestamp: The time at which the event occurred.
- Hostname/IP: The device generating the log.
- Message: A human-readable description of the event.
Example of a Syslog Message:
<34>Oct 10 13:22:01 router-1 interface GigabitEthernet0/1 downThis message shows that the device with hostname router-1 logged an event at Oct 10 13:22:01, indicating that the GigabitEthernet0/1 interface went down.
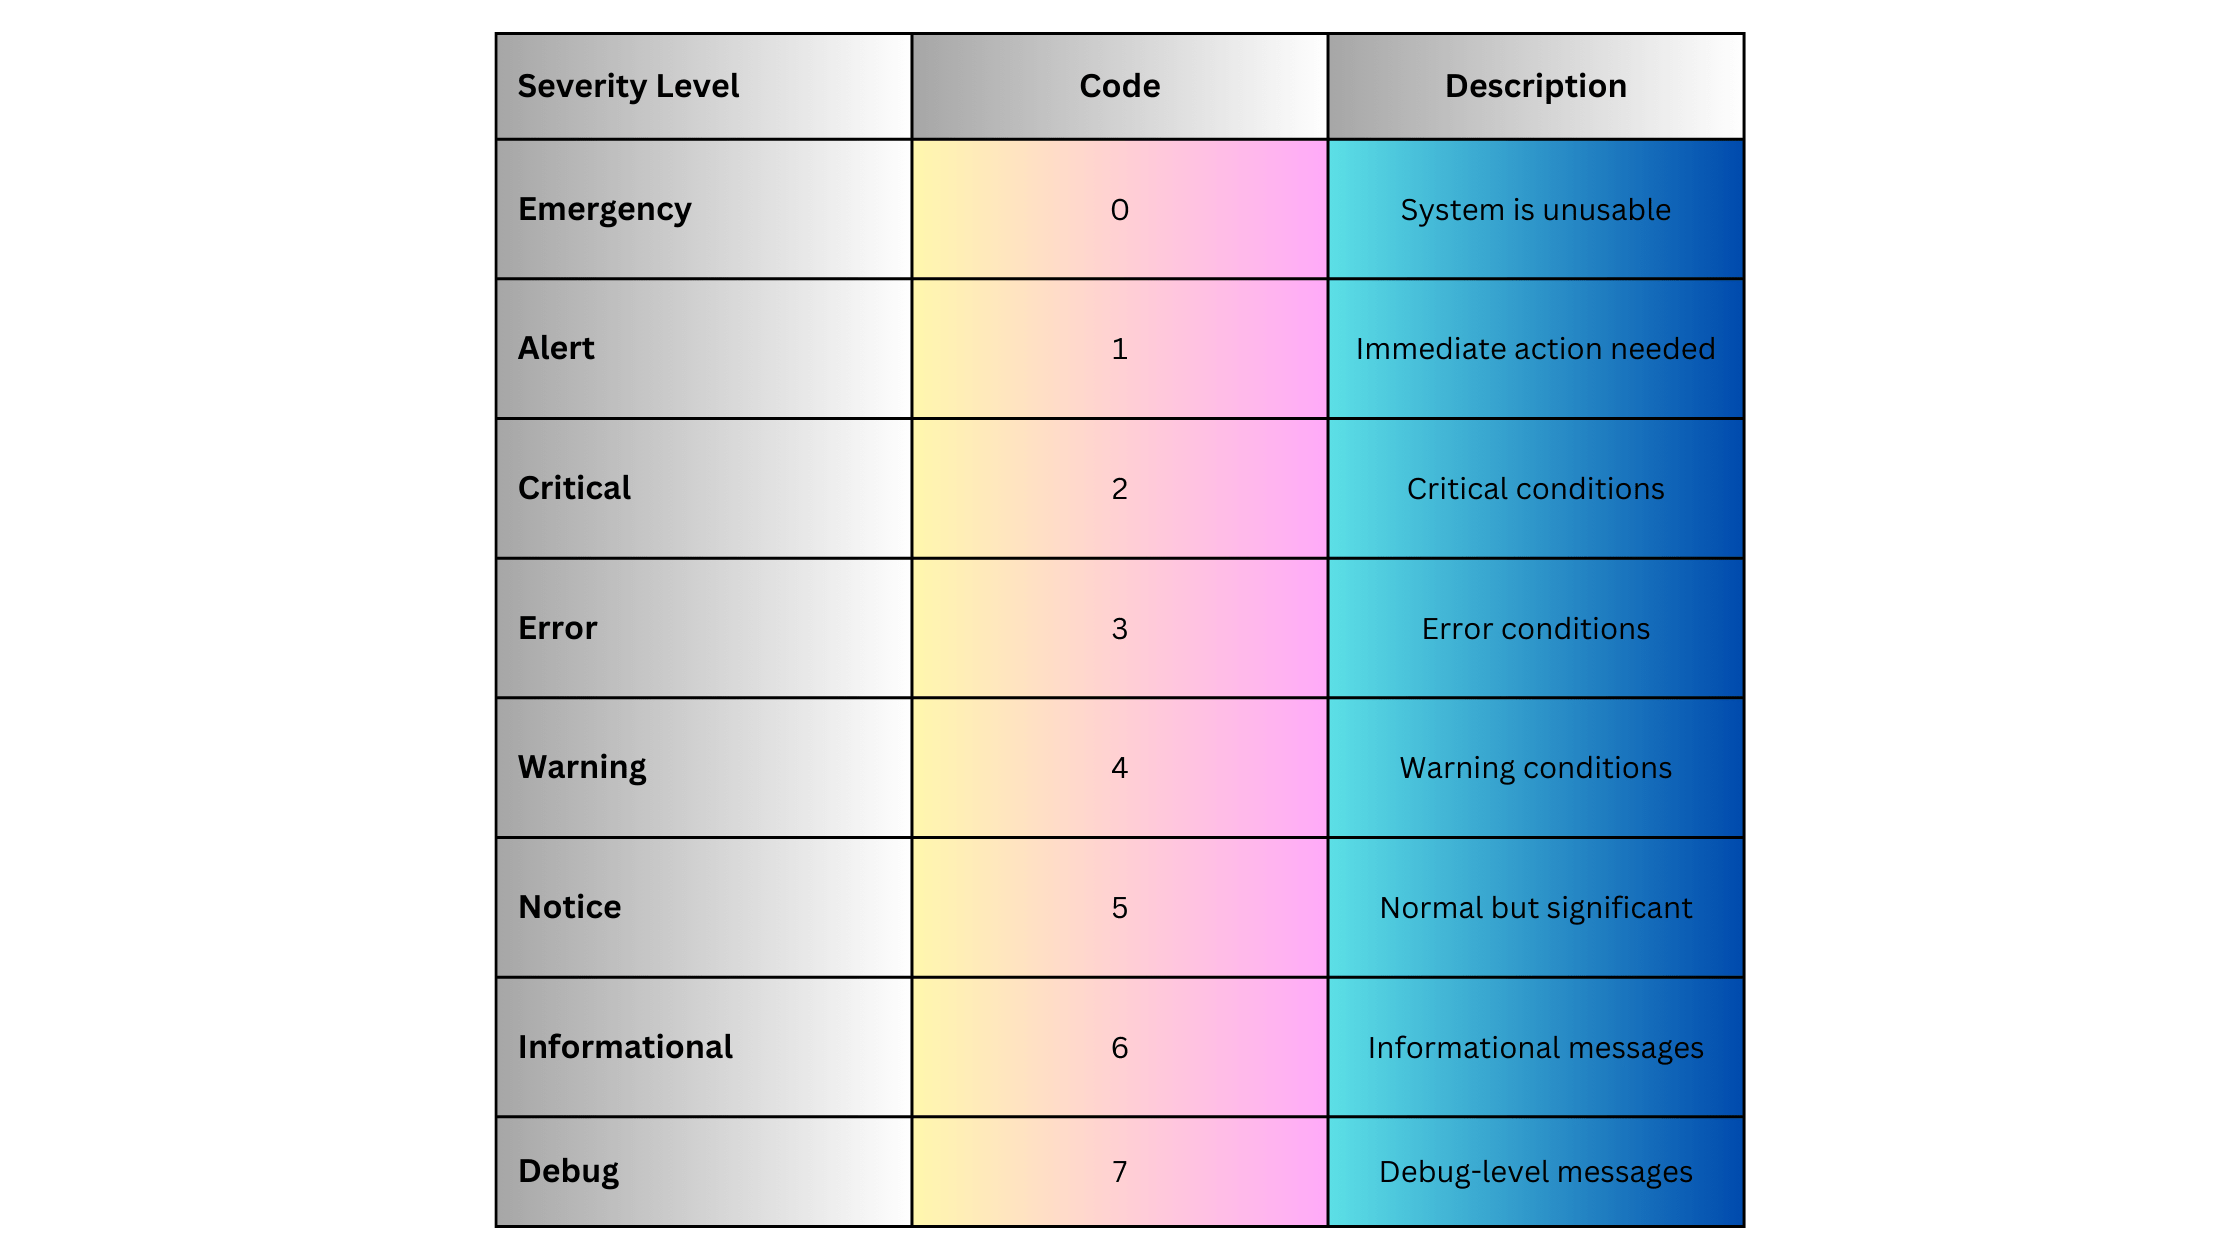
Syslog Severity Levels
Syslog messages are categorized by severity to indicate the importance of each event. Severity levels range from 0 (most critical) to 7 (informational):
Syslog Facilities
Syslog messages also include a facility code that categorizes the source of the log message. Commonly used facilities include:

Each facility is paired with a severity level to determine the Priority (PRI) of the Syslog message.
Syslog in Optical Networks
Syslog is crucial in optical networks, particularly in managing and monitoring optical transport devices, DWDM systems, and Optical Transport Networks (OTNs). These devices generate various logs related to performance, alarms, and system health, which can be critical for maintaining service-level agreements (SLAs) in telecom environments.
Common Syslog Use Cases in Optical Networks:
- DWDM System Monitoring:
- Track optical signal power levels, bit error rates, and link status in real-time.
- Example: “DWDM Line 1 signal degraded, power level below threshold.”
- OTN Alarms:
- Log alarms related to client signal loss, multiplexing issues, and channel degradations.
- Example: “OTN client signal failure on port 3.”
- Performance Monitoring:
- Monitor latency, jitter, and packet loss in the optical transport network, essential for high-performance links.
- Example: “Performance threshold breach on optical channel, jitter exceeded.”
- Hardware Failure Alerts:
- Receive notifications for hardware-related failures, such as power supply issues or fan failures.
- Example: “Power supply failure on optical amplifier module.”
These logs can be critical for network operations centers (NOCs) to detect and resolve problems in the optical network before they impact service.
Syslog Example for Optical Devices
Here’s an example of a Syslog message from an optical device, such as a DWDM system:
<22>Oct 12 10:45:33 DWDM-1 optical-channel-1 signal degradation, power level -5.5dBm, threshold -5dBmThis message shows that on DWDM-1, optical-channel-1 is experiencing signal degradation, with the power level reported at -5.5dBm, below the threshold of -5dBm. Such logs are crucial for maintaining the integrity of the optical link.
Syslog Variants and Extensions
Several extensions and variants of Syslog add advanced functionality:
Reliable Delivery (RFC 5424)
The traditional UDP-based Syslog delivery method can lead to log message loss. To address this, Syslog has been extended to support TCP-based delivery and even Syslog over TLS (RFC 5425), which ensures encrypted and reliable message delivery, particularly useful for secure environments like data centers and optical networks.
Structured Syslog
To standardize log formats across different vendors and devices, Structured Syslog (RFC 5424) allows logs to include structured data in a key-value format, enabling easier parsing and analysis.
Syslog Implementations for Network and Optical Devices
To implement Syslog in network or optical environments, the following steps are typically involved:
Step 1: Enable Syslog on Devices
For optical devices such as Cisco NCS (Network Convergence System) or Huawei OptiX OSN, Syslog can be enabled to forward logs to a central Syslog server.
Example for Cisco Optical Device:
logging host 192.168.1.10
logging trap warnings
In this example:
-
- logging host configures the Syslog server’s IP.
- logging trap warnings ensures that only messages with a severity of warning (level 4) or higher are forwarded.
Step 2: Configure Syslog Server
Install a Syslog server (e.g., Syslog-ng, RSYSLOG, Graylog). Configure the server to receive and store logs from optical devices.
Example for RSYSLOG:
module(load="imudp")
input(type="imudp" port="514")
*.* /var/log/syslog
Step 3: Configure Log Rotation and Retention
Set up log rotation to manage disk space on the Syslog server. This ensures older logs are archived and only recent logs are stored for immediate access.
Syslog Advantages
Syslog offers several advantages for logging and network management:
- Simplicity: Syslog is easy to configure and use on most network and optical devices.
- Centralized Management: It allows for centralized log collection and analysis, simplifying network monitoring and troubleshooting.
- Wide Support: Syslog is supported across a wide range of devices, including network switches, routers, firewalls, and optical systems.
- Real-time Alerts: Syslog can provide real-time alerts for critical issues like hardware failures or signal degradation.
Syslog Disadvantages
Syslog also has some limitations:
- Lack of Reliability (UDP): If using UDP, Syslog messages can be lost during network congestion or failures. This can be mitigated by using TCP or Syslog over TLS.
- Unstructured Logs: Syslog messages can vary widely in format, which can make parsing and analyzing logs more difficult. However, structured Syslog (RFC 5424) addresses this issue.
- Scalability: In large networks with hundreds or thousands of devices, Syslog servers can become overwhelmed with log data. Solutions like log aggregation or log rotation can help manage this.
Syslog Use Cases
Syslog is widely used in various scenarios:
Network Device Monitoring
-
- Collect logs from routers, switches, and firewalls for real-time network monitoring.
- Detect issues such as link flaps, protocol errors, and device overloads.
Optical Transport Networks (OTN) Monitoring
-
- Track optical signal health, link integrity, and performance thresholds in DWDM systems.
- Generate alerts when signal degradation or failures occur on critical optical links.
Security Auditing
-
- Log security events such as unauthorized login attempts or firewall rule changes.
- Centralize logs for compliance with regulations like GDPR, HIPAA, or PCI-DSS.
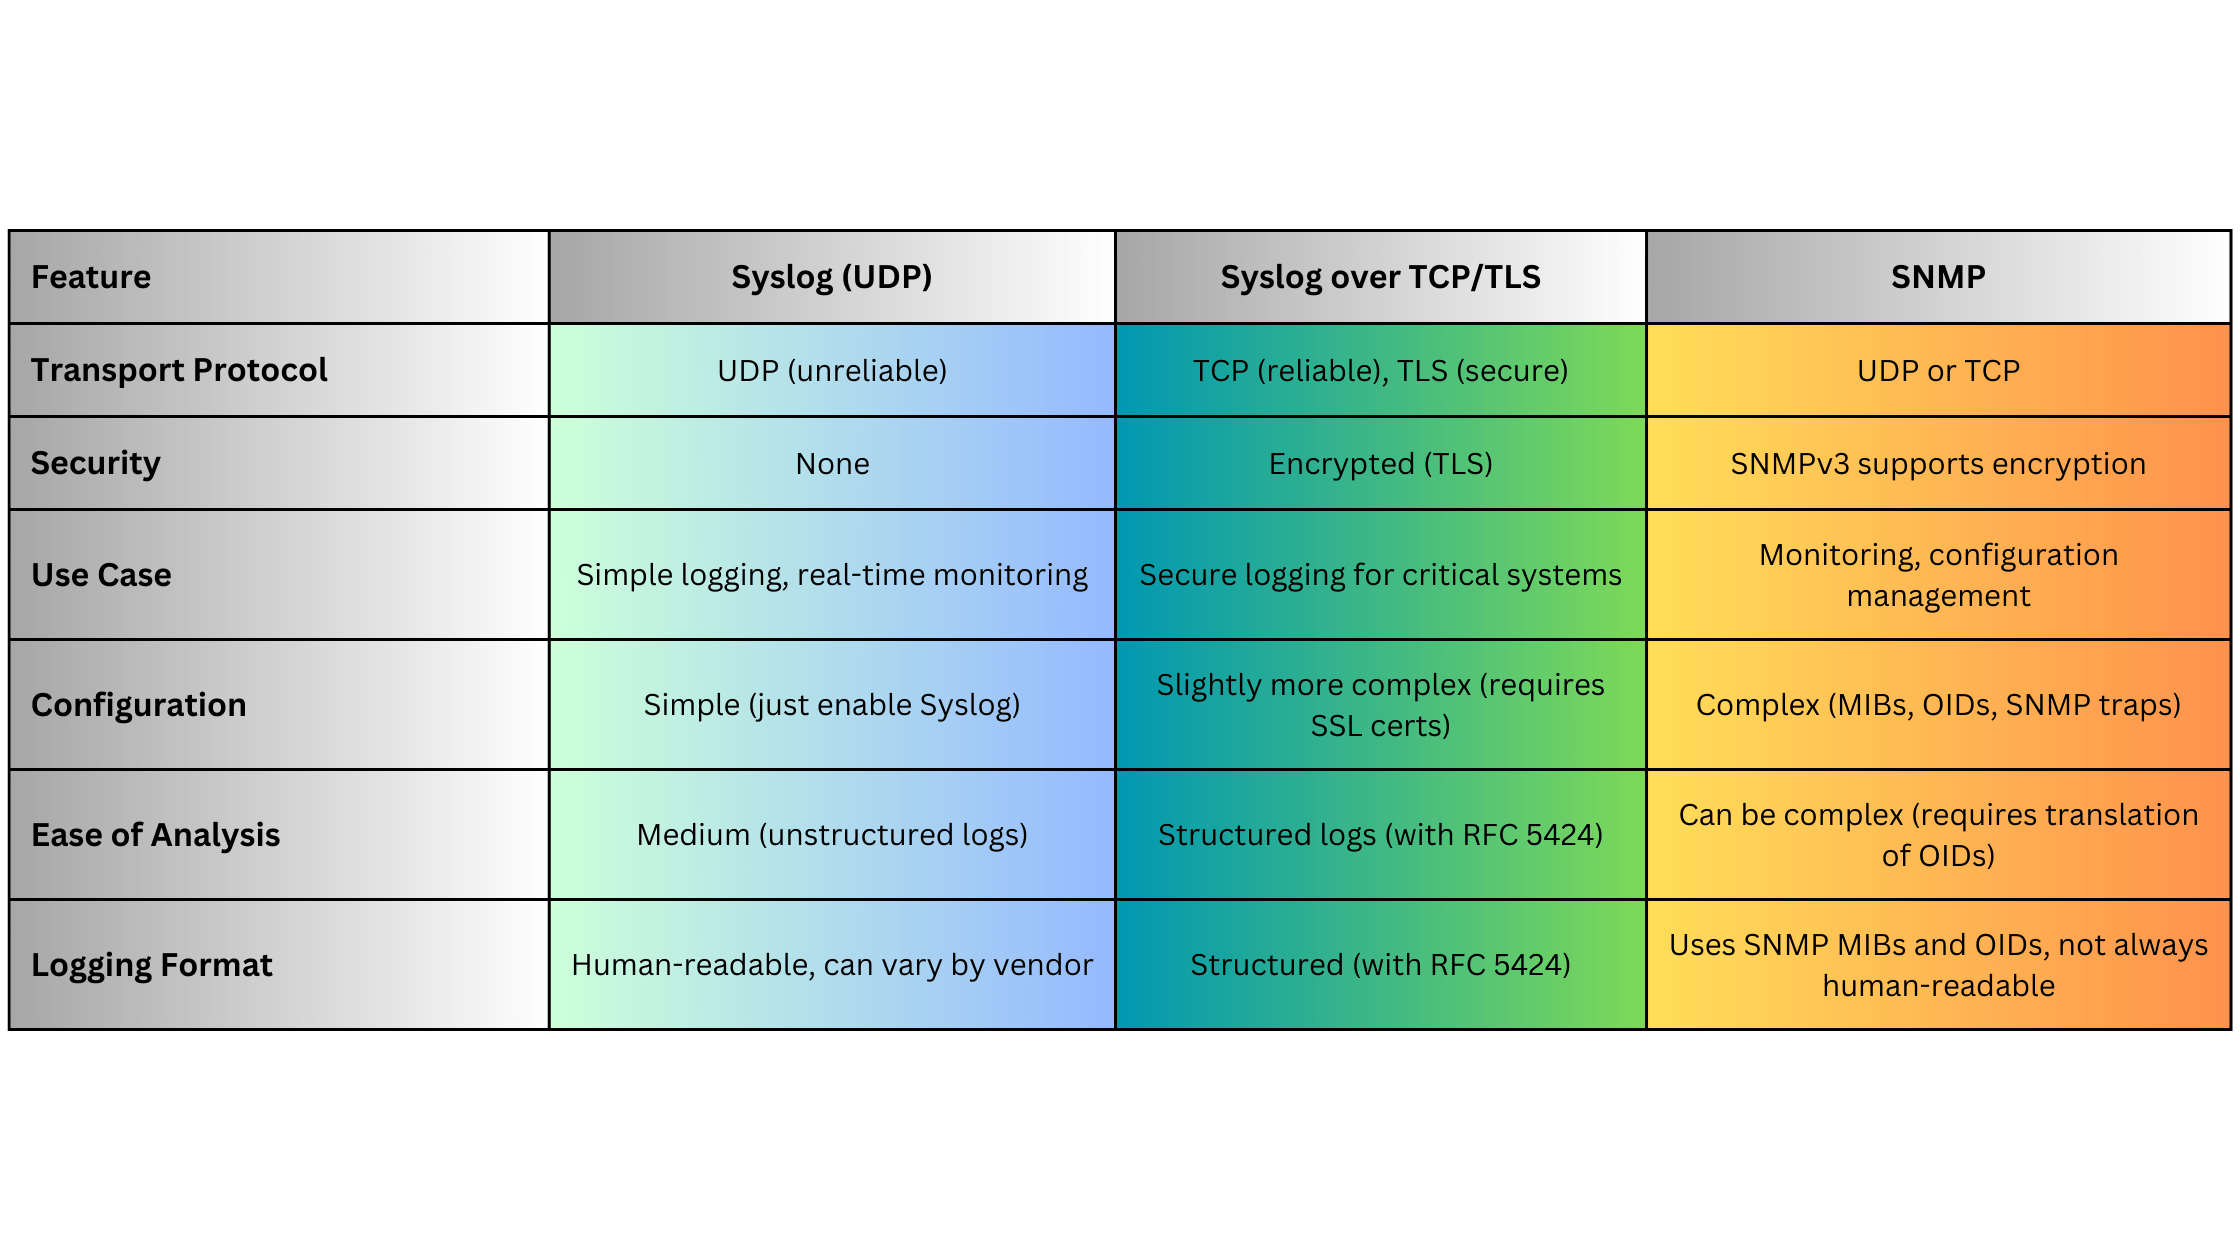
Syslog vs. Other Logging Protocols: A Quick Comparison
Syslog Use Case for Optical Networks
Imagine a scenario where an optical transport network (OTN) link begins to degrade due to a fiber issue:
- The OTN transponder detects a degradation in signal power.
- The device generates a Syslog message indicating the power level is below a threshold.
- The Syslog message is sent to a Syslog server for real-time alerting.
- The network administrator is notified immediately, allowing them to dispatch a technician to inspect the fiber and prevent downtime.
Example Syslog Message:
<27>Oct 13 14:10:45 OTN-Transponder-1 optical-link-3 signal degraded, power level -4.8dBm, threshold -4dBmSummary
Syslog remains one of the most widely-used protocols for logging and monitoring network and optical devices due to its simplicity, versatility, and wide adoption across vendors. Whether managing a large-scale DWDM system, monitoring OTNs, or tracking network security, Syslog provides an essential mechanism for real-time logging and event monitoring. Its limitations, such as unreliable delivery via UDP, can be mitigated by using Syslog over TCP or TLS in secure or mission-critical environments.