MapYourTech Complete Banner - Scoped CSS
Tag

raman

Browsing
Fundamentals of Noise Figure in Optical Amplifiers

Noise figure (NF) is a critical parameter in optical amplifiers that quantifies the degradation of signal-to-noise ratio during amplification. In multi-span optical networks, the accumulated noise from cascaded amplifiers ultimately determines system reach, capacity, and performance.

While amplifiers provide the necessary gain to overcome fiber losses, they inevitably add amplified spontaneous emission (ASE) noise to the signal. The noise contribution from each amplifier accumulates along the transmission path, with early-stage amplifiers having the most significant impact on the end-to-end system performance.

Understanding the noise behavior in cascaded amplifier chains is fundamental to optical network design. This article explores noise figure fundamentals, calculation methods, and the cumulative effects in multi-span networks, providing practical design guidelines for optimizing system performance.

Definition and Physical Meaning

Noise figure is defined as the ratio of the input signal-to-noise ratio (SNR) to the output SNR of an amplifier, expressed in decibels (dB):

NF = 10 log₁₀(SNRin / SNRout) dB

Alternatively, it can be expressed using the noise factor F (linear scale):

NF = 10 log₁₀(F) dB

In optical amplifiers, the primary noise source is amplified spontaneous emission (ASE), which originates from spontaneous transitions in the excited gain medium. Instead of being stimulated by the input signal, these transitions occur randomly and produce photons with random phase and direction.

Noise Figure Fundamentals Optical Amplifier Clean signal SNRin Signal + ASE noise SNRout ASE generation NF = 10 log₁₀(SNRin / SNRout) dB = 10 log₁₀(1 + PASE/(G·Psignal)) dB

Quantum Limit and Physical Interpretation

Even a theoretically perfect amplifier has a quantum-limited minimum noise figure of 3dB. This fundamental limit exists because the amplification process inherently introduces at least half a photon of noise per mode.

The noise figure is related to several physical parameters:

  • Spontaneous Emission Factor (nsp): Represents the quality of population inversion in the active medium
  • Population Inversion: The ratio of atoms in excited states versus ground states
  • Quantum Efficiency: How efficiently pump power creates population inversion
NF = 2·nsp·(1-1/G)

As gain (G) becomes large, this approaches: NF = 2·nsp, with a theoretical minimum of 3dB when nsp = 1.

Factors Affecting Noise Figure

Gain and Population Inversion

The population inversion level directly affects the noise figure. Higher inversion leads to lower ASE and therefore lower noise figure. Key relationships include:

  • Gain Level: Higher gain typically results in better inversion and lower NF up to a saturation point
  • Pump Power: Increased pump power improves inversion up to a saturation level
  • Gain Medium Length: Longer gain medium increases available gain but can increase NF if inversion is not maintained throughout

Input Power Dependence

Noise figure varies with input signal power:

  • At very low input powers, the gain can be higher but the effective NF may increase due to insufficient saturation
  • At high input powers, gain saturation occurs, leading to a higher effective NF
  • The optimal input power range for lowest NF is typically 10-15dB below the saturation input power
Noise Figure vs. Input Power Input Power (dBm) -30 -20 -10 0 +10 Noise Figure (dB) 4 5 6 7 8 9 High NF region (Low input power) Optimal operating region High NF region (Gain saturation)

Wavelength Dependence

Noise figure typically varies across the operating wavelength band:

  • The wavelength dependence follows the gain spectrum of the amplifier
  • In typical optical amplifiers, NF is often lowest near the peak gain wavelength
  • Edge wavelengths generally experience higher NF due to lower inversion and gain
  • This wavelength dependence can impact system design, especially for wideband applications

Temperature Effects

Temperature significantly impacts noise figure performance:

  • Higher temperatures typically increase NF due to reduced population inversion efficiency
  • Temperature-dependent cross-sections in the gain medium affect both gain and noise performance
  • Thermal management is critical for maintaining consistent NF performance, especially in high-power amplifiers

EDFA Specifications

In optical networks, various EDFA designs are available with specific noise figure performance characteristics:

Application Typical NF Range Typical Gain Range
Metro access 6.0-7.0dB 12-21dB
Metro/regional 5.5-6.5dB 14-22dB
Regional with mid-stage access 5.5-7.5dB 15-28dB
Long-haul with mid-stage access 5.0-7.0dB 25-37dB
Regional single-stage 5.0-6.0dB 15-28dB
Long-haul single-stage 5.0-6.0dB 25-37dB
Ultra-short span booster 15.0-17.0dB 5-7dB

Temperature Sensitivity

Noise figure is temperature sensitive, with performance typically degrading at higher temperatures due to:

  • Reduced pump efficiency
  • Changes in population inversion
  • Increased thermal noise contributions

Most optical amplifiers are designed to operate in accordance with standard telecom environmental specifications like ETS 300 019-1-3 Class 3.1E for environmental endurance.

Cascaded Amplifiers and Noise Accumulation

In optical networks, signals typically pass through multiple amplifiers as they traverse through fiber spans. Understanding how noise accumulates in these multi-span systems is critical for designing networks that meet performance requirements.

Friis' Formula and Cascaded Amplifier Systems

The noise accumulation in a chain of optical amplifiers follows Friis' formula, which was originally developed for electronic amplifiers but applies equally to optical systems:

Ftotal = F1 + (F2-1)/G1 + (F3-1)/(G1·G2) + ... + (Fn-1)/(G1·G2···Gn-1)

Where:

  • Ftotal is the total noise factor (linear, not in dB)
  • Fi is the noise factor of the i-th amplifier
  • Gi is the gain (linear) of the i-th amplifier

In optical systems, this formula must account for span losses between amplifiers:

Ftotal = F1 + (L1·F2-1)/G1 + (L1·L2·F3-1)/(G1·G2) + ...

Where Li represents the span loss (linear) between amplifiers i and i+1.

Cascaded Amplifier System Amp 1 NF₁ = 5dB Span 1 Loss = 20dB Amp 2 NF₂ = 5dB Span 2 Loss = 20dB Amp 3 NF₃ = 5dB Span N Amp N NFₙ = 5dB Accumulated Noise OSNR final ≈ P launch − L span − NF − 10log 10 (N) − 58

Key Insights from Friis' Formula

The most significant insight from Friis' formula is that the first amplifier has the most substantial impact on the overall noise performance. Each subsequent amplifier's noise contribution is reduced by the gain of all preceding amplifiers.

Practical implications include:

  • Always use the lowest noise figure amplifier at the beginning of a chain
  • The impact of noise figure improvements diminishes for amplifiers later in the chain
  • Pre-amplifiers are more critical for noise performance than boosters
  • Mid-stage components (like DCFs) should have minimal loss to preserve good noise performance

OSNR Evolution in Multi-span Systems

The optical signal-to-noise ratio (OSNR) evolution through a multi-span system can be approximated by:

OSNRdB ≈ Plaunch - α·L - NF - 10·log10(N) - 10·log10(Bref) + 58

Where:

  • Plaunch is the launch power per channel (dBm)
  • α is the fiber attenuation coefficient (dB/km)
  • L is the span length (km)
  • NF is the amplifier noise figure (dB)
  • N is the number of spans
  • Bref is the reference bandwidth for OSNR measurement (typically 0.1nm)
  • 58 is a constant that accounts for physical constants (h𝜈)

The key insight from this equation is that OSNR degrades by 3dB each time the number of spans doubles (10·log10(N) term). This creates a fundamental limit to transmission distance in amplified systems.

Practical Example: OSNR Calculation in a Multi-span System

Consider a 10-span system with the following parameters:

  • Launch power: +1dBm per channel
  • Span length: 80km
  • Fiber loss: 0.2dB/km (total span loss = 16dB)
  • Amplifier gain: 16dB (exactly compensating span loss)
  • Amplifier noise figure: 5dB
  • Reference bandwidth: 0.1nm (~12.5GHz at 1550nm)

Step 1: Calculate the OSNR for a single span:

OSNR1-span = +1 - 16 - 5 - 10·log10(1) - 10·log10(12.5) + 58
= +1 - 16 - 5 - 0 - 11 + 58 = 27dB

Step 2: Calculate the OSNR degradation due to multiple spans:

OSNR degradation = 10·log10(N) = 10·log10(10) = 10dB

Step 3: Calculate the final OSNR:

OSNR10-spans = OSNR1-span - 10·log10(N) = 27 - 10 = 17dB

With a typical OSNR requirement of 12-15dB for modern coherent transmission formats, this system has adequate margin for reliable operation. However, extending to 20 spans would reduce OSNR by another 3dB to 14dB, approaching the limit for reliable operation.

Multi-Stage Amplifier Design

Based on the principles of Friis' formula, multi-stage amplifiers with optimal noise performance typically follow a design where:

Multi-Stage Amplifier Design Optimal Design Low NF Pre-Amp Power Amp Component NF = 4.5dB G = 15dB Loss = 1dB NF = 6.5dB G = 15dB Impact if First Stage NF = 6.5dB: Overall NF increases by ~2dB Impact if Second Stage NF = 8.5dB: Overall NF increases by only ~0.2dB

Key design principles include:

  • Low-Noise First Stage: The first stage should be optimized for low noise figure, even at the expense of output power capability
  • Power-Optimized Second Stage: The second stage can focus on power handling and efficiency once the SNR has been established by the first stage
  • Minimal Mid-Stage Loss: Any passive components (filters, isolators, etc.) between stages should have minimal insertion loss to avoid degrading the noise performance

EDFA Models and Cascaded Performance

Various types of optical amplifiers are designed with cascaded performance in mind:

Type Mid-Stage Features Design Optimization
Variable gain with mid-stage access Mid-stage access for DCF Optimized for regional networks
High-gain variable gain with mid-stage access Mid-stage access for DCF Optimized for high-gain applications
Variable gain with mid-stage access
and C/T filters
Mid-stage access for DCF Optimized for high-power applications
with OSC handling

Typical mid-stage dispersion compensation fiber (DCF) parameters tracked in optical networks include dispersion value, PMD, and tilt, which are critical for maintaining overall system performance.

Automatic Laser Shutdown (ALS) and Safety

In high-power multi-span systems, safety mechanisms like Automatic Laser Shutdown (ALS) are implemented to prevent hazardous conditions during fiber breaks or disconnections:

  • ALS triggers when LOS (Loss Of Signal) is detected on a line port
  • During ALS, EDFAs are disabled except for periodic 30-second probing intervals at reduced power (20dBm)
  • Normal operation resumes only after signal restoration for at least 40 seconds

Modern optical amplifiers feature ALS functionality with configurable parameters to ensure both optimal performance and safety in cascaded environments.

Network Applications and Optimization Strategies for Optical Amplifiers

Different segments of optical networks have varying requirements for noise figure performance based on their application, reach requirements, and economic considerations.

Network Segment Requirements

Noise Figure Requirements by Network Segment Access Short reach High splitting loss Metro/Regional Medium reach Mixed node types Long-haul Extended reach Many cascaded amps Typical NF Req: 6-7 dB (Less critical) Typical NF Req: 5-6 dB (Balanced design) Typical NF Req: 4-5 dB (Highly critical) Design Focus: • Cost efficiency • Size/integration Design Focus: • Flexibility • Dynamic range Design Focus: • Minimal NF • Optimized cascade

Access Networks

Access networks are generally tolerant of higher noise figures (6-7dB) because:

  • They involve fewer amplifiers in cascade
  • They often operate with higher channel powers
  • Transmission distances are relatively short
  • Cost sensitivity is higher than performance optimization

Metro/Regional Networks

Metro and regional networks require balanced NF performance (5-6dB) with:

  • Good dynamic range to handle varying traffic patterns
  • Flexibility to support different node configurations
  • Moderate reach capabilities (typically 4-10 spans)
  • Reasonable cost-performance trade-offs

Long-haul Networks

Long-haul and submarine networks demand optimized low-NF designs (4-5dB) due to:

  • Large number of amplifiers in cascade (often 10-20+)
  • Need to maximize reach without electrical regeneration
  • Requirement to support advanced modulation formats
  • Justification for premium components due to overall system economics

Economic Implications of Noise Figure

Improving noise figure comes with cost implications that must be carefully evaluated:

NF Improvement Typical Cost Increase Performance Benefit Economic Justification
6.0dB → 5.5dB +5-10% ~10% reach increase Generally cost-effective
5.5dB → 5.0dB +10-15% ~10% reach increase Often justified for long-haul
5.0dB → 4.5dB +15-25% ~10% reach increase Specialty applications only
4.5dB → 4.0dB +30-50% ~10% reach increase Rarely justified economically

The economic tradeoffs include:

  • Capital vs. Operating Expenses: Higher-quality, lower-NF amplifiers cost more initially but may reduce the need for additional amplifier sites and regeneration points
  • Upgrade Paths: Better NF provides margin for future capacity upgrades with more advanced modulation formats
  • Lifecycle Considerations: Premium amplifiers may maintain better performance over their operational lifetime, delaying replacement needs
  • System Capacity: Improved NF can enable higher capacity through better OSNR margin, often at lower cost than adding new fiber routes

Operational Optimization Strategies

For system operators using EDFAs, several practical optimization strategies can help maximize performance:

1. Gain Optimization

Modern optical amplifiers support different operation modes with specific gain management approaches:

  • Automatic Mode: Maintains output power per channel based on saturation power and maximum channel count settings
  • Semi-automatic Mode: Maintains a fixed output power per channel
  • Constant Gain Mode: Maintains a fixed gain regardless of input power variations
  • Automatic Power Control (APC) Mode: Provides automatic power control for specialized applications
  • Automatic Current Control (ACC) Mode: Provides precise pump current control for specialized applications

Advanced amplifiers implement specific algorithms for gain control that include careful monitoring of required gain versus actual gain, with alarms for out-of-range or out-of-margin conditions.

2. Tilt Management

Spectral tilt management is crucial for maintaining consistent OSNR across all channels:

  • Modern EDFAs automatically adjust tilt to compensate for fiber and component tilt
  • SRS (Stimulated Raman Scattering) tilt compensation is included for high-power systems
  • Built-in tilt values are stored in amplifier memory and used as reference points
  • For ultra-short span boosters and extended C-band amplifiers, specialized tilt algorithms account for fiber type

3. Temperature Control

Optical amplifiers typically specify operational temperature ranges in accordance with telecom standards like ETS 300 019-1-3 Class 3.1E, emphasizing the importance of controlling environmental conditions to maintain optimal performance.

4. Fiber Plant Optimization

Several fiber plant parameters impact noise figure performance:

  • Span Loss: Monitored and alarmed when outside expected range
  • Mid-stage Loss: For dual-stage amplifiers, carefully managed for optimal performance
  • Transmission Fiber Type: Configuration option that affects SRS tilt compensation
  • DCF Parameters: Dispersion, PMD, and tilt tracked in network control protocols

Noise Figure Design Guidelines

  1. Place Highest Quality First: Always use the lowest noise figure amplifiers at the beginning of the chain where they have the most impact
  2. Budget Wisely: Budget 0.5-1.0dB extra margin for each amplifier to account for aging and temperature variations over the system lifetime
  3. Consider Total Cost: Evaluate the total cost impact of NF improvements, including reduced regeneration needs and extended reach capabilities
  4. Monitor Trends: Establish baseline NF measurements and monitor for gradual degradation that might indicate pump laser aging
  5. Balance Requirements: Balance NF with other parameters like output power, gain flatness, and dynamic range based on specific application needs
  6. Test Under Load: Validate NF performance under realistic channel loading conditions, not just with a single test wavelength

Future Trends in Noise Figure Technology

Future Trends in Noise Figure Technology AI-Optimized Amplifiers Machine Learning Parameter Optimization Advanced Materials Novel Dopants & Co-dopants Engineered Glass Structures Integrated Photonics On-Chip Amplification Hybrid Integration Quantum Approaches Quantum-Enhanced Amplification Phase-Sensitive Designs

Emerging technologies for noise figure optimization include:

  • AI-Driven Optimization: Machine learning algorithms that dynamically adjust amplifier parameters based on real-time network conditions
  • Advanced Material Science: New dopant materials and glass compositions that enable better population inversion and reduced spontaneous emission
  • Integrated Photonics: Silicon photonics and other integrated platforms that combine amplification with filtering and control functions
  • Quantum-Enhanced Amplification: Phase-sensitive amplification and other quantum approaches that can theoretically break the 3dB quantum noise limit
  • Distributed Intelligence: Network-wide optimization that coordinates multiple amplifiers for global noise minimization

EDFA Implementation Examples

Metro Network Design

A typical metro network implementation might include:

  • Terminal nodes using fixed-gain boosters and pre-amplifiers
  • FOADM nodes using low-gain pre-amplifiers
  • Flexible OADM nodes employing medium-gain boosters

Regional Network Design

For regional networks, typical designs include:

  • Terminal nodes with AWG Mux/DeMux and EDFAs for amplification
  • Modern terminals with WSS for automatic equalization
  • ROADM nodes employing pre-amplifiers with mid-stage access for DCF compensation and boosters
  • In-line amplifier nodes (ILAN) using EDFAs to compensate for transmission fiber and DCF loss

Specialized Applications

Some specialized EDFA designs address unique requirements:

  • Ultra-short span boosters: Very high output power (26dBm) with narrow gain range (5-7dB)
  • High-power pre-amps: For ROADM applications with specialized eye-safety verification process
  • Pluggable EDFAs: For applications requiring compact, modular amplification in form factors like CFP2

Conclusion

Noise figure is a fundamental parameter that sets ultimate performance limits for optical amplifier systems. Modern EDFA families demonstrate a comprehensive approach to addressing various network requirements with optimized designs for different applications.

Key takeaways include:

  • Noise figure quantifies an amplifier's SNR degradation, with a quantum-limited minimum of 3dB
  • In cascaded configurations, noise accumulates according to Friis' formula, with early-stage amplifiers having the most significant impact
  • Network operators can optimize NF through proper pump power settings, gain optimization, temperature control, and careful wavelength planning
  • Multi-stage designs with low-NF first stages offer the best overall performance for critical applications
  • Economic considerations must balance the additional cost of lower-NF amplifiers against improved system reach and capacity

The evolution of EDFA technology reflects the ongoing refinement of noise figure optimization techniques, with newer designs and features continually addressing the evolving requirements of optical networks.

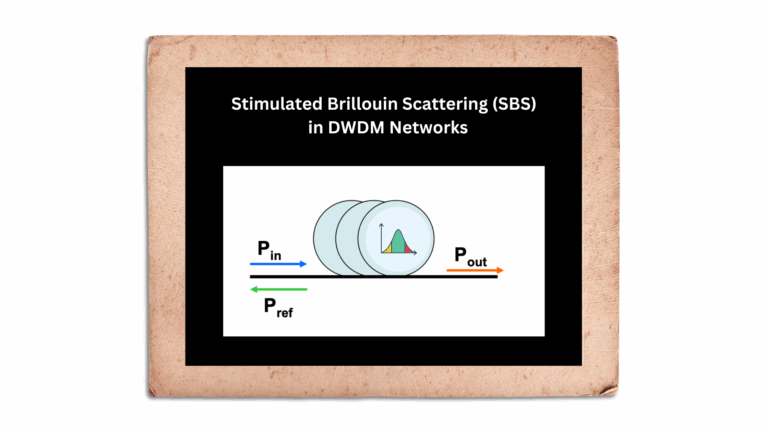
Stimulated Brillouin Scattering (SBS) is an inelastic scattering phenomenon that results in the backward scattering of light when it interacts with acoustic phonons (sound waves) in the optical fiber. SBS occurs when the intensity of the optical signal reaches a certain threshold, resulting in a nonlinear interaction between the optical field and acoustic waves within the fiber. This effect typically manifests at lower power levels compared to other nonlinear effects, making it a significant limiting factor in optical communication systems, particularly those involving long-haul transmission and high-power signals.

Mechanism of SBS

SBS is caused by the interaction of an incoming photon with acoustic phonons in the fiber material. When the intensity of the light increases beyond a certain threshold, the optical signal generates an acoustic wave in the fiber. This acoustic wave, in turn, causes a periodic variation in the refractive index of the fiber, which scatters the incoming light in the backward direction. This backscattered light is redshifted in frequency due to the Doppler effect, with the frequency shift typically around 10 GHz (depending on the fiber material and the wavelength of light).

The Brillouin gain spectrum is relatively narrow, with a typical bandwidth of around 20 to 30 MHz. The Brillouin threshold power Pth can be calculated as:

Pth=21AeffgBLeff

Where:

  • Aeff is the effective area of the fiber core,
  • gB is the Brillouin gain coefficient,
  • Leff is the effective interaction length of the fiber.

When the power of the incoming light exceeds this threshold, SBS causes a significant amount of power to be reflected back towards the source, degrading the forward-propagating signal and introducing power fluctuations in the system.

Image credit: corning.com

Impact of SBS in Optical Systems

SBS becomes problematic in systems where high optical powers are used, particularly in long-distance transmission systems and those employing Wavelength Division Multiplexing (WDM). The main effects of SBS include:

  1. Power Reflection:
    • A portion of the optical power is scattered back towards the source, which reduces the forward-propagating signal power. This backscattered light interferes with the transmitter and receiver, potentially causing signal degradation.
  2. Signal Degradation:
    • SBS can cause signal distortion, as the backward-propagating light interferes with the incoming signal, leading to fluctuations in the transmitted power and an increase in the bit error rate (BER).
  3. Noise Increase:
    • The backscattered light adds noise to the system, particularly in coherent systems, where phase information is critical. The interaction between the forward and backward waves can distort the phase and amplitude of the transmitted signal, worsening the signal-to-noise ratio (SNR).

SBS in Submarine Systems

In submarine communication systems, SBS poses a significant challenge, as these systems typically involve long spans of fiber and require high power levels to maintain signal quality over thousands of kilometers. The cumulative effect of SBS over long distances can lead to substantial signal degradation. As a result, submarine systems must employ techniques to suppress SBS and manage the power levels appropriately.

Mitigation Techniques for SBS

Several methods are used to mitigate the effects of SBS in optical communication systems:

  1. Reducing Signal Power:
    • One of the simplest ways to reduce the onset of SBS is to lower the optical signal power below the Brillouin threshold. However, this must be balanced with maintaining sufficient power for the signal to reach its destination with an acceptable signal-to-noise ratio (SNR).
  2. Laser Linewidth Broadening:
    • SBS is more efficient when the signal has a narrow linewidth. By broadening the linewidth of the signal, the power is spread over a larger frequency range, reducing the power density at any specific frequency and lowering the likelihood of SBS. This can be achieved by modulating the laser source with a low-frequency signal.
  3. Using Shorter Fiber Spans:
    • Reducing the length of each fiber span in the transmission system can decrease the effective length over which SBS can occur. By using optical amplifiers to boost the signal power at regular intervals, it is possible to maintain signal strength without exceeding the SBS threshold.
  4. Raman Amplification:
    • SBS can be suppressed using distributed Raman amplification, where the signal is amplified along the length of the fiber rather than at discrete points. By keeping the power levels low in any given section of the fiber, Raman amplification reduces the risk of SBS.

Applications of SBS

While SBS is generally considered a detrimental effect in optical communication systems, it can be harnessed for certain useful applications:

  1. Brillouin-Based Sensors:
    • SBS is used in distributed fiber optic sensors, such as Brillouin Optical Time Domain Reflectometry (BOTDR) and Brillouin Optical Time Domain Analysis (BOTDA). These sensors measure the backscattered Brillouin light to monitor changes in strain or temperature along the length of the fiber. This is particularly useful in structural health monitoring and pipeline surveillance.
  2. Slow Light Applications:
    • SBS can also be exploited to create slow light systems, where the propagation speed of light is reduced in a controlled manner. This is achieved by using the narrow bandwidth of the Brillouin gain spectrum to induce a delay in the transmission of the optical signal. Slow light systems have potential applications in optical buffering and signal processing.

Summary

Stimulated Brillouin Scattering (SBS) is a nonlinear scattering effect that occurs at relatively low power levels, making it a significant limiting factor in high-power, long-distance optical communication systems. SBS leads to the backscattering of light, which degrades the forward-propagating signal and increases noise. While SBS is generally considered a negative effect, it can be mitigated using techniques such as power reduction, linewidth broadening, and Raman amplification. Additionally, SBS can be harnessed for beneficial applications, including optical sensing and slow light systems. Effective management of SBS is crucial for maintaining the performance and reliability of modern optical communication networks, particularly in submarine systems.

  • Stimulated Brillouin Scattering (SBS) is a nonlinear optical effect caused by the interaction between light and acoustic waves in the fiber.
  • It occurs when an intense light wave traveling through the fiber generates sound waves, which scatter the light in the reverse direction.
  • SBS leads to a backward-propagating signal, called the Stokes wave, that has a slightly lower frequency than the incoming light.
  • The effect typically occurs in single-mode fibers at relatively low power thresholds compared to other nonlinear effects like SRS.
  • SBS can result in power loss of the forward-propagating signal as some of the energy is reflected back as the Stokes wave.
  • The efficiency of SBS depends on several factors, including the fiber length, the optical power, and the linewidth of the laser source.
  • In WDM systems, SBS can degrade performance by introducing signal reflections and crosstalk, especially in long-haul optical links.
  • SBS tends to become more pronounced in narrow-linewidth lasers and fibers with low attenuation, making it a limiting factor for high-power transmission.
  • Mitigation techniques for SBS include using broader linewidth lasers, reducing the optical power below the SBS threshold, or employing SBS suppression techniques such as phase modulation.
  • Despite its negative impacts in communication systems, SBS can be exploited for applications like distributed fiber sensing and slow-light generation due to its sensitivity to acoustic waves.

Reference

Stimulated Raman Scattering (SRS) is a nonlinear optical phenomenon that results from the inelastic scattering of photons when intense light interacts with the vibrational modes of the fiber material. This scattering process transfers energy from shorter-wavelength (higher-frequency) channels to longer-wavelength (lower-frequency) channels. In fiber optic communication systems, particularly in Wavelength Division Multiplexing (WDM) systems, SRS can significantly degrade system performance by inducing crosstalk between channels.

Physics behind SRS

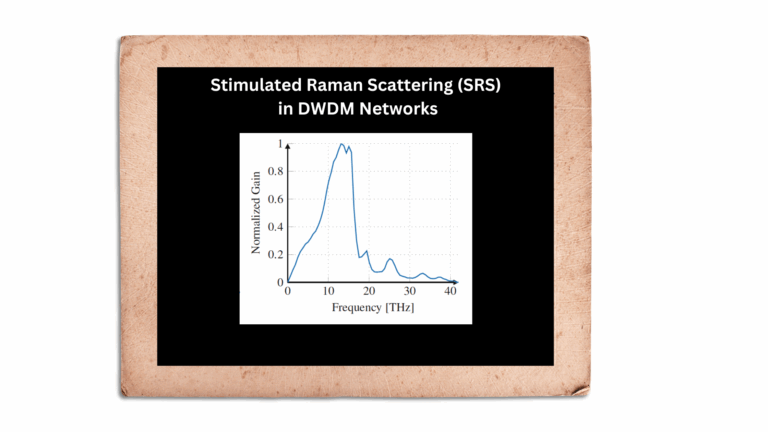
SRS is an inelastic process involving the interaction of light photons with the optical phonons (vibrational states) of the silica material in the fiber. When a high-power optical signal propagates through the fiber, a fraction of the power is scattered by the material, transferring energy from the higher frequency (shorter wavelength) channels to the lower frequency (longer wavelength) channels. The SRS gain is distributed over a wide spectral range, approximately 13 THz, with a peak shift of about 13.2 THz from the pump wavelength.

The basic process of SRS can be described as follows:

  • Stokes Shift: The scattered light is redshifted, meaning that the scattered photons have lower energy (longer wavelength) than the incident photons. This energy loss is transferred to the vibrational modes (phonons) of the fiber.
  • Amplification: The power of longer-wavelength channels is increased at the expense of shorter-wavelength channels. This power transfer can cause crosstalk between channels in WDM systems, reducing the overall signal quality.

Fig: Normalized gain spectrum generated by SRS on an SSMF fiber pumped at 1430 nm. The SRS gain spectrum has a peak at 13 THz with a bandwidth of 20–30 THz

The Raman gain coefficient gRdescribes the efficiency of the SRS process and is dependent on the frequency shift and the fiber material. The Raman gain spectrum is typically broad, extending over several terahertz, with a peak at a frequency shift of around 13.2 THz.

Mathematical Representation

The Raman gain coefficient gR varies with the wavelength and fiber properties. The SRS-induced power tilt between channels can be expressed using the following relation:

SRS tilt (dB)=2.17LeffAeffgRλPoutΔλWhere:

  • Leff is the effective length of the fiber,
  • Aeff is the effective core area of the fiber,
  • Pout is the output power,
  • Δλ is the wavelength bandwidth of the signal.

This equation shows that the magnitude of the SRS effect depends on the effective length, core area, and wavelength separation. Higher power, larger bandwidth, and longer fibers increase the severity of SRS.

Impact of SRS in WDM Systems

In WDM systems, where multiple wavelengths are transmitted simultaneously, SRS leads to a power transfer from shorter-wavelength channels to longer-wavelength channels. The main effects of SRS in WDM systems include:

  1. Crosstalk:
              • SRS causes power from higher-frequency channels to be transferred to lower-frequency channels, leading to crosstalk between WDM channels. This degrades the signal quality, particularly for channels with lower frequencies, which gain excess power, while higher-frequency channels experience a power loss.
  2. Channel Degradation:
            • The unequal power distribution caused by SRS degrades the signal-to-noise ratio (SNR) of individual channels, particularly in systems with closely spaced WDM channels. This results in increased bit error rates (BER) and degraded overall system performance.
  3. Signal Power Tilt:
            • SRS induces a power tilt across the WDM spectrum, with lower-wavelength channels losing power and higher-wavelength channels gaining power. This tilt can be problematic in systems where precise power levels are critical for maintaining signal integrity.

SRS in Submarine Systems

SRS plays a significant role in submarine optical communication systems, where long transmission distances and high power levels make the system more susceptible to nonlinear effects. In ultra-long-haul submarine systems, SRS-induced crosstalk can accumulate over long distances, degrading the overall system performance. To mitigate this, submarine systems often employ Raman amplification techniques, where the SRS effect is used to amplify the signal rather than degrade it.

Mitigation Techniques for SRS

Several techniques can be employed to mitigate the effects of SRS in optical communication systems:

  1. Channel Spacing:
            • Increasing the spacing between WDM channels reduces the interaction between the channels, thereby reducing the impact of SRS. However, this reduces spectral efficiency and limits the number of channels that can be transmitted.
  2. Power Optimization:
            • Reducing the launch power of the optical signals can limit the onset of SRS. However, this must be balanced with maintaining adequate signal power for long-distance transmission.
  3. Raman Amplification:
            • SRS can be exploited in distributed Raman amplification systems, where the scattered Raman signal is used to amplify longer-wavelength channels. By carefully controlling the pump power, SRS can be harnessed to improve system performance rather than degrade it.
  4. Gain Flattening Filters:
            • Gain-flattening filters can be used to equalize the power levels of WDM channels after they have been affected by SRS. These filters counteract the power tilt induced by SRS and restore the balance between channels.

Applications of SRS

Despite its negative impact on WDM systems, SRS can be exploited for certain beneficial applications, particularly in long-haul and submarine systems:

  1. Raman Amplification:
            • Raman amplifiers use the SRS effect to amplify optical signals in the transmission fiber. By injecting a high-power pump signal into the fiber, the SRS process can be used to amplify the lower-wavelength signal channels, extending the reach of the system.
  2. Signal Regeneration:
            • SRS can be used in all-optical regenerators, where the Raman scattering effect is used to restore the signal power and quality in long-haul systems.

Summary

Stimulated Raman Scattering (SRS) is a critical nonlinear effect in optical fiber communication, particularly in WDM and submarine systems. It results in the transfer of power from higher-frequency to lower-frequency channels, leading to crosstalk and power imbalance. While SRS can degrade system performance, it can also be harnessed for beneficial applications such as Raman amplification. Proper management of SRS is essential for optimizing the capacity and reach of modern optical communication systems, especially in ultra-long-haul and submarine networks​

  • Stimulated Raman Scattering (SRS) is a nonlinear effect that occurs when high-power light interacts with the fiber material, transferring energy from shorter-wavelength (higher-frequency) channels to longer-wavelength (lower-frequency) channels.
  • SRS occurs due to the inelastic scattering of photons, which interact with the vibrational states of the fiber material, leading to energy redistribution between wavelengths.
  • The SRS effect results in power being transferred from higher-frequency channels to lower-frequency channels, causing signal crosstalk and potential degradation.
  • The efficiency of SRS depends on the Raman gain coefficient, fiber length, power levels, and wavelength spacing.
  • SRS can induce signal degradation in WDM systems, leading to power imbalances and increased bit error rates (BER).
  • In submarine systems, SRS plays a significant role in long-haul transmissions, as it accumulates over long distances, further degrading signal quality.
  • Techniques like increasing channel spacing, optimizing signal power, and using Raman amplification can mitigate SRS.
  • Raman amplification, which is based on the SRS effect, can be used beneficially to boost signals over long distances.
  • Gain-flattening filters are used to balance the power across wavelengths affected by SRS, improving overall system performance.
  • SRS is particularly significant in long-haul optical systems but can also be harnessed for signal regeneration and amplification in modern optical communication systems.

Reference

  • https://link.springer.com/book/10.1007/978-3-030-66541-8 
  • Image : https://link.springer.com/book/10.1007/978-3-030-66541-8  (SRS)

RAMAN fiber links are widely used in the telecommunications industry to transmit information over long distances. They are known for their high capacity, low attenuation, and ability to transmit signals over hundreds of kilometers. However, like any other technology, RAMAN fiber links can experience issues that require troubleshooting. In this article, we will discuss the common problems encountered in RAMAN fiber links and how to troubleshoot them effectively.

Understanding RAMAN Fiber Links

Before we delve into troubleshooting, let’s first understand what RAMAN fiber links are. A RAMAN fiber link is a type of optical fiber that uses a phenomenon called Raman scattering to amplify light signals. When a light signal is transmitted through the fiber, some of the photons interact with the atoms in the fiber, causing them to vibrate. This vibration results in the creation of new photons, which have the same wavelength as the original signal but are out of phase with it. This process amplifies the original signal, allowing it to travel further without losing strength.

Common Issues with RAMAN Fiber Links

RAMAN fiber links can experience various issues that affect their performance. These issues include:

Loss of Signal

A loss of signal occurs when the light signal transmitted through the fiber is too weak to be detected by the receiver. This can be caused by attenuation or absorption of the signal along the fiber, or by poor coupling between the fiber and the optical components.

Signal Distortion

Signal distortion occurs when the signal is altered as it travels through the fiber. This can be caused by dispersion, which is the spreading of the signal over time, or by nonlinear effects, such as self-phase modulation and cross-phase modulation.

Signal Reflection

Signal reflection occurs when some of the signal is reflected back towards the source, causing interference with the original signal. This can be caused by poor connections or mismatches between components in the fiber link.

Troubleshooting RAMAN Fiber Links

Now that we have identified the common issues with RAMAN fiber links, let’s look at how to troubleshoot them effectively.

Loss of Signal

To troubleshoot a loss of signal, first, check the power levels at the transmitter and receiver ends of the fiber link. If the power levels are too low, increase them by adjusting the output power of the transmitter or by adding amplifiers to the fiber link. If the power levels are too high, reduce them by adjusting the output power of the transmitter or by attenuating the signal with a fiber attenuator.

If the power levels are within the acceptable range but the signal is still weak, check for attenuation or absorption along the fiber link. Use an optical time-domain reflectometer (OTDR) to measure the attenuation along the fiber link. If there is a high level of attenuation at a particular point, check for breaks or bends in the fiber or for splices that may be causing the attenuation.

Signal Distortion

To troubleshoot signal distortion, first, check for dispersion along the fiber link. Dispersion can be compensated for using dispersion compensation modules, which can be inserted into the fiber link at specific points.

If the signal distortion is caused by nonlinear effects, such as self-phase modulation or cross-phase modulation, use a spectrum analyzer to measure the spectral components of the signal. If the spectral components are broadened, this indicates the presence of nonlinear effects. To reduce nonlinear effects, reduce the power levels at the transmitter or use dispersion-shifted fiber, which is designed to minimize nonlinear effects.

Signal Reflection

To troubleshoot signal reflection, first, check for mismatches or poor connections between components in the fiber link. Ensure that connectors are properly aligned and that there are no gaps between the components. Use a visual fault locator (VFL) to identify any gaps or

scratches on the connector surface that may be causing reflection. Replace or adjust any components that are causing reflection to reduce interference with the signal.

Conclusion

Troubleshooting RAMAN fiber links can be challenging, but by understanding the common issues and following the appropriate steps, you can effectively identify and resolve any problems that arise. Remember to check power levels, attenuation, dispersion, nonlinear effects, and reflection when troubleshooting RAMAN fiber links.

FAQs

  1. What is a RAMAN fiber link? 
    A RAMAN fiber link is a type of optical fiber that uses Raman scattering to amplify light signals.

  2. What causes a loss of signal in RAMAN fiber links?
    A loss of signal can be caused by attenuation or absorption along the fiber or by poor coupling between components in the fiber link.

  3. How can I troubleshoot signal distortion in RAMAN fiber links?
    Signal distortion can be caused by dispersion or nonlinear effects. Use dispersion compensation modules to compensate for dispersion, and reduce power levels or use dispersion-shifted fiber to minimize nonlinear effects.

  4. How can I troubleshoot signal reflection in RAMAN fiber links?
    Signal reflection can be caused by poor connections or mismatches between components in the fiber link. Use a VFL to identify any gaps or scratches on the connector surface that may be causing reflection, and replace or adjust any components that are causing interference with the signal.

  5. What is an OTDR?
    An OTDR is an optical time-domain reflectometer used to measure the attenuation along a fiber link.

  6. Can RAMAN fiber links transmit signals over long distances?
    Yes, RAMAN fiber links are known for their ability to transmit signals over hundreds of kilometers.

  7. How do I know if my RAMAN fiber link is experiencing signal distortion?
    Signal distortion can cause the signal to be altered as it travels through the fiber. This can be identified by using a spectrum analyzer to measure the spectral components of the signal. If the spectral components are broadened, this indicates the presence of nonlinear effects.

  8. What is the best way to reduce signal reflection in a RAMAN fiber link?
    The best way to reduce signal reflection is to ensure that connectors are properly aligned and that there are no gaps between components. Use a VFL to identify any gaps or scratches on the connector surface that may be causing reflection, and replace or adjust any components that are causing interference with the signal.

  9. How can I improve the performance of my RAMAN fiber link?
    You can improve the performance of your RAMAN fiber link by regularly checking power levels, attenuation, dispersion, nonlinear effects, and reflection. Use appropriate troubleshooting techniques to identify and resolve any issues that arise.

  10. What are the advantages of using RAMAN fiber links?
    RAMAN fiber links have several advantages, including high capacity, low attenuation, and the ability to transmit signals over long distances without losing strength. They are widely used in the telecommunications industry to transmit information over large distances.


Background Information

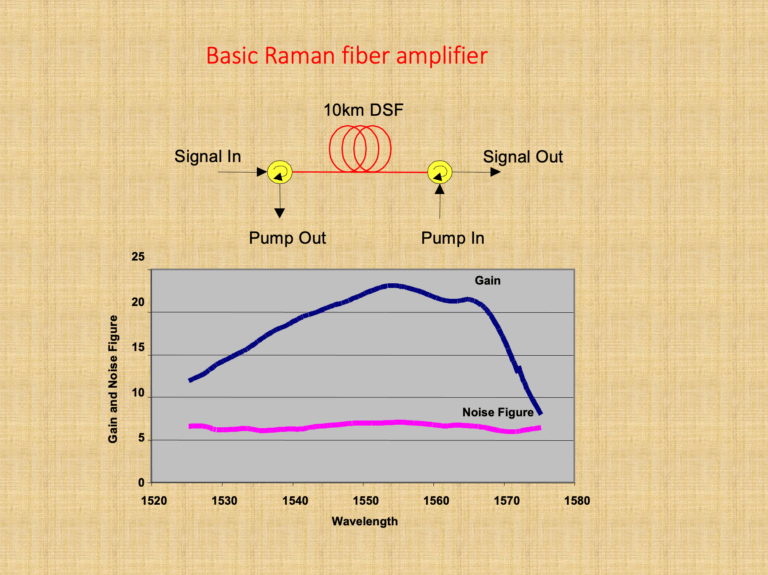
  1. The Raman amplifier is typically much more costly and has less gain than an Erbium Doped Fiber Amplifier (EDFA) amplifier. Therefore it is used only for speciality applications.
  2. The main advantage that this amplifier has over the EDFA is that it generates very less noise and hence does not degrade span Optical to Signal Noise Ratio (OSNR) as much as the EDFA.
  3. Its typical application is in EDFA spans where additional gain is required but the OSNR limit has been reached.
  4. Adding a Raman amplifier might not significantly affect OSNR, but can provide up to a 20dB signal gain.
  5. Another key attribute is the potential to amplify any fiber band, not just the C band as is the case for the EDFA. This allows for Raman amplifiers to boost signals in O, E, and S bands (for Coarse Wavelength Division Multiplexing (CWDM) amplification application).
  6. The amplifier works on the principle of Stimulated Raman Scattering (SRS), which is a nonlinear effect.
  7. It consists of a high-power pump laser and fiber coupler (optical circulator).
  8. The amplification medium is the span fiber in a Distributed Type Raman Amplifier (DRA).
  9. Distributed Feedback (DFB) laser is a narrow spectral bandwidth which is used as a safety mechanism for Raman Card. DFB sends pulse to check any back reflection that exists in the length of fiber. If no High Back Reflection (HBR) is found, Raman starts to transmit.
  10. Generally HBR is checked in initial few kilometers of fibers to first 20 Km. If HBR is detected, Raman will not work. Some fiber activity is needed after you find the problem area via OTDR.

Common Types of Raman Amplifiers

  • The lumped or discrete type Raman amplifier internally contains a sufficiently long spool of fiber where the signal amplification occurs.
  • The DRA pump laser is connected to the fiber span in either a counter pump (reverse pump) or a co-pump (forward pump) or configuration.
  • The counter pump configuration is typically preferred since it does not result in excessively high signal powers at the start of the fiber span, which can result in nonlinear distortions as shown in the image.

The advantage of the co-pump configurations is that it produces less noise.

Principle

As the pump laser photons propagate in the fiber, they collide and are absorbed by fiber molecules or atoms. This excites the molecules or atoms to higher energy levels. The higher energy levels are not stable states so they quickly decay to lower intermediate energy levels that release energy as photons in any direction at lower frequencies. This is known as spontaneous Raman scattering or Stokes scattering and contributes to noise in the fiber.

Since the molecules decay to an intermediate energy vibration level, the change in energy is less than the initial received energy at the time of molecule excitation. This change in energy from excited level to intermediate level determines the photon frequency since Δ f = Δ E / h. This is referred to as the Stokes frequency shift and determines the Raman gain versus frequency curve shape and location. The energy that remains from the intermediate level to ground level is dissipated as molecular vibrations (phonons) in the fiber. Since there exists a wide range of higher energy levels, the gain curve has a broad spectral width of approximately 30 THz.

At the time of the stimulated Raman scattering, signal photons co-propagate frequency gains curve spectrum, and acquires energy from the Stokes wave, that results in signal amplification.

Theory of Raman Gain

The Raman gain curve’s FWHM width is about 6THz (48 nm) with a peak at about 13.2THz under the pump frequency. This is the useful signal amplification spectrum. Therefore, in order to amplify a signal in the 1550 nm range the pump laser frequency is required to be 13.2THz below the signal frequency at about 1452 nm.


Multiple pump lasers with side-by-side gain curves are used to widen the total Raman gain curve.

Where fp = pump frequency, THz  fs = signal frequency, THz Δ f v = Raman Stokes frequency shift, THz.

Raman gain is the net signal gain distributed over the fiber’s effective length. It is a function of pump laser power, fiber effective length, and fiber area.

For fibers with a small effective area, such as in dispersion compensation fiber, Raman gain is higher. Gain is also dependent on the signal separation from the laser pump wavelength, Raman signal gain is also specified and field measured as on/off gain. This is defined as the ratio of the output signal power with the pump laser on and off. In most cases the Raman ASE noise has little effect on the measured signal value with the pump laser on. However, if there is considerable noise, which can be experienced when the measurement spectral width is large, then the noise power measured with the signal off  is subtracted from the pump on signal power in order to obtain an accurate on/off gain value. The Raman on/off gain is often referred to as the Raman gain.

Noise Sources

Noise created in a DRA span consists:

  • Amplified Spontaneous Emissions (ASE)
  • Double Rayleigh Scattering (DRS)
  • Pump Laser Noise

ASE noise is due to photon generation by spontaneous Raman scattering.

DRS noise occurs when twice reflected signal power due to Rayleigh scattering is amplified and interferes with the original signal as crosstalk noise.

The strongest reflections occur from connectors and bad splices.

Typically DRS noise is less than ASE noise, but for multiple Raman spans it can add up. In order to reduce this interference, Ultra Polish Connectors (UPC) or Angle Polish Connectors (APC) can be used. Optical isolators can be installed after the laser diodes in orer to reduce reflections into the laser. Also, span OTDR traces can help locate high-reflective events for repair.

Counter pump DRA configuration results in better OSNR performance for signal gains of 15 dB and greater. Pump laser noise is less of a concern because it usually is quite low with RIN of better than 160 dB/Hz.

Nonlinear Kerr effects can also contribute to noise due to the high laser pump power. For fibers with low DRS noise, the Raman noise figure due to ASE is much better than the EDFA noise figure. Typically, the Raman noise figure is –2 to 0 dB, which is about 6 dB better than the EDFA noise figure.

Raman amplifier noise factor is defined as the OSNR at the input of the amplifier to the OSNR at the output of the amplifier.

Noise figure is the dB version of noise factor.

The DRA noise and signal gain is distributed over the span fiber’s effective length.

Counter pump distributed Raman amplifiers are often combined with EDFA pre-amps to extend span distances. This hybrid configuration can provide 6dB improvement in the OSNR, which can significantly extend span lengths or increase span loss budget. Counter pump DRA can also help reduce nonlinear effects and allows for channel launch power reduction.

  Functional Block Diagram for CoPropagating and Counter Propagating Raman Amplifier

Field Deployment architecture of EDFA and RAMAN Amplifiers:

Interesting to know:

Related Information