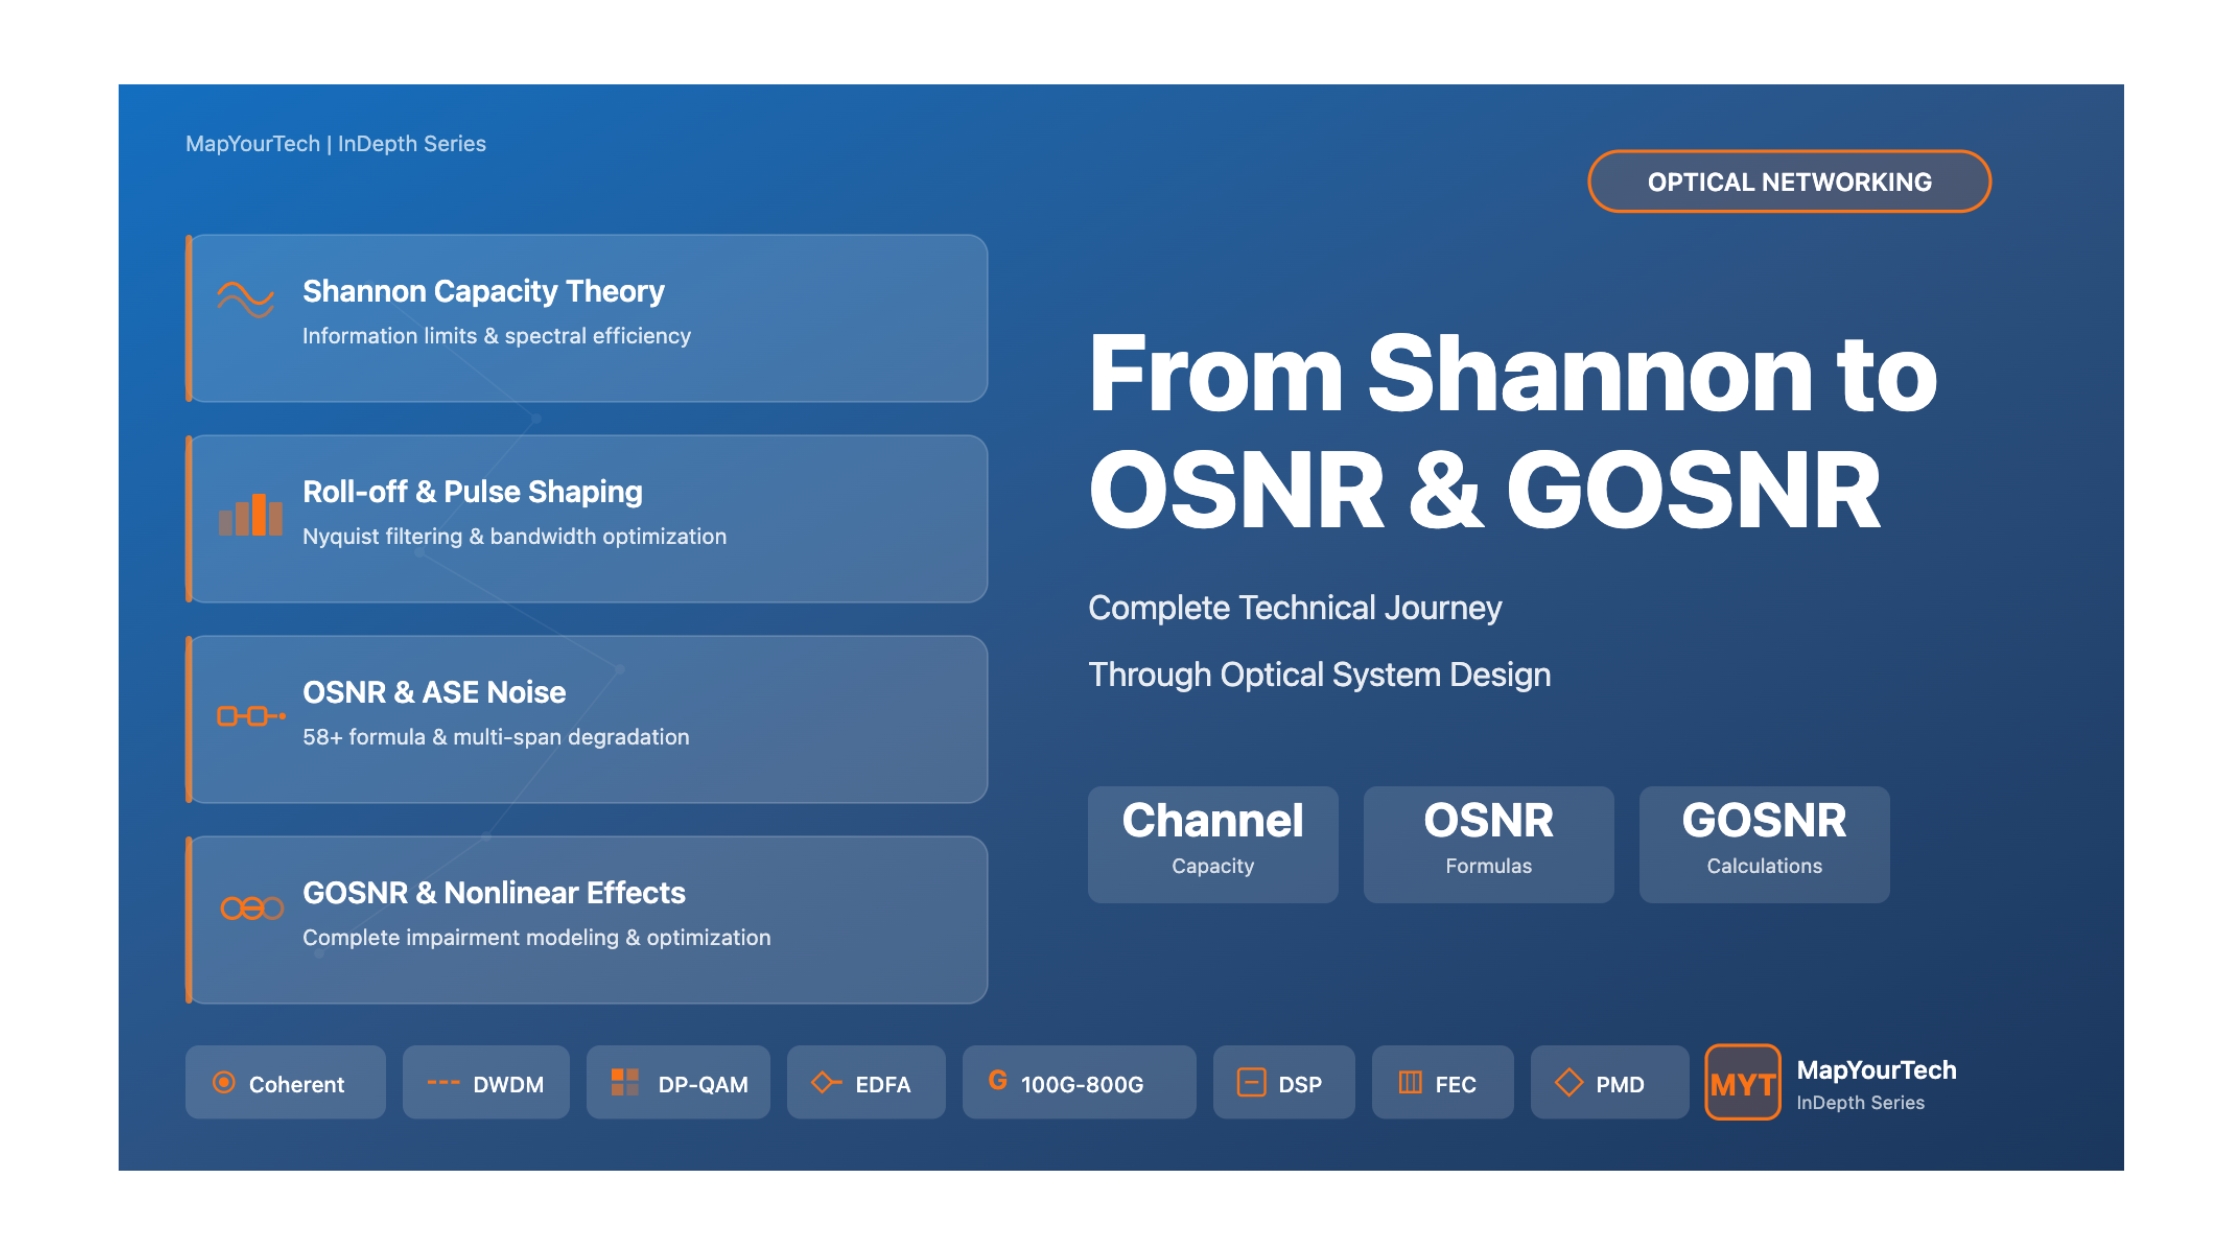
From Shannon Capacity to OSNR and GOSNR: A Complete Technical Journey for Optical Networking Professionals
Introduction
The design and optimization of modern optical communication networks require a deep understanding of fundamental capacity limits, signal quality metrics, and their interrelationships. From Claude Shannon's groundbreaking information theory to the practical implementation of Optical Signal-to-Noise Ratio (OSNR) measurements in Dense Wavelength Division Multiplexing (DWDM) systems, engineers must navigate through multiple layers of theoretical and practical considerations.
This article will cover all that is needed for Optical Networking Porfessionals to have full information on complete mathematical journey from Shannon's capacity theorem through Signal-to-Noise Ratio (SNR) requirements, roll-off factors, OSNR calculations using the 58+ formula method, and finally to Generalized OSNR (GOSNR) applications in real-world optical networks. Each section builds upon the previous, providing step-by-step derivations, practical examples, and implementation guidelines for optical network engineers and designers.
The evolution of these concepts reflects the progression from theoretical information limits to practical engineering constraints. Understanding this journey enables network designers to make informed decisions about modulation formats, amplifier spacing, channel counts, and overall system architecture that maximize network capacity while maintaining signal quality requirements. Most digital data transmitted worldwide travels through optical fiber networks, forming the backbone of national and international communication infrastructure. As data volumes continue to grow exponentially, understanding the fundamental limits and practical constraints of optical fiber capacity becomes increasingly critical.
1.1 Shannon's Channel Capacity Theorem: The Foundation
1.1.1 Historical Context and Significance
In 1948, Claude Shannon published "A Mathematical Theory of Communication" in the Bell System Technical Journal, establishing the fundamental limits of data transmission over noisy channels. Shannon's capacity theorem represents the theoretical maximum rate at which information can be transmitted with arbitrarily low error probability, given specific channel conditions. This theorem forms the cornerstone of all modern communication system design, including optical networks.
Shannon's work established that there exists a fundamental relationship between channel bandwidth, signal power, noise power, and achievable data rate. This relationship transcends any particular modulation scheme, coding technique, or implementation technology. It represents an absolute physical limit imposed by the laws of information theory and thermodynamics.
1.1.2 The Shannon Capacity Formula
The Shannon capacity formula for an additive white Gaussian noise (AWGN) channel is expressed as:
Where:
• C = Channel capacity (bits per second)
• B = Bandwidth (Hertz)
• SNR = Signal-to-Noise Ratio (linear scale, not dB)
• log₂ = Logarithm base 2
1.1.3 Step-by-Step Derivation and Understanding
To understand Shannon's formula deeply, we must examine each component and its physical meaning:
Step 1: Understanding Bandwidth (B)
Bandwidth represents the range of frequencies available for signal transmission. In optical systems, this is typically the channel spacing in DWDM systems. For example:
- Standard DWDM channel spacing: 50 GHz or 100 GHz
- Flexible grid systems: Variable bandwidth from 12.5 GHz to 150 GHz
- Ultra-wideband systems: May utilize the entire C-band (approximately 4 THz)
Step 2: Understanding SNR
Signal-to-Noise Ratio quantifies the quality of the received signal relative to background noise. In optical systems:
SNR (dB) = 10 × log₁₀(P_signal / P_noise)
Converting from dB to linear:
SNR_linear = 10^(SNR_dB / 10)
Step 3: Information Content per Symbol
The term log₂(1 + SNR) represents the maximum number of distinguishable information bits that can be encoded in each transmitted symbol. The "+1" accounts for the signal power itself, while SNR represents the additional discrimination capability provided by high signal quality. When SNR >> 1 (much greater than 1), the formula simplifies to approximately log₂(SNR), but the "+1" becomes critical at low SNR values.
1.1.4 Practical Example: Shannon Capacity Calculation
Example 1.1: Basic Shannon Capacity Calculation
Given Parameters:
- Bandwidth B = 10 GHz = 10 × 10⁹ Hz
- SNR = 20 dB
Step 1: Convert SNR from dB to linear scale
Step 2: Apply Shannon formula
C = 10 × 10⁹ × log₂(1 + 100)
C = 10 × 10⁹ × log₂(101)
C = 10 × 10⁹ × 6.658 bits/second
C ≈ 66.58 Gbps
Result: The theoretical maximum capacity for this channel is approximately 66.58 Gbps. However, this is an absolute upper bound. Practical systems achieve 60-80% of this theoretical limit due to implementation constraints discussed later below.
1.1.5 Spectral Efficiency: Capacity Per Unit Bandwidth
In optical communications, we often work with spectral efficiency (SE), which normalizes capacity by bandwidth:
Where SE is measured in bits/second/Hz (bits/s/Hz)
Spectral efficiency represents how many bits of information can be transmitted per second for each Hertz of bandwidth. This metric is crucial for comparing different modulation formats and system architectures. Higher spectral efficiency means more data can be packed into the same bandwidth, enabling higher channel counts in DWDM systems.
Example 1.2: Spectral Efficiency for Different SNR Values
Calculate spectral efficiency for various SNR levels:
| SNR (dB) | SNR (linear) | SE (bits/s/Hz) | Practical Application |
|---|---|---|---|
| 10 | 10 | 3.46 | QPSK modulation |
| 15 | 31.62 | 5.03 | 8-QAM |
| 20 | 100 | 6.66 | 16-QAM |
| 25 | 316.23 | 8.31 | 64-QAM |
| 30 | 1000 | 9.97 | 256-QAM |
Observation: Each ~6 dB increase in SNR adds approximately 2 bits/s/Hz to spectral efficiency. This logarithmic relationship explains why achieving very high spectral efficiencies requires exponentially increasing SNR.
Optical Communication System Overview
1.2 From Shannon Capacity to SNR Requirements
1.2.1 Inverting Shannon's Formula
While Shannon's formula calculates maximum capacity given bandwidth and SNR, optical network design requires the inverse calculation: determining the required SNR to achieve a target data rate. This inversion provides critical design specifications for optical systems.
Solving for SNR:
C/B = log₂(1 + SNR)
2^(C/B) = 1 + SNR
SNR = 2^(C/B) - 1
Converting to dB:
SNR_dB = 10 × log₁₀(2^(C/B) - 1)
1.2.2 Spectral Efficiency and SNR Relationship
Spectral efficiency (SE), measured in bits/second/Hz, represents how efficiently a system uses available bandwidth:
Therefore:
SNR = 2^SE - 1
Or in dB:
SNR_dB = 10 × log₁₀(2^SE - 1)
Example 2.1: SNR Requirements for Different Spectral Efficiencies
Calculate required SNR for various spectral efficiency targets:
| Target SE (bits/s/Hz) | Calculation | SNR (linear) | SNR (dB) | SNR Increment (dB) |
|---|---|---|---|---|
| 2 | 2² - 1 | 3 | 4.77 | - |
| 4 | 2⁴ - 1 | 15 | 11.76 | +6.99 |
| 6 | 2⁶ - 1 | 63 | 17.99 | +6.23 |
| 8 | 2⁸ - 1 | 255 | 24.07 | +6.08 |
| 10 | 2¹⁰ - 1 | 1023 | 30.10 | +6.03 |
Key Observation: Each 2 bits/s/Hz increase in spectral efficiency requires approximately 6 dB additional SNR. This represents a 4× increase in signal power relative to noise, highlighting the exponential cost of achieving higher spectral efficiencies.
1.2.3 Dual-Polarization Systems: Doubling Capacity
Modern coherent optical systems exploit both orthogonal polarization states of light to effectively double the capacity without requiring additional bandwidth or SNR:
Effective spectral efficiency:
SE_dual = 2 × log₂(1 + SNR)
Dual-polarization transmission uses two independent data streams transmitted on X and Y polarization states, which are orthogonal and can be separated at the receiver using polarization-diverse coherent detection. This technique effectively doubles the information capacity without increasing bandwidth or power requirements.
Example 2.2: 100G DWDM Channel Design
Design Requirement: Achieve 100 Gbps in a 50 GHz channel spacing
Step 1: Determine required gross spectral efficiency
Assuming 20% FEC overhead: Gross rate = 100 / 0.8 = 125 Gbps
Available bandwidth: B = 50 GHz
Required SE_gross = 125 / 50 = 2.5 bits/s/Hz
Step 2: Account for dual polarization
SE per polarization = 2.5 / 2 = 1.25 bits/s/Hz
Step 3: Calculate theoretical SNR requirement
SNR = 2^1.25 - 1 = 2.38 - 1 = 1.38
SNR_dB = 10 × log₁₀(1.38) = 1.4 dB
Step 4: Add implementation margin
Shannon gap (practical vs. theoretical): ~6-8 dB
Implementation penalty: ~2 dB
FEC threshold: ~2-3 dB below ideal
Total required SNR: ~11-14 dB
Result: A practical 100G system using QPSK modulation requires approximately 11-14 dB SNR, significantly higher than the Shannon limit of 1.4 dB. This gap represents the cost of practical implementation constraints.
1.3 Modulation Formats and Shannon Limit Proximity
1.3.1 Modulation Order and Required SNR
Different modulation formats achieve different spectral efficiencies and require correspondingly different SNR levels. Understanding this relationship is crucial for selecting appropriate modulation formats for given link budgets.
| Modulation Format | Bits/Symbol | SE (DP) bits/s/Hz | Typical Required OSNR (dB) | Reach Category |
|---|---|---|---|---|
| DP-QPSK | 2 | 4 | 11-14 | Ultra-long-haul |
| DP-8QAM | 3 | 6 | 16-19 | Long-haul |
| DP-16QAM | 4 | 8 | 20-23 | Regional |
| DP-64QAM | 6 | 12 | 26-29 | Metro |
| DP-256QAM | 8 | 16 | 32-35 | Short-reach |
1.3.2 The Shannon Gap: Theory vs. Practice
The difference between Shannon's theoretical limit and practical system performance is called the "Shannon gap." Modern coherent systems with advanced forward error correction (FEC) can approach within 1-2 dB of the Shannon limit.
Where:
• SNR_practical = Actually required SNR for target BER
• SNR_Shannon = Theoretical minimum from Shannon formula
Modern systems achieve:
• Uncoded: 8-12 dB gap
• With standard FEC: 3-5 dB gap
• With advanced FEC: 1-2 dB gap
1.4 Practical Implementation Constraints
1.4.1 Factors Limiting Achievement of Shannon Capacity
Real-world optical systems cannot achieve Shannon's theoretical limit due to several practical constraints:
| Constraint Factor | Impact on Capacity | Typical Loss | Mitigation Strategy |
|---|---|---|---|
| Forward Error Correction (FEC) | Adds redundancy bits for error correction | 15-25% overhead | Use low-overhead FEC codes |
| Finite constellation size | Limited number of modulation states | 10-30% gap to Shannon | Probabilistic shaping |
| Phase noise | Laser linewidth and LO stability | 2-5% capacity reduction | Narrow-linewidth lasers, DSP |
| Nonlinear fiber effects | Signal distortion at high power | 5-15% capacity reduction | Power optimization, DBP |
| Polarization mode dispersion | Signal spreading in time domain | 2-8% capacity reduction | Adaptive equalization |
| Hardware imperfections | DAC/ADC resolution, imperfect equalization | 5-10% capacity reduction | Higher resolution components |
1.4.2 Capacity vs. Distance Trade-off
A fundamental trade-off exists between achievable capacity and transmission distance in optical networks. Higher-order modulation formats provide greater capacity but require higher OSNR, limiting transmission distance.
Example 3.1: Capacity-Distance Trade-off Analysis
Scenario: 80 km span length, 0.2 dB/km fiber loss, 5 dB amplifier NF
| Modulation | Capacity (Gbps) | Required OSNR (dB) | Max Spans | Max Distance (km) |
|---|---|---|---|---|
| DP-QPSK | 100 | 12 | 45 | 3600 |
| DP-8QAM | 150 | 17 | 30 | 2400 |
| DP-16QAM | 200 | 21 | 22 | 1760 |
| DP-64QAM | 300 | 27 | 13 | 1040 |
Key Insight: Tripling capacity from 100 Gbps to 300 Gbps reduces maximum reach by approximately 71% (from 3600 km to 1040 km). This illustrates the fundamental capacity-distance trade-off in optical networks.
2.1 The Need for Pulse Shaping
2.1.1 The Ideal vs. The Practical
In digital communications, information is transmitted as a sequence of symbols occurring at regular intervals defined by the symbol period T_s (or symbol rate R_s = 1/T_s). An ideal system would use rectangular pulses in the time domain, which correspond to a sinc function in the frequency domain with bandwidth exactly equal to the symbol rate (Nyquist bandwidth).
2.1.2 Nyquist's Criterion for Zero ISI
Harry Nyquist established that for zero inter-symbol interference at sampling instants, the combined transmit and receive filter frequency response must satisfy:
Where:
• H(f) = Combined frequency response of transmit and receive filters
• T_s = Symbol period
• k = Integer index
This criterion is satisfied by the ideal rectangular filter (brick-wall), but also by a family of more practical filters called raised-cosine filters, which introduce controlled excess bandwidth to enable practical implementation.
2.1.3 Raised Cosine Filters: The Practical Solution
The raised-cosine (RC) filter family provides a practical compromise between bandwidth efficiency and implementation feasibility. These filters have a frequency response that transitions smoothly from passband to stopband, rather than the abrupt cutoff of an ideal filter.
2.2 Mathematical Foundation of Roll-off Factor
2.2.1 Occupied Bandwidth with Roll-off
The roll-off factor directly impacts the relationship between symbol rate and occupied bandwidth:
Where:
• B_occupied = Total occupied bandwidth (Hz)
• R_symbol = Symbol rate (symbols/second or Baud)
• α = Roll-off factor (0 ≤ α ≤ 1)
Minimum (Nyquist) bandwidth: B_min = R_symbol (when α = 0)
Maximum practical bandwidth: B_max = 2 × R_symbol (when α = 1)
2.2.2 Raised Cosine Frequency Response
The raised-cosine filter has a specific mathematical form that ensures zero ISI at sampling instants:
For (1-α)/(2T_s) < |f| ≤ (1+α)/(2T_s): H_RC(f) = (T_s/2) × [1 + cos(πT_s/α × (|f| - (1-α)/(2T_s)))]
For |f| > (1+α)/(2T_s): H_RC(f) = 0 (stopband)
Interactive Roll-off Factor Demonstration
Explore how roll-off factor (α) affects pulse shaping in both frequency and time domains
Frequency Domain Response
Bandwidth: 1.35 × Rs
Spectral Efficiency: 74%
Transition Band: 35%
Time Domain Pulse Shape
Main Lobe Width: 2.7 Ts
Side Lobe Level: -25 dB
Zero Crossings: At ±Ts, ±2Ts...
Understanding the Trade-offs:
α = 0 (Ideal Nyquist): Perfect spectral efficiency with rectangular frequency response. Historically considered extremely challenging, but advanced DSP has made this achievable in cutting-edge systems.
Industry Achievement: Companies like Ciena have demonstrated near-perfect rectangular pulse shaping with their 1.6 Tb/s per wavelength technology using 200 GBaud at 200 GHz spectrum with edgeless clock recovery - achieving α ≈ 0 through advanced DSP algorithms and precise pulse shaping.
α = 0.05-0.15 (Ultra-efficient): Near-ideal spectral efficiency, requires state-of-the-art DSP, minimal guard bands - used in next-generation 800G/1.6T systems
α = 0.15-0.25 (Submarine/Long-haul): Excellent spectral efficiency with proven commercial implementations, requires sophisticated DSP
α = 0.35 (Balanced): Good efficiency with practical implementation complexity - common in terrestrial systems
α = 0.5-1.0 (Robust): Lower efficiency but faster roll-off, easier timing recovery, more tolerant to imperfections
2.2.3 Root Raised Cosine (RRC) Filters
Continue Reading This Article
Sign in with a free account to unlock the full article and access the complete MapYourTech knowledge base.
In practical coherent optical systems, the pulse shaping is split between transmitter and receiver, each using a root raised-cosine (RRC) filter. When cascaded, these produce the desired raised-cosine response:
This splitting provides:
• Matched filtering for optimal SNR
• Equal shaping at TX and RX
• Minimized ISI with practical filters
2.3 Impact of Roll-off on System Performance
2.3.1 Spectral Efficiency vs. Implementation Complexity Trade-off
The choice of roll-off factor creates a fundamental trade-off in optical system design:
| Roll-off (α) | Occupied BW | Spectral Efficiency | Filter Complexity | Timing Sensitivity | Typical Application |
|---|---|---|---|---|---|
| 0.01 | 1.01 × R_s | Highest (99% of ideal) | Very High (500+ taps) | Very High | Dense metro DWDM |
| 0.1 | 1.1 × R_s | High (91% of ideal) | High (200-300 taps) | High | Nyquist-WDM systems |
| 0.2 | 1.2 × R_s | Good (83% of ideal) | Moderate (100-150 taps) | Moderate | Long-haul terrestrial |
| 0.35 | 1.35 × R_s | Standard (74% of ideal) | Moderate (50-80 taps) | Moderate | Standard coherent |
| 0.5 | 1.5 × R_s | Lower (67% of ideal) | Low (30-50 taps) | Low | Regional networks |
2.3.2 Channel Spacing Implications
In DWDM systems, the roll-off factor determines minimum channel spacing to avoid inter-channel interference:
Standard practice includes 10% guard band:
Δf_channel = 1.1 × R_symbol × (1 + α)
Example 3.1: Channel Spacing for 64-GBaud System
Given: Symbol rate = 64 GBaud
| Roll-off (α) | Occupied BW (GHz) | With 10% Guard (GHz) | Standard Grid Match |
|---|---|---|---|
| 0.01 | 64.64 | 71.1 | 75 GHz flex-grid |
| 0.1 | 70.4 | 77.4 | 87.5 GHz flex-grid |
| 0.2 | 76.8 | 84.5 | 87.5 GHz flex-grid |
| 0.35 | 86.4 | 95.0 | 100 GHz standard |
Design Impact: Lower roll-off factors enable tighter channel spacing, potentially increasing total system capacity by 15-25%. However, α < 0.1 requires significantly more complex and expensive digital filter implementations, with DSP complexity increasing roughly as 1/α.
2.3.3 Effective Spectral Efficiency with Roll-off
Roll-off affects achievable spectral efficiency by increasing the occupied bandwidth for a given information rate:
For dual-polarization systems:
SE_effective = (2 × bits_per_symbol) / (1 + α)
Required SNR including roll-off impact:
SNR_required = 2^(SE_effective) - 1
Example 3.2: Roll-off Impact on DP-16QAM System
System Parameters:
- Modulation: DP-16QAM (4 bits/symbol × 2 polarizations = 8 bits)
- Symbol rate: 64 GBaud
- Target gross rate: 512 Gbps
Case 1: α = 0.01 (Nearly Nyquist)
Occupied BW = 64 × 1.01 = 64.64 GHz
SE_effective = 8 / 1.01 = 7.92 bits/s/Hz
Shannon SNR = 2^7.92 - 1 = 243 (linear) = 23.9 dB
Practical SNR requirement: ~28-29 dB
Case 2: α = 0.35 (Standard)
Occupied BW = 64 × 1.35 = 86.4 GHz
SE_effective = 8 / 1.35 = 5.93 bits/s/Hz
Shannon SNR = 2^5.93 - 1 = 60.7 (linear) = 17.8 dB
Practical SNR requirement: ~22-23 dB
Trade-off Analysis:
- Bandwidth savings: α = 0.01 uses 25% less bandwidth than α = 0.35
- SNR penalty: α = 0.01 requires ~6 dB more SNR for the same error rate
- Complexity cost: α = 0.01 requires ~10× more DSP resources
- System choice: Use α = 0.01 when bandwidth is constrained; use α = 0.35 when OSNR is limiting
2.4 Transition from SNR to OSNR
2.4.1 SNR vs OSNR: Critical Distinctions
While Shannon's theorem uses electrical SNR at the detector, optical systems are characterized by Optical Signal-to-Noise Ratio (OSNR). Understanding the relationship between these metrics is essential for system design.
- SNR (Electrical): Measured at the receiver after photodetection, in the electrical domain. Depends on the electrical bandwidth of the receiver.
- OSNR (Optical): Measured in the optical domain before photodetection. Referenced to a standard optical bandwidth (typically 12.5 GHz or 0.1 nm).
- Conversion: The relationship depends on signal bandwidth, receiver bandwidth, and detection type (direct vs. coherent).
2.4.2 OSNR Definition and Measurement
OSNR is defined as the ratio of signal power to noise power within a specified reference bandwidth:
In dB:
OSNR_dB = 10 × log₁₀(P_signal / P_noise)
Where:
• P_signal = Optical signal power (typically in mW or dBm)
• P_noise = ASE noise power in reference bandwidth B_ref
• B_ref = 12.5 GHz (equivalent to 0.1 nm at 1550 nm)
2.4.3 Relationship Between SNR and OSNR for Coherent Systems
For coherent detection systems with ideal receivers, the relationship between electrical SNR and optical OSNR is:
Or equivalently:
OSNR = (B_signal / B_ref) × SNR
Where:
• B_signal = Signal bandwidth = R_s × (1 + α) for single polarization
• B_ref = Reference bandwidth = 12.5 GHz
• For dual-polarization: B_signal_total = 2 × R_s × (1 + α)
Example 4.1: OSNR Requirement Calculation
System Specification:
- Modulation: DP-QPSK (2 bits/symbol × 2 polarizations)
- Symbol rate: 32 GBaud
- Roll-off factor: α = 0.2
- Target electrical SNR: 12 dB (for BER = 10⁻³ before FEC)
Step 1: Calculate signal bandwidth
B_signal = R_s × (1 + α) = 32 × 1.2 = 38.4 GHz
Step 2: Convert SNR to linear scale
SNR_linear = 10^(12/10) = 15.85
Step 3: Calculate required OSNR
OSNR = (B_signal / B_ref) × SNR
OSNR = (38.4 / 12.5) × 15.85 = 48.7 (linear)
OSNR_dB = 10 × log₁₀(48.7) = 16.9 dB
Step 4: Add system margins
Implementation penalty: +3 dB
FEC threshold: +2 dB
System margin: +3 dB
Total required OSNR: 16.9 + 8 = 24.9 dB ≈ 25 dB
Result: This DP-QPSK system requires approximately 25 dB OSNR at the receiver input for reliable operation with adequate margin.
2.5 Selecting Optimal Roll-off Factor
2.5.1 Application-Specific Considerations
The choice of roll-off factor involves balancing multiple competing requirements based on network application:
| Network Segment | Primary Constraint | Optimal α Range | Reasoning |
|---|---|---|---|
| Next-Gen Ultra-High Capacity | Maximum spectral efficiency | 0.0 - 0.05 | State-of-the-art DSP enables near-ideal Nyquist; demonstrated in 800G/1.6T systems (e.g., 200 GBaud at 200 GHz) |
| Submarine Systems | Maximize capacity | 0.1 - 0.15 | Bandwidth extremely valuable; high DSP cost acceptable |
| Long-haul Terrestrial | Balance capacity and reach | 0.15 - 0.25 | Moderate bandwidth optimization with acceptable OSNR penalty |
| Metro/Regional | Cost optimization | 0.2 - 0.35 | OSNR abundant; prefer lower DSP complexity |
| Data Center Interconnect | Maximum capacity | 0.05 - 0.15 | Short reach with excellent OSNR; maximize bits/s/Hz |
2.5.2 Design Guidelines and Best Practices
- When bandwidth-limited: Choose lowest practical α (0.05-0.15), accept higher SNR requirement and DSP cost
- When OSNR-limited: Choose higher α (0.25-0.35), reduce SNR requirement at cost of bandwidth
- When cost-constrained: Use standard α = 0.35, minimize DSP complexity
- For flexibility: Implement adaptive α, adjust based on link conditions
Real-World Achievement: Near-Ideal Nyquist Pulse Shaping
Ciena's 1.6 Tb/s per Wavelength Technology
Modern optical systems have achieved what was once considered nearly impossible - near-perfect rectangular pulse shaping approaching α ≈ 0. Key specifications of advanced commercial implementations:
- Data Rate: 1.6 Tb/s per wavelength
- Symbol Rate: 200 GBaud
- Spectrum Utilization: 200 GHz occupied bandwidth
- Spectral Efficiency: ~8 bits/s/Hz (approaching theoretical maximum)
- Roll-off Factor: α ≈ 0 (near-rectangular frequency response)
- Key Technology: Edgeless clock recovery with advanced DSP algorithms
Technical Achievement:
This represents a breakthrough in pulse shaping technology. The near-rectangular frequency response (α ≈ 0) means the system achieves maximum spectral efficiency with minimal guard bands between channels. The "edgeless clock recovery" technique allows robust timing extraction even with extremely sharp frequency roll-offs, solving the classical problem of timing sensitivity in near-Nyquist systems.
Practical Bandwidth Calculation:
For 200 GBaud at α ≈ 0:
B_occupied = R_s × (1 + α) = 200 × (1 + 0) ≈ 200 GHz
This achieves the theoretical minimum bandwidth, maximizing capacity within fixed spectrum allocations.
Impact on Network Design:
This technology enables tighter channel spacing in DWDM systems, increasing total fiber capacity from typical 80-96 channels to 120+ channels in the C-band, while maintaining robust performance through sophisticated digital equalization.
3.1 Optical Amplifiers and ASE Noise
3.1.1 Erbium-Doped Fiber Amplifiers (EDFAs)
Erbium-Doped Fiber Amplifiers are the workhorses of modern optical networks, providing optical gain to compensate for fiber loss without optical-electrical-optical conversion. However, they introduce noise through the fundamental quantum mechanical process of spontaneous emission.
3.1.2 ASE Noise Power Spectral Density
The ASE noise power spectral density generated by a single EDFA is given by:
Where:
• n_sp = Spontaneous emission factor (population inversion parameter)
• G = Amplifier gain (linear scale)
• h = Planck's constant = 6.626 × 10⁻³⁴ J·s
• ν = Optical frequency (Hz) ≈ 193.4 THz at 1550 nm
Total ASE Power in Bandwidth B_ref (Both Polarizations):
P_ASE = 2 × n_sp × (G - 1) × h × ν × B_ref
The factor of 2 accounts for two orthogonal polarization modes
3.1.3 Noise Figure and Spontaneous Emission Factor
The amplifier noise figure (NF) is directly related to the spontaneous emission factor:
Or inversely:
n_sp = 10^(NF_dB / 10) / 2
For an ideal amplifier: n_sp = 1 → NF = 3 dB
Practical EDFAs: n_sp = 1.5-2.5 → NF = 4.8-7 dB
Typical commercial EDFAs: NF = 5-6 dB → n_sp ≈ 1.6-2.0
3.2 The 58+ Formula for OSNR Calculation
3.2.1 Derivation of the 58+ Formula
The "58+ formula" is an elegant simplification that allows rapid OSNR calculation directly from amplifier output power and noise figure. The constant 58 arises from fundamental physical constants at typical optical wavelengths.
For standard reference bandwidth B_ref = 12.5 GHz (0.1 nm at 1550 nm):
OSNR_dB = P_out_dBm + 58 - NF_dB - 10.97
OSNR_dB ≈ P_out_dBm + 47 - NF_dB
Where:
• P_out_dBm = Amplifier output power in dBm
• NF_dB = Amplifier noise figure in dB
• The constant 58 = 10×log₁₀(h×ν/1mW) at 1550 nm
3.2.2 Practical Application of 58+ Formula
Example 2.1: Single Amplifier OSNR Calculation
Given Parameters:
- Amplifier output power per channel: P_out = 0 dBm
- Amplifier noise figure: NF = 5.5 dB
- Reference bandwidth: B_ref = 12.5 GHz (0.1 nm)
Step 1: Apply the 58+ formula
OSNR = P_out + 58 - NF - 10×log₁₀(12.5)
OSNR = 0 + 58 - 5.5 - 10.97
OSNR = 41.53 dB
Step 2: Verify using first principles
n_sp = 10^(5.5/10) / 2 = 3.548 / 2 = 1.774
G = span_loss = 16 dB = 39.81 (linear)
P_ASE = 2 × 1.774 × 38.81 × 6.626×10⁻³⁴ × 193.4×10¹² × 12.5×10⁹
P_ASE = 7.06 × 10⁻⁶ W = -51.5 dBm
OSNR = P_signal - P_ASE = 0 - (-51.5) = 41.5 dB ✓
Result: The 58+ formula provides the same result as the detailed calculation, confirming its accuracy and utility for rapid OSNR estimation.
3.3 Multi-Span OSNR Accumulation
3.3.1 Cascaded Amplifier OSNR Degradation
In multi-span optical links, ASE noise accumulates from each amplifier in the chain. For N identical amplifiers with equal spacing and perfect gain compensation, the total accumulated ASE noise power is:
In dB form:
OSNR_N_spans = OSNR_single - 10×log₁₀(N)
Simplified 58+ formula for N spans:
OSNR_N = P_out + 58 - NF - 10×log₁₀(N) - 10×log₁₀(B_ref/1GHz)
Key insight: OSNR degrades by approximately 3 dB for each doubling of spans
Deep Dive: Understanding the OSNR Degradation Formula
Why does OSNR_out = OSNR_in - 10×log₁₀(N)? Let's understand the physics and mathematics.
The Core Concept
This formula describes how OSNR degrades when an optical signal passes through N identical amplifier spans. It's one of the most fundamental relationships in optical link design and reveals a critical insight: signal power is restored at each amplifier, but noise accumulates linearly.
What Happens at Each Amplifier?
Signal Power (P_s)
• After fiber span: P_s × (1/L) = P_s/L
• After EDFA: (P_s/L) × G = P_s
→ Signal restored to original level
ASE Noise Power
• Fresh noise added at each EDFA
• P_ASE = 2×n_sp×(G-1)×h×ν×B_ref
→ Constant amount added each time
Key Insight: Linear Accumulation
| After Span | Signal Power | Total Noise Power | OSNR |
|---|---|---|---|
| Span 1 | P_s | 1 × P_ASE | P_s / P_ASE |
| Span 2 | P_s | 2 × P_ASE | P_s / (2×P_ASE) |
| Span 3 | P_s | 3 × P_ASE | P_s / (3×P_ASE) |
| Span N | P_s | N × P_ASE | P_s / (N×P_ASE) |
Mathematical Derivation
Step 1: OSNR after 1 span
OSNR₁ = P_s / P_ASE
Step 2: OSNR after N spans
OSNR_N = P_s / (N × P_ASE)
= (1/N) × (P_s / P_ASE)
= (1/N) × OSNR₁
Step 3: Convert to dB scale
OSNR_N (dB) = 10×log₁₀(OSNR_N)
= 10×log₁₀((1/N) × OSNR₁)
= 10×log₁₀(1/N) + 10×log₁₀(OSNR₁)
= -10×log₁₀(N) + OSNR₁ (dB)
= OSNR₁ (dB) - 10×log₁₀(N)
Conclusion: Every time you double the number of spans (N → 2N), you lose exactly 3 dB of OSNR because 10×log₁₀(2) = 3.01 dB
Practical Examples
Example 1: Impact of Span Doubling
Starting OSNR: 42 dB after 1 span
After 2 spans: 42 - 10×log₁₀(2) = 42 - 3.01 = 38.99 dB
After 4 spans: 42 - 10×log₁₀(4) = 42 - 6.02 = 35.98 dB
After 8 spans: 42 - 10×log₁₀(8) = 42 - 9.03 = 32.97 dB
Pattern: Each doubling costs exactly 3 dB!
Example 2: Common Span Counts
| Spans (N) | 10×log₁₀(N) | OSNR Penalty | Final OSNR |
|---|---|---|---|
| 1 | 0.0 dB | 0.0 dB | 42.0 dB |
| 2 | 3.0 dB | 3.0 dB | 39.0 dB |
| 4 | 6.0 dB | 6.0 dB | 36.0 dB |
| 10 | 10.0 dB | 10.0 dB | 32.0 dB |
| 20 | 13.0 dB | 13.0 dB | 29.0 dB |
| 50 | 17.0 dB | 17.0 dB | 25.0 dB |
| 100 | 20.0 dB | 20.0 dB | 22.0 dB |
Note: Starting from OSNR₁ = 42 dB (typical for well-designed single-span systems)
Why Linear Accumulation? The Physics
ASE noise from different amplifiers is incoherent, meaning:
- Random phase relationship between noise from different amplifiers
- Random polarization states
- Statistically independent noise sources
Therefore, noise powers add directly (not amplitudes):
P_noise_total = P_ASE₁ + P_ASE₂ + ... + P_ASE_N
= N × P_ASE (if all amplifiers identical)
Important Assumptions
This formula assumes:
- All amplifiers are identical (same gain, noise figure)
- All spans are identical (same loss)
- Perfect gain compensation (G = L at each stage)
- Negligible nonlinear effects
- No inline optical filters
For non-uniform systems, each amplifier's contribution must be calculated individually.
Critical Design Implications
1. OSNR Limits System Reach
Design Question: If DP-16QAM requires OSNR ≥ 20 dB, what's the maximum reach?
Starting from OSNR₁ = 42 dB:
Max spans = 10^((42-20)/10) = 10^2.2 = 158 spans
At 80 km/span → Max reach = 12,640 km
2. Modulation Format vs. Distance Trade-off
| Format | Required OSNR | Max Spans | Max Distance (80km spans) |
|---|---|---|---|
| DP-QPSK | 12 dB | ~1000 spans | ~80,000 km |
| DP-8QAM | 17 dB | ~316 spans | ~25,000 km |
| DP-16QAM | 21 dB | ~126 spans | ~10,000 km |
| DP-64QAM | 27 dB | ~32 spans | ~2,500 km |
3. Why Long-Haul Systems Use Lower-Order Modulation
Real-World Example: 2000 km terrestrial link
Number of spans: 2000 km ÷ 80 km = 25 spans
OSNR penalty: 10×log₁₀(25) = 14.0 dB
Final OSNR: 42 - 14 = 28 dB
Modulation Decision:
✓ DP-16QAM (needs 21 dB): Margin = 28 - 21 = 7 dB → Good choice
✗ DP-64QAM (needs 27 dB): Margin = 28 - 27 = 1 dB → Insufficient
MapYourTech Insight: The Power of 10×log₁₀(N)
The formula OSNR_out = OSNR_in - 10×log₁₀(N) tells us:
- OSNR degrades logarithmically with span count
- 3 dB penalty per doubling of spans (fundamental limit)
- Linear noise accumulation in power domain
- Fundamental limit on system reach for any modulation
- Trade-off driver between distance and modulation order
This simple formula is one of the most powerful tools in optical link design - it immediately tells you how many spans you can afford for a given OSNR requirement!
3.3.2 Non-Uniform Span Lengths
Real networks often have non-uniform span lengths due to geographical constraints. For such systems, we must calculate OSNR contributions from each amplifier individually and sum the noise powers:
OSNR_total = P_out + 58 - 10×log₁₀(Σ 10^((NF + Lᵢ - 58)/10)) - 10×log₁₀(B_ref/1GHz)
Or step-by-step:
1. Calculate each amplifier's ASE contribution
2. Sum all noise powers (linear scale)
3. Convert total noise to dB and subtract from signal
Example 3.1: Multi-Span OSNR Calculation
System Specification:
- Number of spans: N = 20
- Span length: 80 km each
- Fiber loss: 0.2 dB/km → 16 dB per span
- EDFA output power: 0 dBm per channel
- EDFA noise figure: 5.5 dB
- Reference bandwidth: 12.5 GHz
Step 1: Calculate single-span OSNR
OSNR₁ = 0 + 58 - 5.5 - 10.97 = 41.53 dB
Step 2: Calculate multi-span degradation
Degradation = 10×log₁₀(20) = 13.01 dB
Step 3: Calculate final OSNR
OSNR₂₀ = 41.53 - 13.01 = 28.52 dB
Step 4: Verify against requirements
For DP-QPSK: Required OSNR ≈ 12 dB
Available margin = 28.52 - 12 = 16.52 dB ✓ Excellent!
For DP-16QAM: Required OSNR ≈ 21 dB
Available margin = 28.52 - 21 = 7.52 dB ✓ Good
For DP-64QAM: Required OSNR ≈ 27 dB
Available margin = 28.52 - 27 = 1.52 dB ✗ Insufficient
Conclusion: This 20-span, 1600 km system can support DP-16QAM with adequate margin but cannot reliably support DP-64QAM. To use higher-order modulation, the system would need reduced span count, lower noise figure amplifiers, or higher launch power.
4.1 Limitations of Traditional OSNR
4.1.1 What OSNR Doesn't Capture
Traditional OSNR, calculated using the 58+ formula, only accounts for Amplified Spontaneous Emission (ASE) noise. It assumes a linear system where signal and noise propagate independently. However, real optical fibers are nonlinear media, and several additional impairments degrade signal quality:
4.2 Generalized OSNR (GOSNR) Framework
4.2.1 GOSNR Definition and Mathematical Formulation
GOSNR treats all impairments as equivalent noise sources that degrade the effective signal-to-noise ratio. The key insight is that impairments can be converted to "equivalent OSNR" values that represent their impact on signal quality.
Or in dB form:
GOSNR_dB = -10×log₁₀[10^(-OSNR_ASE/10) + 10^(-OSNR_NL/10) + 10^(-OSNR_PMD/10) + ...]
Where:
• OSNR_ASE = Traditional linear OSNR from amplifier noise
• OSNR_NL = Equivalent OSNR from nonlinear interference
• OSNR_PMD = Equivalent OSNR from polarization mode dispersion
• OSNR_CD = Equivalent OSNR from residual chromatic dispersion
• OSNR_other = Other impairments (filters, cross-talk, etc.)
4.2.2 Component-by-Component GOSNR Evolution
Understanding how GOSNR changes as signals propagate through different network elements is crucial for system design:
| Network Element | Effect on Signal | Effect on ASE | Effect on NLI | Net GOSNR Change |
|---|---|---|---|---|
| Transmission Fiber | Decreases (loss) | Proportional decrease | Increases (generation) | GOSNR_out < GOSNR_in |
| EDFA | Increases (gain) | Increases + adds new ASE | Proportional increase | GOSNR_out < GOSNR_in |
| Passive Component (ROADM, Filter) | Decreases (loss) | Proportional decrease | Proportional decrease | GOSNR unchanged |
| Dispersion Compensating Fiber (DCF) | Decreases (loss) | Proportional decrease | Can increase (nonlinearity) | Usually degrades GOSNR |
4.3 Fiber Nonlinearities and Nonlinear Interference
4.3.1 Types of Fiber Nonlinearities
Fiber nonlinearities arise from the intensity-dependent refractive index of silica fiber, described by the nonlinear coefficient γ (gamma). The main nonlinear effects are:
4.3.2 Nonlinear Phase Shift and Power Optimization
The accumulated nonlinear phase shift through a fiber span is a key parameter for quantifying nonlinear effects:
Where:
• γ = Nonlinear coefficient ≈ 1.2-1.4 W⁻¹km⁻¹ for SSMF
• P = Channel power (Watts)
• L_eff = Effective length ≈ (1 - e^(-α×L)) / α
• N_spans = Number of fiber spans
• α = Fiber attenuation coefficient (Np/km)
Typical values:
• For 0 dBm launch power in 80 km span: φ_NL ≈ 0.024 rad/span
• For acceptable performance: φ_NL < 1 radian total
• Critical threshold: φ_NL ≈ 1.5 rad → significant degradation
4.3.3 Gaussian Noise (GN) Model for NLI
The Gaussian Noise model treats nonlinear interference as additive Gaussian noise, enabling calculation of equivalent OSNR:
Simplified form:
OSNR_NL_dB ≈ P_ch_dBm - 20×log₁₀(N_ch) - 10×log₁₀(N_spans) - K
Where:
• η ≈ 1.27 W⁻² km⁻¹ for SSMF (system-dependent constant)
• P_ch = Power per channel
• N_ch = Number of WDM channels
• B_ch = Channel bandwidth
• K = System constant (typically -25 to -35 dB)
Key insight: NLI scales as P³ and N_ch², making it dominant at high powers and dense spacing
4.4 Other Impairments Contributing to GOSNR
4.4.1 Polarization Mode Dispersion (PMD)
PMD arises from random birefringence in optical fiber, causing different propagation speeds for orthogonal polarizations:
Where:
• DGD = Differential Group Delay
• PMD_parameter ≈ 0.05-0.5 ps/√km (fiber-dependent)
• L = Total fiber length in km
PMD-induced OSNR penalty:
Penalty_dB ≈ 10×log₁₀[1 + (2π × DGD × R_s / √12)²]
Design guideline: DGD < 10% of symbol period for <0.5 dB penalty
4.4.2 Residual Chromatic Dispersion
Even with DSP compensation, residual dispersion can degrade performance:
Typical tolerances:
• Coherent systems with DSP: D_res < 5000 ps/nm
• High-performance systems: D_res < 1000 ps/nm
• Advanced equalization: D_res < 100 ps/nm
Penalty increases rapidly beyond tolerance limits
4.4.3 Complete GOSNR Calculation Example
Example 4.1: Complete GOSNR Analysis for 400G System
System Specification:
- Modulation: DP-16QAM, 64 GBaud
- Distance: 800 km (10 spans × 80 km)
- Channel power: 0 dBm
- Amplifier NF: 5.5 dB
- Fiber: SSMF, γ = 1.3 W⁻¹km⁻¹, PMD = 0.1 ps/√km
- Number of channels: 80 (C-band)
Step 1: Calculate linear OSNR (ASE only)
OSNR_ASE = 0 + 58 - 5.5 - 10×log₁₀(10) - 10.97
OSNR_ASE = 41.5 - 10.0 = 31.5 dB
Step 2: Calculate nonlinear penalty
L_eff = (1 - e^(-0.046×80)) / 0.046 ≈ 20 km
φ_NL = 1.3 × 0.001 × 20 × 10 = 0.26 rad
NL_penalty ≈ 10×log₁₀(1 + 0.26²) ≈ 0.3 dB
OSNR_NL_equivalent ≈ 31.5 - 0.3 = 31.2 dB
Step 3: Calculate PMD penalty
DGD = 0.1 × √800 = 2.83 ps
Symbol period = 1/64 = 15.6 ps
DGD/T_s = 2.83/15.6 = 18% → moderate impact
PMD_penalty ≈ 0.4 dB
OSNR_PMD_equivalent ≈ 31.5 - 0.4 = 31.1 dB
Step 4: Account for other impairments
CD residual, filters, transceiver: ~0.5 dB combined
OSNR_other_equivalent ≈ 31.0 dB
Step 5: Calculate GOSNR
1/GOSNR = 1/10^3.15 + 1/10^3.12 + 1/10^3.11 + 1/10^3.10
1/GOSNR = 1/1413 + 1/1318 + 1/1288 + 1/1259
1/GOSNR = 0.000708 + 0.000759 + 0.000776 + 0.000794 = 0.003037
GOSNR = 329 → 25.2 dB
Step 6: Verify against requirements
| Linear OSNR (ASE only): | 31.5 dB |
| GOSNR (all impairments): | 25.2 dB |
| Total penalty: | 6.3 dB |
| Required for DP-16QAM: | ~21 dB |
| Available margin: | 4.2 dB |
Conclusion: The system has 4.2 dB margin above requirements. The 6.3 dB difference between linear OSNR and GOSNR shows why traditional OSNR alone is insufficient—ignoring nonlinear and other effects would give a misleadingly optimistic assessment.
5.1 System Design Workflow and Methodology
5.1.1 Complete Design Process Flowchart
5.2 Example 1: Long-Haul Terrestrial 400G System
5.2.1 System Requirements
Design Specification: Long-Haul Terrestrial Network
Requirements:
- Total capacity: 400 Gbps per wavelength
- Total distance: 2,000 km
- Span length: 80 km (typical terrestrial)
- Number of channels: 80 (C-band, 50 GHz spacing)
- Availability target: 99.99% (52 minutes downtime/year)
- Fiber type: Standard Single-Mode Fiber (SSMF)
- Amplifiers: Commercial EDFAs, NF ≤ 6 dB
5.2.2 Complete Design Calculation
STEP 1: Shannon Capacity Analysis
Determine required spectral efficiency:
Target net rate = 400 Gbps
Assume 20% FEC overhead → Gross rate = 400 / 0.8 = 500 Gbps
Available bandwidth ≈ 45 GHz (with guard bands in 50 GHz grid)
Required SE_gross = 500 / 45 = 11.1 bits/s/Hz
For dual-polarization: SE per polarization = 11.1 / 2 = 5.55 bits/s/Hz
Shannon limit for this SE:
SNR_Shannon = 2^5.55 - 1 = 46.8 (linear) = 16.7 dB
Conclusion: Theoretically possible, but need practical modulation format
STEP 2: Select Modulation Format
Evaluate modulation options:
| Format | bits/symbol | Symbol Rate | Required OSNR | Suitable? |
|---|---|---|---|---|
| DP-16QAM | 8 | 62.5 GBaud | ~21 dB | ❌ Marginal |
| DP-8QAM | 6 | 83.3 GBaud | ~17 dB | ✓ Good |
| DP-QPSK | 4 | 125 GBaud | ~12 dB | ✓ Conservative |
Selection: DP-8QAM at 83.3 GBaud
Roll-off factor: α = 0.2 (balance efficiency and complexity)
Occupied bandwidth = 83.3 × 1.2 = 100 GHz → Need 100 GHz spacing
Issue: 100 GHz spacing reduces channel count from 80 to 40
Revised decision: Use DP-16QAM at 62.5 GBaud, α = 0.15
Occupied BW = 62.5 × 1.15 = 71.9 GHz → Fits in 75 GHz flex-grid
STEP 3: Link Budget - OSNR Calculation
System parameters:
• Distance: 2000 km → 2000/80 = 25 spans
• Fiber loss: 0.2 dB/km × 80 km = 16 dB per span
• EDFA output power: 0 dBm per channel
• EDFA noise figure: 5.5 dB (typical commercial)
• Reference bandwidth: 12.5 GHz
Calculate single-span OSNR:
OSNR₁ = P_out + 58 - NF - 10×log₁₀(B_ref/1GHz)
OSNR₁ = 0 + 58 - 5.5 - 10.97 = 41.53 dB
Calculate 25-span OSNR:
Degradation = 10×log₁₀(25) = 13.98 dB
OSNR₂₅ = 41.53 - 13.98 = 27.55 dB
STEP 4: GOSNR Analysis
Nonlinear penalty estimation:
L_eff = (1 - e^(-0.046×80)) / 0.046 ≈ 20 km
φ_NL = γ × P × L_eff × N_spans
φ_NL = 1.3 × 0.001 W × 20 km × 25 = 0.65 rad
NL penalty ≈ 10×log₁₀(1 + 0.65²) ≈ 1.7 dB
OSNR_NL_equivalent = 27.55 - 1.7 = 25.85 dB
PMD penalty:
DGD = 0.1 ps/√km × √2000 = 4.47 ps
Symbol period = 1/62.5 = 16 ps
PMD penalty ≈ 0.6 dB
OSNR_PMD_equivalent = 27.55 - 0.6 = 26.95 dB
Other impairments (CD residual, filters, etc.):
Combined penalty ≈ 0.8 dB
OSNR_other_equivalent = 27.55 - 0.8 = 26.75 dB
Calculate GOSNR:
1/GOSNR = 1/10^2.755 + 1/10^2.585 + 1/10^2.695 + 1/10^2.675
GOSNR ≈ 23.4 dB
STEP 5: Margin Verification
Compare with requirements:
| Parameter | Value |
|---|---|
| Linear OSNR (ASE only) | 27.55 dB |
| GOSNR (all impairments) | 23.4 dB |
| Total system penalty | 4.15 dB |
| Required OSNR (DP-16QAM) | 21 dB |
| Available margin | 2.4 dB |
Required margins:
- Implementation tolerance: 2 dB
- Aging (0.05 dB/year × 20 years): 1 dB
- Repair margins (fiber splices): 1.5 dB
- Environmental variations: 1 dB
- Total required margin: 5.5 dB
Assessment: ❌ INSUFFICIENT MARGIN (2.4 dB < 5.5 dB)
STEP 6: Design Revision
Options to improve margin:
- Reduce modulation order to DP-8QAM (reduces capacity)
- Increase amplifier output power to +2 dBm (adds 2 dB OSNR)
- Use lower NF amplifiers (NF = 4.5 dB adds 1 dB)
- Reduce span count by increasing span length (not always possible)
Selected solution: Increase power + improve NF
New EDFA specs: P_out = +2 dBm, NF = 4.5 dB
Recalculated OSNR:
OSNR₁ = 2 + 58 - 4.5 - 10.97 = 44.53 dB
OSNR₂₅ = 44.53 - 13.98 = 30.55 dB
After GOSNR penalties (4.5 dB): GOSNR ≈ 26.0 dB
New margin: 26.0 - 21.0 = 5.0 dB ≈ Required margin ✓
Final Design: APPROVED for deployment
5.3 Example 2: Metro/Regional 800G System
5.3.1 Quick Design Summary
Metro System: Short Distance, High Capacity
Requirements: 800 Gbps, 400 km, 5 spans × 80 km
Strategy: Short distance allows high-order modulation
Selected Configuration:
- Modulation: DP-64QAM, 66.7 GBaud, α = 0.2
- Occupied BW: 66.7 × 1.2 = 80 GHz
- Net rate: 66.7 × 12 × 0.8 (FEC) = 640 Gbps → Need dual-carrier for 800G
OSNR Budget (5 spans):
OSNR₅ = (0 + 58 - 5.5 - 10.97) - 10×log₁₀(5) = 41.53 - 6.99 = 34.54 dB
GOSNR (after 2 dB penalties) ≈ 32.5 dB
Required for DP-64QAM: 27 dB
Margin: 32.5 - 27 = 5.5 dB ✓ Adequate
Conclusion: Short distances and low span counts enable high spectral efficiency formats with comfortable margins.
5.4 Power Optimization: ASE vs Nonlinear Trade-off
5.4.1 The Optimal Power Point
System performance varies with launch power due to competing effects: ASE noise improves with higher power, but nonlinear effects worsen. There exists an optimal power that maximizes GOSNR.
6.1 OSNR Measurement Techniques
6.1.1 Optical Spectrum Analyzer (OSA) Method
The OSA method is the most common technique for measuring OSNR in deployed DWDM systems. It directly measures signal and noise power in the optical domain.
- Advantages: Direct optical measurement, no traffic disruption, works on any channel, independent of modulation format
- Limitations: Requires optical access (tap), interpolation errors in dense WDM, doesn't capture nonlinear effects, limited accuracy at high OSNRs (>35 dB)
- Typical accuracy: ±1-2 dB for OSNR > 15 dB, degrades for OSNR < 10 dB or > 35 dB
6.1.2 Coherent Receiver-Based Measurement
Modern coherent transceivers with digital signal processing (DSP) can estimate OSNR in real-time without external equipment, using error vector magnitude (EVM) or other signal quality metrics.
Where:
• EVM = Error Vector Magnitude (from coherent DSP)
• EVM² = (σ_error² / P_signal)
• Correction factors account for: FEC, equalization, bandwidth
Advantages:
• Real-time monitoring without external equipment
• Per-channel measurement
• Captures effective OSNR including nonlinear effects (closer to GOSNR)
Limitations:
• Requires live traffic
• Accuracy depends on DSP implementation
• May include transceiver impairments
6.2 Troubleshooting Methodology
6.2.1 Systematic Diagnosis Approach
6.2.2 Common Issues and Solutions
| Symptom | Likely Cause | Diagnosis | Solution |
|---|---|---|---|
| Sudden OSNR drop (>5 dB) | Fiber damage or connector issue | Check span loss, visual inspection | Repair fiber, clean/replace connectors |
| Gradual OSNR degradation | Amplifier aging | Measure amplifier gain/output power | Replace aging amplifiers, adjust pump power |
| Good OSNR but high BER | Nonlinear effects or dispersion | Check launch power, measure CD/PMD | Reduce power, improve CD compensation |
| OSNR varies by channel | Gain tilt or filter misalignment | Measure full spectrum, check filters | Adjust amplifier gain equalization, realign ROADMs |
| Periodic performance fluctuation | Environmental (temperature) effects | Correlate with temperature data | Improve environmental control, use active compensation |
6.3 Optimization Strategies
6.3.1 System-Level Optimization
Once a system is deployed and operational, several optimization strategies can improve performance and capacity:
- Power optimization: Adjust launch power to optimal point (typically 0 to +3 dBm per channel)
- Gain equalization: Balance power across wavelengths using dynamic gain equalizers
- Adaptive modulation: Use higher-order modulation on short/good spans, lower-order on long/degraded spans
- Channel spacing optimization: Tighter spacing on low-loss spans to increase capacity
- FEC threshold tuning: Adjust pre-FEC BER targets based on actual OSNR margins
- Transceiver parameter tuning: Optimize DSP settings (CD pre-compensation, equalization, etc.)
6.3.2 Practical Optimization Example
Case Study: Capacity Upgrade Through Optimization
Initial System:
- 40 channels × 100 Gbps (DP-QPSK) = 4 Tbps total
- OSNR margin: 8 dB (measured 28 dB, required 20 dB for upgrade)
- Launch power: -3 dBm (conservative)
Optimization Steps:
- Power optimization: Increased to 0 dBm → +3 dB OSNR improvement
- Gain equalization: Flattened spectrum → 1 dB improvement on worst channels
- Modulation upgrade: Changed to DP-16QAM on best 30 channels
Results:
- 30 channels × 200 Gbps (DP-16QAM) = 6.0 Tbps
- 10 channels × 100 Gbps (DP-QPSK) = 1.0 Tbps
- Total capacity: 7 Tbps (75% increase)
- Remaining margin: 4-5 dB (still adequate)
Investment: Software upgrade only (no hardware replacement)
ROI: 75% capacity increase for minimal cost
References
- Shannon, C.E. (1948). "A Mathematical Theory of Communication," Bell System Technical Journal. Available at: https://ieeexplore.ieee.org
- ITU-T G-series Recommendations for Optical Systems. Available at: https://www.itu.int/rec/T-REC-G/
- R.J. Essiambre et al., "Capacity Limits of Optical Fiber Networks," JLT, vol. 28, no. 4, 2010. Available at: https://ieeexplore.ieee.org
- P. Poggiolini, "The GN Model of Non-Linear Propagation," JLT, vol. 30, no. 24, 2012. Available at: https://ieeexplore.ieee.org
- Optical Internetworking Forum (OIF) Implementation Agreements. Available at: https://www.oiforum.com
- Optical Network Communications: An Engineer's Perspective by Sanjay Yadav. Available at: https://mapyourtech.com/optical-network-communications-an-engineers-perspective/
- MapYourTech: Largest Collection of Technical Articles,Courses,utilies etc for Optical Professional https://mapyourtech.com/
For educational purposes in optical networking and DWDM systems
Note: This guide is based on industry standards, best practices, and real-world implementation experiences. Specific implementations may vary based on equipment vendors, network topology, and regulatory requirements. Always consult with qualified network engineers and follow vendor documentation for actual deployments.

Optical Communications & Network Automation Expert | Author of 3 Books for Optical Engineers | Founder, MapYourTech
Optical networking engineer with nearly two decades of experience across DWDM, OTN, coherent optics, submarine systems, and cloud infrastructure. Founder of MapYourTech. Read full bio →
Follow on LinkedInRelated Articles on MapYourTech