
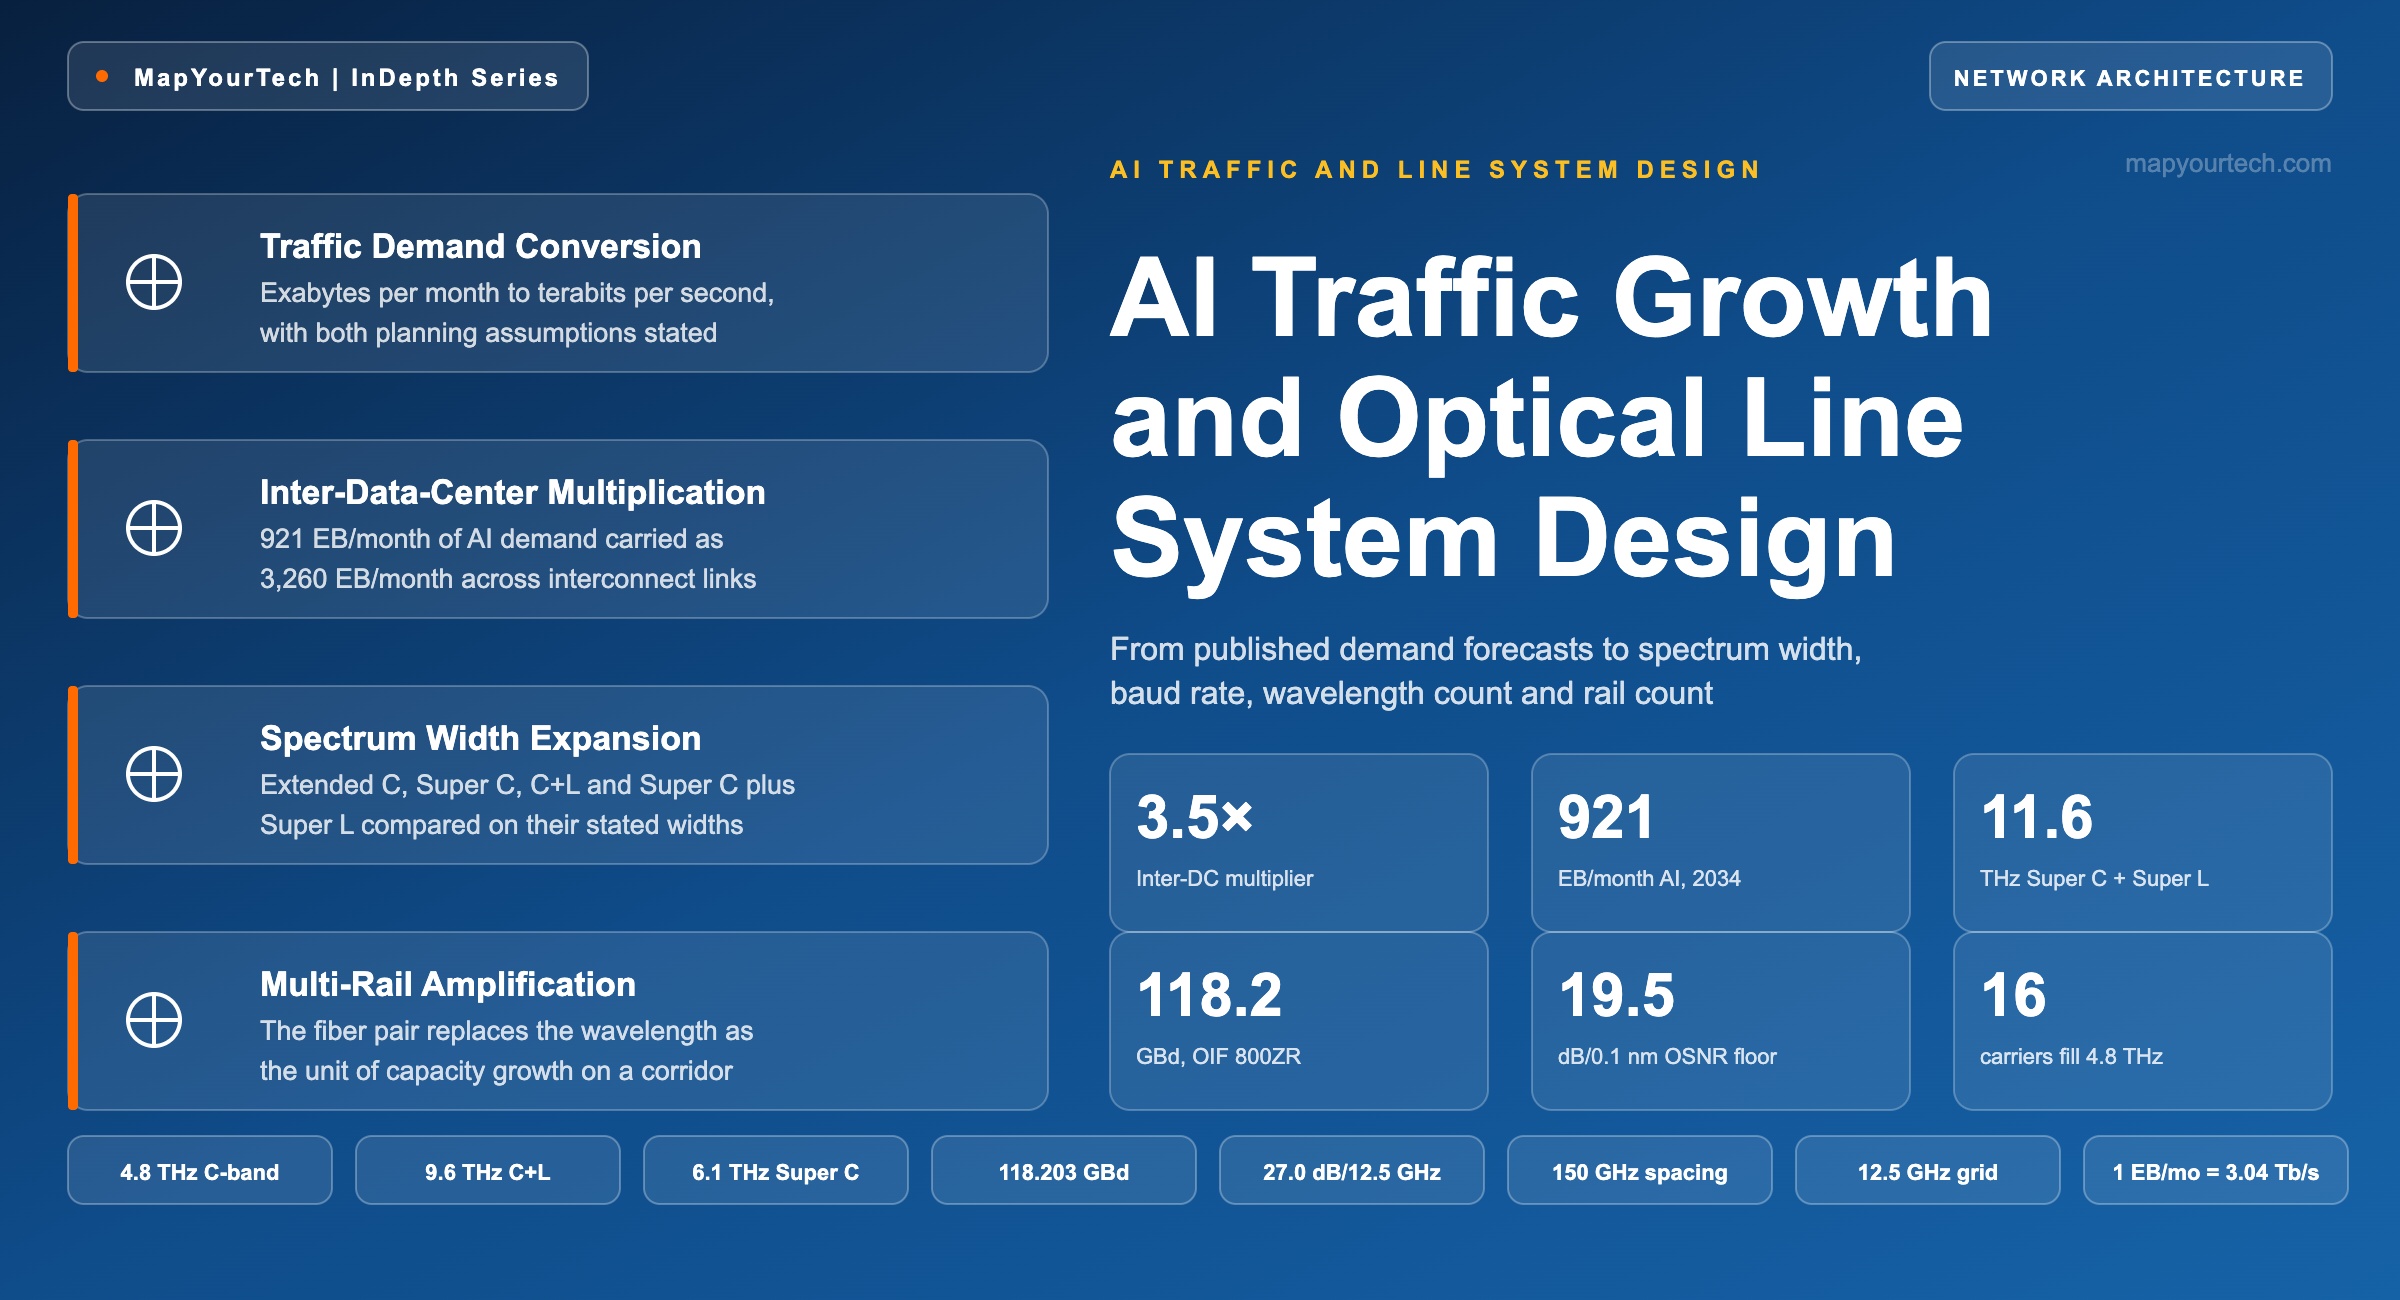
AI Traffic Growth and Optical Line System Design
How published 2024–2034 wide-area traffic forecasts convert into spectrum, wavelength count, amplifier density and line system architecture decisions.
Capacity follows compute, and compute moved to the next site.
What You Will Learn
- Convert a monthly traffic volume into a line rate using the single-line arithmetic of Section 2, where 1 EB/month resolves to 3.04 Tb/s of average carried rate.
- Separate offered volume, busy-hour rate, provisioned working capacity and occupied spectrum as four distinct quantities, following the chain in Figure 1.
- Place the three published 2034 wide-area demand scenarios — 2,277, 3,096 and 4,878 EB/month — against the capacity a single fiber pair can carry today.
- Quantify the inter-data-center multiplication that turns 921 EB/month of AI inference demand into 3,260 EB/month of carried interconnect traffic, per Section 4.
- Compare the spectrum options of Section 6 on their stated widths: 4.8 THz extended C, 6.1 THz Super C, 9.6 THz C+L and 11.6 THz Super C plus Super L.
- Explain why higher baud rates reduce wavelength count per band, and why 16 carriers at 300 GHz now fill the same 4.8 THz that once held 96 channels.
- Reproduce the Section 9 worked result for an 800ZR channel: 9.76 dB reference-bandwidth offset, a 19.5 dB/0.1 nm theoretical OSNR floor and 7.5 dB of standing allowance.
- Select between spectral efficiency, spectrum width and rail count using the decision flow in Figure 5 and the mechanism comparison of Section 13.
1. Introduction
Wide-area traffic demand is forecast to reach between 2,277 and 4,878 exabytes per month by 2034, against a 2024 base near 690 EB/month, at compound annual growth rates of 13% to 22% depending on the adoption scenario (vendor forecast, Nokia Bell Labs Consulting). Those are volumes. An optical line system is specified in bits per second, decibels and terahertz, and the conversion between the two is where most planning discussions lose their footing. A 16% compound rate on a moderate scenario means a fiber pair carrying 25.6 Tb/s today needs to carry roughly 112 Tb/s in ten years on the same route, and no single technology mechanism delivers that multiple.
The character of the demand has changed alongside its size, and the change matters more to a line system designer than the headline growth rate. AI traffic is projected to reach 921 EB/month by 2034 at a 23% compound rate, about 30% of the wide-area total, while the non-AI remainder grows at 15% to 2,174 EB/month (vendor forecast). The AI share does not behave like video. It moves laterally between data centers rather than radially toward users, it is more symmetric in direction, it is latency-sensitive at the inference stage, and a single user request can traverse several interconnect links in sequence before an answer returns. The consequence for transport is a demand curve on inter-data-center corridors that runs well above the end-user demand curve that generates it.
Optical line systems are responding on several axes at once. Spectral efficiency gains have become incremental as coherent engines approach the Shannon bound, so capacity is now bought with spectrum width, with baud rate, and increasingly with fiber count. Extended C-band gives 4.8 THz; adding the L-band gives 9.6 THz; Super C gives 6.1 THz on its own and 11.6 THz when paired with Super L (vendor-stated widths). Higher baud rates raise per-wavelength capacity while reducing the number of wavelengths per band, which changes add/drop economics. Multi-rail in-line amplifiers move the unit of capacity growth from the wavelength to the fiber pair. Several large AI and cloud providers have adopted point-to-point long-haul architectures in place of switched mesh designs, which removes a layer of the line system entirely.
This article works from published demand forecasts through to the physical-layer decisions they imply. Sections 2 and 9 establish the quantities and the arithmetic; Sections 3 and 4 set out the demand data and its interconnect multiplication; Sections 5 through 8 cover the line system response; Sections 10 through 14 cover selection, implementation, monitoring and roadmap. Every figure carries its evidence class in the sentence that states it, and forecast values are identified as forecasts throughout, because a demand scenario is an input assumption rather than a measurement.
2. Traffic Volume, Bit Rate and Provisioned Capacity
Provisioned capacity is the aggregate line rate a network operator installs and lights on a route, measured in bits per second, and it is a different quantity from the traffic volume that route carries, which is measured in bytes per accounting period. A forecast expressed in exabytes per month describes volume. A line system is specified, purchased and engineered in terabits per second. One number becomes the other only through an explicit chain of division and multiplication, and every step in that chain is a design assumption.
Adjacent Quantities That Get Conflated
Four pairs cause most of the confusion in capacity discussions, and separating them is the whole content of this section. Offered volume against carried volume: a forecast states what users generate, while a transport network carries that volume once for every link it traverses, which is the multiplication quantified in Section 4. Average rate against busy-hour rate: dividing a month of traffic by the seconds in a month gives a mean that no hour of the day sees, and the line system is sized for the busy hour. Client rate against line rate: an 800 Gb/s Ethernet client becomes a 945.6 Gb/s gross line signal once forward error correction and framing overhead are added, and the spectrum is occupied by the line signal. Capacity against spectrum: two systems can carry the same terabits per second while occupying different fractions of the band, which is exactly what spectral efficiency measures.
Read the Full Analysis with Premium
The remaining 88% of this article — the design numbers, trade-offs and field guidance — is part of MapYourTech Premium, along with the full premium library, courses and professional tools.
You May Also Like

-
Free
-
September 4, 2026

-
Premium
-
September 4, 2026

-
Premium
-
September 4, 2026