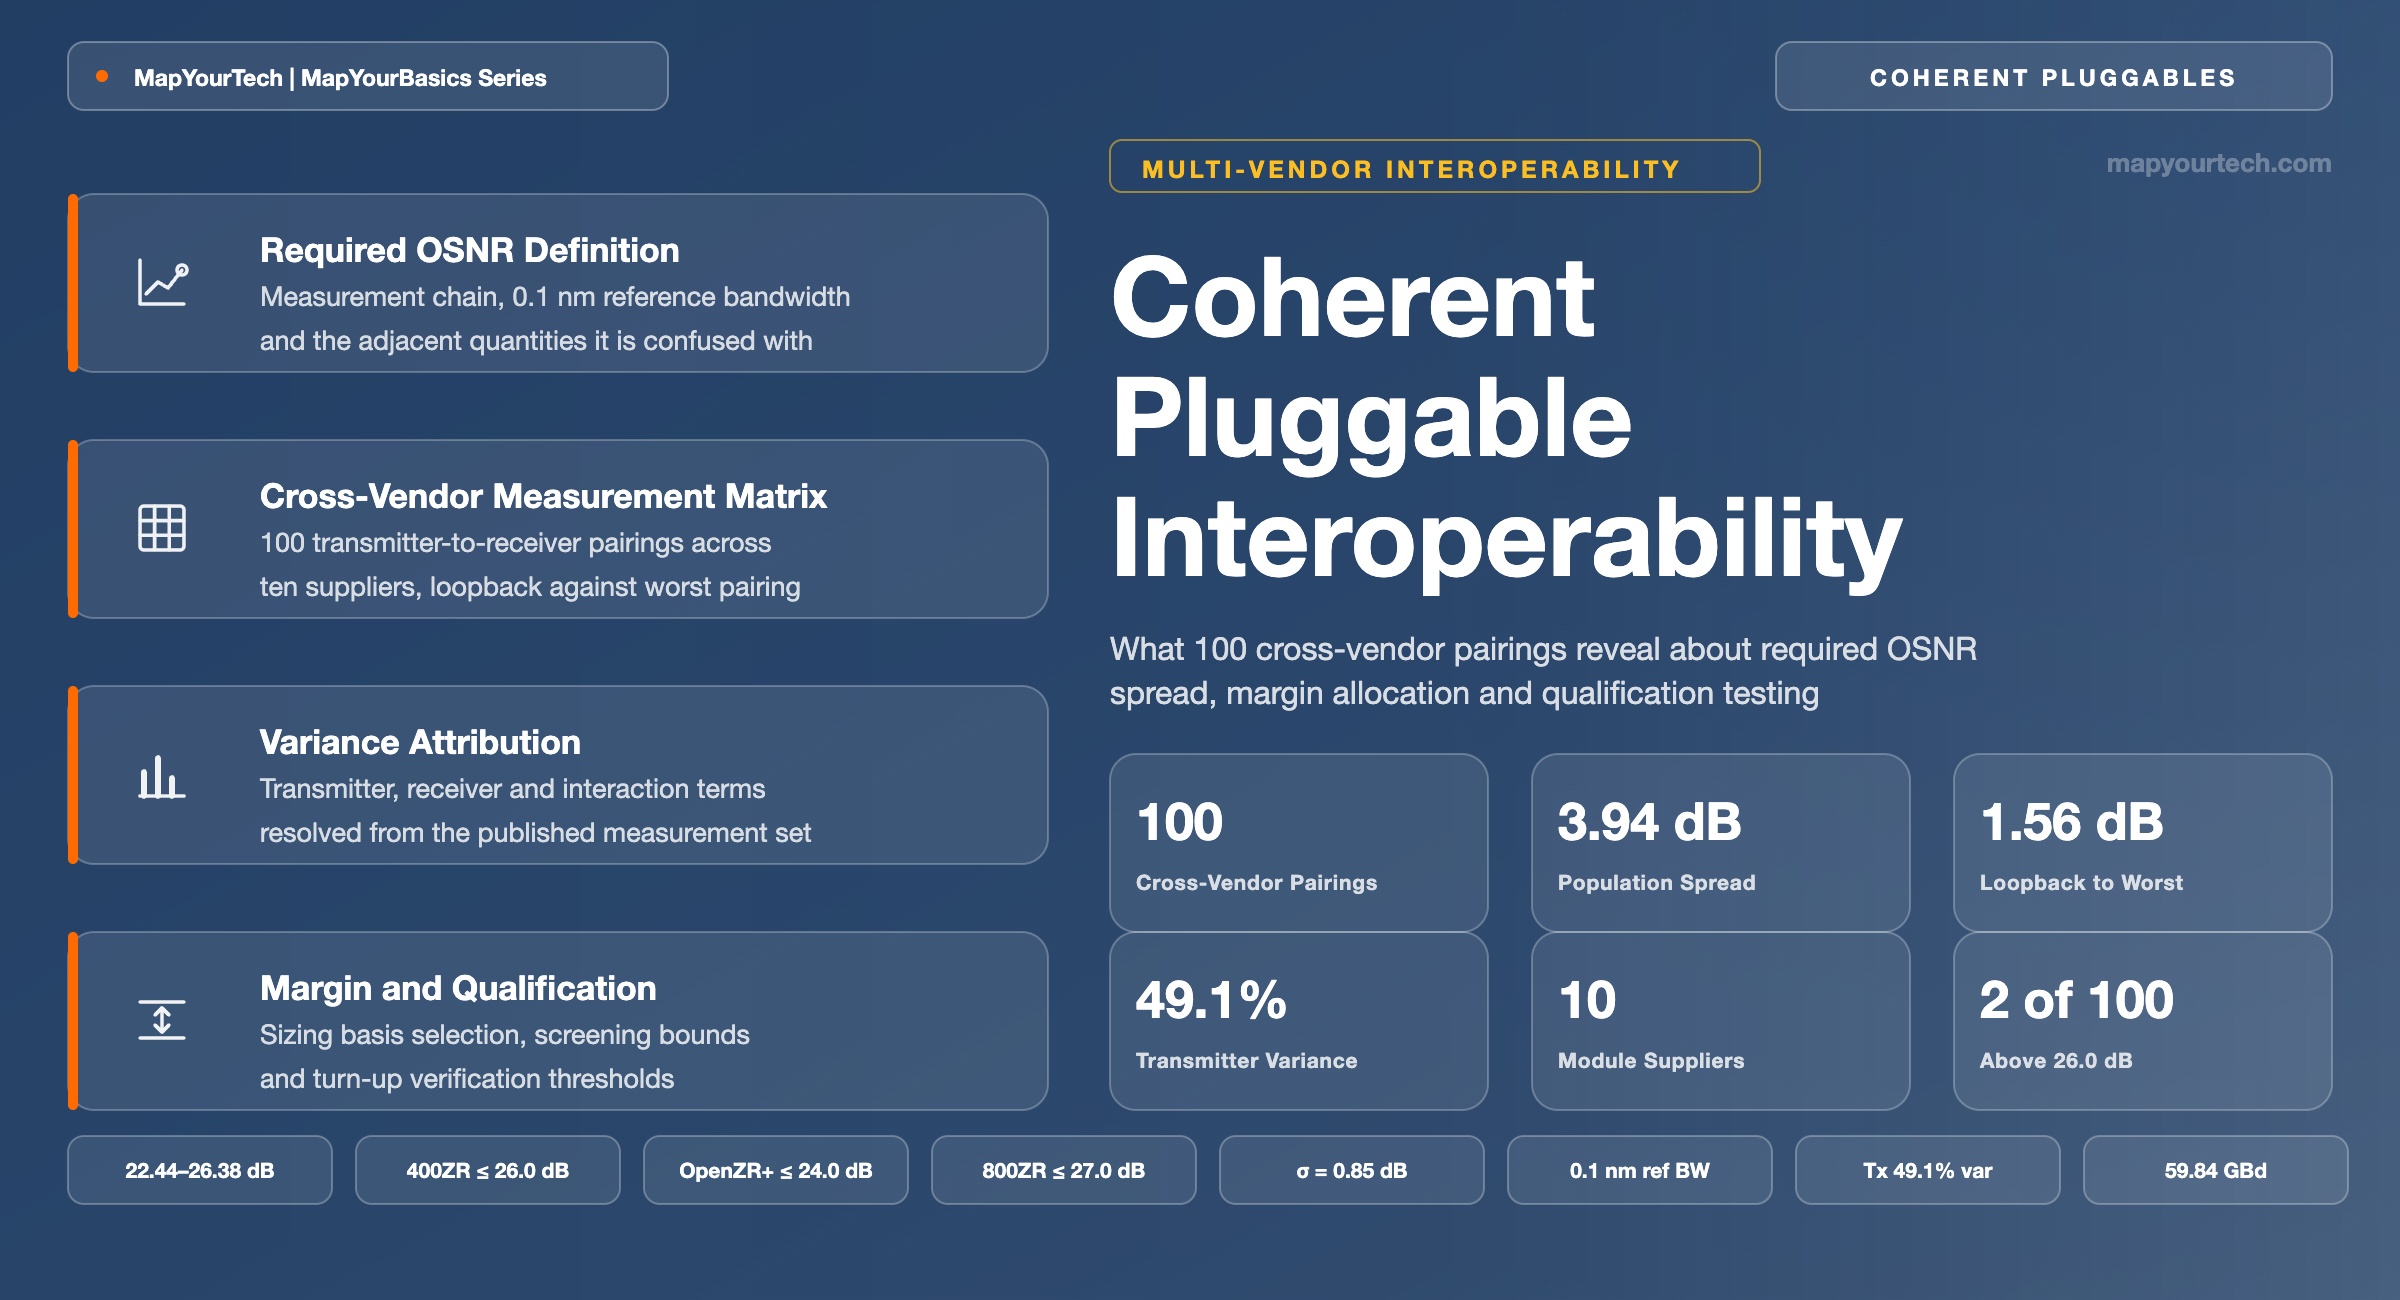
Multi-Vendor Coherent Pluggable Interoperability at Scale
What multi-vendor pluggable testing reveals about required optical signal-to-noise ratio (OSNR), margin allocation and network resilience, derived from published cross-vendor measurement matrices.
Conformance limits are envelopes, not expectations.
What You Will Learn
- Define required OSNR from the measurement chain of Figure 1 and separate it from the adjacent signal-to-noise quantities of Section 2.
- Convert electrical SNR to a 0.1 nm OSNR with the 6.81 dB reference term at 59.84 GBd and the 9.76 dB term at 118.203 GBd.
- Read the 100-pairing 400ZR matrix of Table 2 and the 3.94 dB spread it contains against a 26 dB/0.1 nm conformance limit.
- Attribute 49.1% of the observed variance to transmitter identity and 38.4% to receiver identity using the Section 6 decomposition.
- Budget the 1.56 dB mean and 2.29 dB worst-case gap between a receiver's loopback figure and its worst cross-vendor pairing.
- Build the qualification sequence of Figure 5 from mode matrix through loopback baseline to cross-vendor matrix and turn-up thresholds.
- Set monitoring thresholds against the 0.0 to 0.6 dB module-reported OSNR offsets recorded in Table 7.
- Select between 400ZR, OpenZR+, 800ZR and 1600ZR-class interfaces against the 26, 24 and 27 dB/0.1 nm conformance limits of Table 9.
1. Introduction
Ten QSFP-DD 400ZR modules from ten suppliers, cross-connected transmitter to receiver in every one of 100 combinations, returned required OSNR values from 22.44 to 26.38 dB in a 0.1 nm reference bandwidth (measured, OIF plugfest campaign reported by Anritsu). Every module in that population implements the same Implementation Agreement, the same dual-polarization 16-state quadrature amplitude modulation (DP-16QAM) at the same 59.84 GBd, and the same concatenated forward error correction (CFEC) code. The spread across the matrix is 3.94 dB, and the conformance limit the agreement sets is 26 dB/0.1 nm (standard-specified, OIF 400ZR Implementation Agreement).
That single result carries the whole argument of open, multi-vendor optical transport. Compliance is a statement about an envelope, and a network built by mixing suppliers inherits the width of that envelope rather than the performance of any one module inside it. A planner who sizes a link against a vendor datasheet figure has sized it against one point in a distribution; a planner who sizes it against the specification limit has sized it against the boundary the population is allowed to reach. The difference between those two choices, on this dataset, is 3.94 dB of link budget, which is a factor of 2.5 in the number of identical amplified spans a path can carry at the same delivered OSNR.
Multi-vendor pluggable testing has become the routine mechanism through which that distribution is measured. The Optical Internetworking Forum runs pre-event plugfests and publishes the resulting matrices, and the scale of the exercise now matches the scale of deployment: the OFC 2026 demonstration integrated nearly 100 coherent modules from 15 vendors across eleven host platforms and four open line systems, all managed by four IP and optical controllers (vendor and forum statements, OIF). One participating open line system was configured for a multi-span link of up to 300 km on SMF-28 fiber operating across both C-band and L-band (vendor claim, Adtran).
This article works through what those measurement campaigns show and what an engineer does with the result. It covers the definition and measurement of required OSNR, the specification families that bound it, the test architecture that produces a cross-vendor matrix, the published 400ZR and OpenZR+ results and a variance attribution derived from them, the margin allocation that follows, a qualification and turn-up sequence, telemetry accuracy limits, a fault reference, and the interface roadmap through the 1600ZR-class generation. It does not cover host electrical interface conformance or client-side Ethernet mapping, both of which sit on the other side of the module boundary.
2. Required OSNR Definition and Reference Conditions
Required OSNR is the lowest optical signal-to-noise ratio, stated in a 0.1 nm reference bandwidth, at which a specific receiver decodes a specific transmitter's signal with no errors after forward error correction (FEC) over a defined observation period. It is a property of the transmitter and receiver together, measured on a noise-loaded link, and it is the number a link budget must exceed at end of life.
The measurement is a threshold search rather than a reading. A transmitter drives a short optical path; an amplified spontaneous emission (ASE) source injects broadband noise through a variable optical attenuator; the attenuator is stepped in 0.1 dB increments until the receiver first runs a defined soak period without an uncorrected frame; and an optical spectrum analyser (OSA) sampling the same signal records the OSNR at that point. The OIF plugfest procedure uses a 30 second soak and 0.1 dB noise steps, with a coarse 1 dB sweep first to bracket the threshold (measured procedure, OIF plugfest white papers).
2.1 Distinctions From Adjacent Signal-to-Noise Quantities
Four quantities share the letters OSNR and denote different things, and panel C of Figure 1 separates them. OSNR is the ratio actually present on a link at a point in time, a measured condition produced by launch power, amplifier noise figure and span loss. Required OSNR is the threshold a given transmitter and receiver pair needs, a property of equipment rather than of the line. OSNR tolerance is the ceiling a specification places on required OSNR, so it bounds a population rather than describing any member of it. OSNR margin is delivered OSNR minus required OSNR, and it is the only one of the four that can be spent.
A fifth quantity sits alongside them. Generalized signal-to-noise ratio (GSNR) folds nonlinear interference into the denominator with ASE noise, which makes it the planning-side counterpart to a receiver's required OSNR: a design closes when path GSNR at end of life exceeds required OSNR with margin left. The margin design treatment for OSNR, GOSNR and Q works through that comparison across the planning, turn-up and in-service stages, and the OSNR versus GOSNR simulator shows how far the two diverge as launch power rises.
2.2 Units and the Conversion Arithmetic
Required OSNR is quoted in decibels in a 0.1 nm reference bandwidth, which is 12.478 GHz at 1550 nm. A coherent receiver decides on electrical signal-to-noise ratio, so the two are related by the ratio of symbol rate to reference bandwidth. Both polarizations are already counted in the dual-polarization symbol rate, so no additional factor of two enters here.
OSNR0.1 nm = SNRelec + 10 log10 ( Rs / 12.478 )Where:
OSNR0.1 nm — optical signal-to-noise ratio in a 0.1 nm reference bandwidth, in dB. Typical coherent values 12–30 dB.
SNRelec — electrical signal-to-noise ratio the receiver decides on, in dB. Typical values 6–20 dB.
Rs — symbol rate in GBd. 59.84 GBd for 400ZR, 60.14 GBd for the OpenZR+ 16QAM mode, 118.203 GBd for 800ZR.
12.478 — the 0.1 nm reference bandwidth expressed in GHz at 1550 nm.
The conversion term is 6.81 dB at 59.84 GBd, 6.83 dB at 60.14 GBd, and 9.76 dB at 118.203 GBd (derived from the relation above). Roll-off does not appear anywhere in it. A matched root-raised-cosine receive filter has a noise bandwidth of exactly the symbol rate whatever the roll-off, so roll-off belongs to occupied bandwidth and channel spacing rather than to this conversion.
Practical Example — required OSNR for the 400ZR operating point
At 59.84 GBd the reference term is 10 log10 (59.84 / 12.478) = 6.81 dB. DP-16QAM at the CFEC pre-FEC threshold needs an electrical signal-to-noise ratio of approximately 13.58 dB, which places the theoretical required OSNR at 20.39 dB/0.1 nm (theoretical limit, consistent with the MapYourTech implementation penalty budget). The best module measured in loopback across the ten-vendor plugfest population returned 22.44 dB, so its implementation penalty is 2.05 dB. The specification ceiling of 26 dB leaves 5.61 dB of headroom above the theoretical value, and the worst measured pairing consumed 5.99 dB of it, which is 0.38 dB past the limit.
Takeaway: required OSNR belongs to a transmitter and receiver together, not to a module alone, so a single-module datasheet figure describes one point in a population whose ceiling is set by the specification and whose width is only visible in a cross-vendor matrix.
3. Specification Families and Interoperability Boundaries
Four specification families govern coherent pluggable line interoperability, and each fixes a different combination of forward error correction, frame container, symbol rate and optical tolerance. The Optical Internetworking Forum writes 400ZR and 800ZR for single-span amplified data center interconnect (DCI) at the lowest power and cost the reach allows. The OpenZR+ Multi-Source Agreement (MSA) reuses the OIF ZR400 frame, substitutes Open FEC (oFEC) for the higher coding gain, and adds reduced-rate containers so one module covers 100G, 200G, 300G and 400G line modes. The Open ROADM MSA supplies the probabilistic constellation shaping (PCS) modes that the 800G extended-reach products advertise as interoperable. Above all of them sits the Common Management Interface Specification (CMIS), which fixes how a host configures and reads a module.
Interoperability lives at the intersection of a media interface identifier and a host interface identifier, expressed together as a CMIS application select code. A transmitter running the CFEC 16QAM application and a receiver running the oFEC 16QAM application share a cage, a tuning range and an electrical interface, and they will not interwork, because the frame adaptation, coder block structure and symbol rate all differ. The mode, FEC and reach comparison between 400ZR and OpenZR+ works through those four separation points in detail.
| Family | Line mode | FEC | Symbol rate (GBd) | OSNR tolerance (dB/0.1 nm) | Target application |
|---|---|---|---|---|---|
| OIF 400ZR | DP-16QAM, 400G | CFEC | 59.84 | 26.0 | Amplified single-span DCI to 120 km, and an unamplified loss-limited case |
| OpenZR+ MSA | DP-16QAM 400G, plus 8QAM and QPSK containers | oFEC | 60.14 | 24.0 | Multi-haul metro and regional over ROADM infrastructure |
| OIF 800ZR | DP-16QAM, 800G | oFEC | 118.20 | 27.0 | Amplified single-span DCI, 80–120 km |
| Open ROADM MSA | PCS-16QAM modes at 400G to 800G | oFEC | Mode-dependent | Mode-dependent | Extended-reach 800G ZR+ over metro and regional ROADM networks |
All symbol rates and OSNR tolerance values in Table 1 are standard-specified in the respective agreements. The 24 dB OpenZR+ figure is lower than the 26 dB 400ZR figure because oFEC carries more coding gain than CFEC at the same modulation and a similar symbol rate, so the receiver reaches a post-FEC error-free state at a lower optical signal-to-noise ratio.
3.1 Interoperability Boundary and Implementation Freedom
Two modules built to the same agreement are required to interwork at a defined optical reference point, not to perform identically. The agreement fixes a transmitter envelope, a receiver envelope, and a frame both must produce and consume. Inside those envelopes, implementations differ in digital-to-analogue converter resolution, driver linearity, quadrature error, in-phase and quadrature skew, laser linewidth, equaliser architecture and decoder implementation, and each of those differences moves required OSNR.
Two consequences follow directly, and they set up the rest of this article. A transmitter near the permissive edge of its envelope raises the required OSNR of every receiver it is paired with, whether or not that transmitter is itself compliant. And a receiver characterised only against its own transmitter has been characterised against one point, which is why loopback figures and cross-vendor figures differ systematically rather than randomly.
Takeaway: an agreement bounds a transmitter envelope, a receiver envelope and a shared frame, so two compliant modules are guaranteed to interwork and are not guaranteed to reach the same threshold.
4. Test Architecture for Cross-Vendor Qualification
A cross-vendor matrix needs every transmitter connected to every receiver under a controlled and repeatable noise condition, which places three requirements on the test bench: a single noise-loading path shared by all pairings, a switching fabric that reconfigures the pairing without reconfiguring the modules, and an independent optical measurement of the noise condition. Figure 2 sets out the arrangement the published campaigns used.
4.1 Function of Each Test Stage
Configuration equivalence comes first because a mode mismatch produces a link failure rather than a measurement. Every module is set to the same media interface identifier, the same host interface identifier, the same optical channel and the same transmit power setpoint through CMIS registers before any noise is applied. The published 400ZR campaign used channel 24 at 193.700 THz on a 75 GHz grid with a −10 dBm transmit setpoint; the OpenZR+ campaign used the same channel and setpoint in the oFEC 16QAM application; the 800ZR campaign used channel 27 at 193.775 THz with a −2 dBm setpoint (measured procedures, OIF plugfest white papers).
The optical switch matrix removes module initialisation from the measurement loop. An 8 × 8 low-loss switch lets every module stay powered and configured while pairings are reconfigured electrically, which cuts the reconfiguration commands and the module start-up time out of each cycle. Its insertion loss is then absorbed by the dynamic attenuator so that receiver input power stays at the configured level.
Holding receiver input power constant is what makes the result an OSNR threshold rather than a sensitivity floor. A receiver that runs out of optical power and a receiver that runs out of signal-to-noise ratio both stop decoding, and only the second is the quantity under test. The optical link OSNR simulator is useful for setting the noise-loading operating point before bench time is committed.
Fiber hygiene sits in the same list as the instruments because it changes results at this resolution. Every connection is inspected and cleaned before a measurement, since a contaminated connector adds loss and reflection that the attenuator then compensates, moving the operating point without any indication in the recorded data.
The module's own reported OSNR is not the reference. Both published campaigns state that the value read from the module can guide the test but that a high-resolution optical spectrum analyser is what records the result. Section 9 quantifies the difference between the two readings.
Takeaway: a cross-vendor matrix is only interpretable when configuration, noise path and received power are held constant across every pairing, which is what the switch matrix and the shared noise-loaded link exist to guarantee.
5. Measured Cross-Vendor Required OSNR
Across 100 transmitter-to-receiver combinations of ten 400ZR modules, the required OSNR distribution has a mean of 23.85 dB/0.1 nm and a standard deviation of 0.85 dB, with a histogram peak between 23.5 and 24.0 dB (measured, OIF plugfest campaign reported by Anritsu). Every pairing established a link. Most combinations met the 26 dB/0.1 nm conformance limit, and two pairs exceeded it at 26.2 and 26.38 dB/0.1 nm. The equivalent OpenZR+ campaign, ten modules in the oFEC 16QAM application against a 24 dB/0.1 nm limit, reported six pairs above the limit spanning 24.1 to 25.4 dB/0.1 nm and three pairings that did not establish a link during the event.
Those headline figures understate the engineering problem, because the quantity a planner needs is not the mean of the population. It is the worst pairing a given receiver can meet once the module inventory contains more than one supplier.
5.1 Loopback Figures Against Cross-Vendor Figures
A module measured in loopback (its own transmitter into its own receiver) produces the figure most often quoted, and it is the figure a single-supplier qualification produces. Table 2 places each receiver's loopback value beside its mean across all ten transmitters and its worst pairing.
| Receiver | Loopback | Mean across transmitters | Worst pairing | Gap, worst minus loopback | Margin to limit at worst pairing |
|---|---|---|---|---|---|
| A | 22.44 | 23.22 | 24.18 | 1.74 | 1.82 |
| B | 22.74 | 23.26 | 24.45 | 1.71 | 1.55 |
| C | 22.92 | 23.67 | 25.21 | 2.29 | 0.79 |
| D | 23.19 | 23.75 | 25.44 | 2.25 | 0.56 |
| E | 23.38 | 23.38 | 24.63 | 1.25 | 1.37 |
| F | 23.77 | 23.75 | 25.67 | 1.90 | 0.33 |
| G | 23.94 | 23.79 | 25.21 | 1.27 | 0.79 |
| H | 24.11 | 24.75 | 26.20 | 2.09 | -0.20 |
| I | 24.63 | 24.42 | 25.24 | 0.61 | 0.76 |
| J | 25.90 | 24.73 | 26.38 | 0.48 | -0.38 |
Loopback values are measured and published; the mean, worst-pairing, gap and margin columns are derived from the published matrix. Vendor letters are the anonymised labels used in that campaign and do not correspond to the letters used in the OpenZR+ campaign discussed below.
The gap column is the operational result. On average a receiver's worst cross-vendor pairing sits 1.56 dB above its loopback figure, and the largest single gap in this population is 2.29 dB (derived from the published matrix). A qualification programme that stops at loopback therefore under-reports the requirement by somewhere between half a decibel and two and a third decibels, with no way of knowing in advance which end of that range a given module will land on.
| Receiver | Loopback | Worst pairing | Gap |
|---|---|---|---|
| A | 22.44 | 24.18 | 1.74 |
| B | 22.74 | 24.45 | 1.71 |
| C | 22.92 | 25.21 | 2.29 |
| D | 23.19 | 25.44 | 2.25 |
| E | 23.38 | 24.63 | 1.25 |
| F | 23.77 | 25.67 | 1.90 |
| G | 23.94 | 25.21 | 1.27 |
| H | 24.11 | 26.20 | 2.09 |
| I | 24.63 | 25.24 | 0.61 |
| J | 25.90 | 26.38 | 0.48 |
5.2 OpenZR+ Population Spread Against a 24 dB Limit
The oFEC population behaves the same way against a tighter limit. Loopback values ran from 20.8 to 22.7 dB/0.1 nm and every one of them met the 24 dB requirement, so a loopback-only qualification would have passed all ten modules with at least 1.3 dB to spare. Across the full matrix the mean gap between a receiver's loopback figure and its worst pairing is 2.20 dB, and the largest gap is 3.50 dB (derived from the published matrix). That is the whole margin a loopback test appeared to show, spent by the pairing.
The distribution of the exceeding pairs is the useful detail. Five of the pairings at or above 24.1 dB/0.1 nm in the published table share a single transmitter, while the receivers involved are five different suppliers. One transmitter near the permissive edge of its envelope raised the requirement across half the receiver population, and none of those receivers had shown any weakness in loopback.
Takeaway: loopback required OSNR is a floor, not a forecast. Budget the 1.5 to 2.2 dB mean gap to the worst cross-vendor pairing, and confirm the tail with a matrix rather than assuming it.
6. Variance Attribution Between Transmitter and Receiver
Transmitter identity accounts for 49.1% of the total variance in the 400ZR matrix, receiver identity for 38.4%, and the interaction between a specific transmitter and a specific receiver for the remaining 12.5% (derived by two-way decomposition of the published matrix). The decomposition matters because it tells a qualification programme where to spend its bench time.
SStotal = SSTx + SSRx + SSinteraction

SSTx = n × SUM ( colmeanj - grandmean )2
SSRx = n × SUM ( rowmeani - grandmean )2
Where:
SStotal — sum of squared deviations of all 100 measured values from the grand mean, in dB2. Value for this matrix: 76.24 dB2.
colmeanj — mean required OSNR across all receivers for transmitter j, in dB. Range 23.09 to 25.14 dB.
rowmeani — mean required OSNR across all transmitters for receiver i, in dB. Range 23.22 to 24.75 dB.
n — number of modules on each axis. Value 10.
| Source | Sum of squares (dB squared) | Share of total | Engineering reading |
|---|---|---|---|
| Transmitter identity | 37.43 | 49.1% | Transmitter signal quality sets roughly half the spread. Screening transmitters removes the most variance per unit of test effort. |
| Receiver identity | 29.24 | 38.4% | Receiver implementation is nearly as influential. Both ends need screening; neither alone is enough. |
| Pairing interaction | 9.56 | 12.5% | Combination-specific behaviour is real but secondary, so a full matrix refines a result that per-end screening already predicts. |
| Total | 76.24 | 100.0% | Population spread across 100 pairings: 3.94 dB from lowest to highest. |
The practical reading is that most of a cross-vendor penalty is predictable from each end separately. A transmitter's mean required OSNR across a reference receiver set, and a receiver's mean across a reference transmitter set, together explain 87.5% of the variance, which is why a qualification programme can screen ends first and reserve full matrix testing for the combinations that survive. The remaining eighth is why it cannot skip the matrix entirely.
| Vendor | As transmitter | As receiver |
|---|---|---|
| A | 21.61 | 21.31 |
| B | 21.47 | 21.33 |
| C | 21.28 | 22.53 |
| D | 22.39 | 22.03 |
| E | 22.45 | 21.88 |
| F | 21.98 | 22.53 |
| G | 22.46 | 21.97 |
| H | 22.08 | 22.54 |
| I | 22.46 | 22.52 |
| J | 23.46 | 23.09 |
6.1 Transmitter Quality Metrics and Their Reproducibility
If transmitter identity carries half the variance, a transmitter-side quality metric that predicted required OSNR would shorten every qualification programme. Error vector magnitude (EVM) is the candidate the standards bodies are pursuing, measured on the transmitter output with no noise loading applied. The published OpenZR+ campaign measured EVM on the same ten modules with two independent instrument setups, and the results diverge: one setup returned values from 11.5% to 12.8% root mean square, the other returned 8.5% to 13.0% on the same modules, and two modules could not be measured at all on the first setup (measured, OIF plugfest white paper).
A metric whose spread between two laboratories is comparable to its spread between vendors cannot yet substitute for the threshold measurement. The published conclusion is that both measurement method and post-processing need further work before EVM carries normative weight. Until that closes, transmitter screening means measuring required OSNR against a fixed reference receiver rather than measuring a transmitter in isolation.
Rank transmitters by mean required OSNR against a fixed reference receiver set, and receivers by mean required OSNR against a fixed reference transmitter set. Those two rankings predict 87.5% of the observed variance in this dataset, and they require about a fifth of the measurements a full matrix needs for a ten-module population.
Takeaway: transmitter identity contributes more to cross-vendor required OSNR spread than receiver identity, so a screening programme ranks both ends against fixed references first and reserves full matrix testing for the surviving combinations.
7. Margin Allocation Under Vendor Mixing
A link budget in a multi-vendor inventory closes against the worst pairing the inventory permits, not against the module in the slot today. Three sizing bases are available, and they differ by nearly 4 dB on the published 400ZR population: the best loopback figure at 22.44 dB/0.1 nm, the worst measured pairing at 26.38 dB/0.1 nm, and the conformance limit at 26.0 dB/0.1 nm. Choosing between them is the single largest decision in a coherent pluggable design.
rOSNRdesign = max ( rOSNRqualified pairings ) + Aaging + Auncertainty

MarginEOL = OSNRdelivered, EOL - rOSNRdesign
Where:
rOSNRqualified pairings — the set of measured required OSNR values for pairings the inventory policy permits, in dB/0.1 nm. Use the conformance limit where the matrix is incomplete.
Aaging — transceiver aging allowance added to the requirement, in dB. Typical planning allocation 0.5–1.5 dB.
Auncertainty — model and measurement uncertainty allowance, in dB. Typical planning allocation 0.7–1.0 dB.
OSNRdelivered, EOL — path OSNR after span-loss aging and linear penalties, in dB/0.1 nm.
7.1 Delivered OSNR on a Multi-Span Path
Delivered OSNR accumulates from the amplifier chain. For identical spans the single-span contribution and the multi-span total follow the standard relation, with 58 the reference constant at 1550 nm in a 0.1 nm reference bandwidth.
OSNRspan = 58 + Pch - Lspan - NF

OSNRtotal = OSNRspan - 10 log10 ( N )
Where:
Pch — per-channel launch power at the amplifier output, in dBm. Typical open line system values −3 to +1 dBm.
Lspan — total span loss including fiber, splices, connectors and patch panels, in dB.
NF — amplifier noise figure, in dB. Typical erbium-doped fiber amplifier values 5.0–6.5 dB.
N — number of identical amplified spans.
Practical Example — a four-span regional path sized three ways
Take four identical 80 km spans on ITU-T G.652.D fiber at 0.21 dB/km, plus 1.2 dB per span for splices, connectors and patch panels, giving 18.0 dB of span loss. With a 0 dBm per-channel launch power and a 5.5 dB amplifier noise figure, the single-span figure is 58 + 0 − 18.0 − 5.5 = 34.5 dB/0.1 nm, and four spans give 34.5 − 10 log10 (4) = 28.48 dB/0.1 nm at beginning of life.
End-of-life delivered OSNR subtracts 0.5 dB per span of span-loss aging and repair allowance, which is 2.0 dB, and 0.5 dB of combined chromatic dispersion, polarization mode dispersion and polarization dependent loss penalty, leaving 25.98 dB/0.1 nm. Add 0.5 dB of transceiver aging to whichever required OSNR basis is chosen.
Sized on the best loopback figure, the design requirement is 22.44 + 0.5 = 22.94 dB and the end-of-life margin is 3.04 dB, so the path appears to close comfortably. Sized on the conformance limit, the requirement is 26.0 + 0.5 = 26.5 dB and the margin is −0.52 dB, so the path does not close. Sized on the worst measured pairing, the requirement is 26.38 + 0.5 = 26.88 dB and the shortfall widens to 0.90 dB. Reducing the path to three spans lifts delivered end-of-life OSNR to 27.73 dB/0.1 nm and returns 1.23 dB of margin against the conformance-limit basis.
| Sizing basis | Required OSNR (dB) | Plus aging (dB) | EOL margin, 4 spans (dB) | EOL margin, 3 spans (dB) | Applicability |
|---|---|---|---|---|---|
| Best loopback figure | 22.44 | 22.94 | 3.04 | 4.79 | Single supplier, single build standard, no spares substitution |
| Mean of the matrix | 23.85 | 24.35 | 1.63 | 3.38 | Statistical view only. Not a design basis for any individual path |
| Conformance limit | 26.00 | 26.50 | -0.52 | 1.23 | Open inventory, any compliant module in any slot |
| Worst measured pairing | 26.38 | 26.88 | -0.90 | 0.85 | Open inventory with the observed population tail included |
Delivered OSNR values are derived from the relations above; required OSNR values are measured or standard-specified as stated in Sections 3 and 5. The 1.75 dB difference between the four-span and three-span columns is 10 log10 (4/3) plus one span of aging allowance.
7.2 Selecting a Sizing Basis
The choice follows from inventory policy rather than from optics. A network that qualifies one module type per route, controls spares to the same build standard and re-qualifies before any substitution can size against measured pairings. A network that treats coherent pluggables as a commodity, procures against a specification and lets sourcing substitute suppliers must size against the conformance limit, because any compliant module can land in any slot. Most operators sit between the two, and the workable middle is an inventory policy that names permitted pairings per route class and sizes against the worst pairing that policy allows.
Open line system deployments push toward the conformance-limit basis for a second reason. Neither party can measure the whole path: the line system owner has no access to pre-forward-error-correction bit error rate, and the transponder owner has no access to per-span optical power profiles. The alien wavelength treatment for third-party line systems sets out the written optical contract that replaces the missing model, and open line systems and multi-vendor coherent wavelengths covers the architectural context.
Takeaway: size the budget against the worst pairing the inventory policy permits. On the published population that is 3.94 dB above the best loopback figure, which is the difference between a four-span path that closes and one that does not.
8. Qualification Programme and Turn-Up Sequence
A qualification programme converts the variance structure of Section 6 into test time. Screening each end against fixed references explains 87.5% of the spread at roughly a fifth of the measurement count of a full matrix, so the sequence screens first, matrices second, and carries the surviving worst pairing into the design requirement. Figure 5 sets out the flow with both outcomes of each decision.
8.1 Screening Bound Selection
The screening bound sets how much of the cross-vendor gap the programme reserves before the matrix is run. On the published 400ZR population the mean gap from a receiver's screening mean to its worst pairing is 1.39 dB and the largest is 1.92 dB (derived from the published matrix), so a bound set at the conformance limit minus 2.0 dB admits the modules that will survive the matrix and rejects those that will not. A tighter bound rejects usable modules; a looser one pushes the failures into matrix testing, where each rejection has cost roughly ten times as many measurements.
8.2 Turn-Up Verification
At turn-up the acceptance test is measured pre-forward-error-correction Q against a beginning-of-life threshold, with the optical signal-to-noise ratio reading taken at the same time used to localise a shortfall rather than to accept the wavelength. A wavelength short on Q but meeting the required beginning-of-life OSNR points at the transceiver or the filtering path; one short on both points at span loss, amplifier gain or tilt. The DWDM commissioning checklist carries the per-channel power verification steps that precede this test.
One turn-up practice is commonly omitted and belongs in the sequence: record the module firmware revision at both ends alongside the acceptance measurement. Three pairings in the published OpenZR+ campaign failed to establish a link during the event and interoperated successfully after post-event troubleshooting, which places those failures in configuration and implementation behaviour rather than in optical performance. A pairing record without a firmware revision cannot be reproduced later.
Takeaway: screen both ends against fixed references, matrix only the survivors, carry the worst qualified pairing into the design requirement, and record firmware revisions with every result so the qualification can be reproduced.
9. Telemetry Accuracy and Performance Monitoring
Coherent pluggables report their own received OSNR, signal-to-noise ratio, pre-forward-error-correction bit error rate, chromatic dispersion estimate and received power through the CMIS Versatile Diagnostics Monitoring registers, and a host reads them without any external instrument. That telemetry is the only continuous measurement most deployed links have, so its accuracy sets what an alarm threshold can be built on.
Measured against an optical spectrum analyser on the same link, module-reported OSNR in the published OpenZR+ campaign matched within 0.1 dB on eight of ten modules, with one module reading 0.6 dB high and one reading 0.1 dB low (measured, OIF plugfest white paper). A separate published comparison across two router platforms found a maximum difference of 1.2 dB between reported and measured OSNR, and found the offset varied with the host platform rather than only with the module.
| Module | Reported by CMIS | Measured by OSA | Offset |
|---|---|---|---|
| A | 21.4 | 20.8 | 0.6 |
| B | 20.9 | 20.9 | 0.0 |
| C | 21.5 | 21.5 | 0.0 |
| D | 21.9 | 21.8 | 0.1 |
| E | 22.0 | 21.8 | 0.2 |
| F | 21.9 | 21.9 | 0.0 |
| G | 22.0 | 22.0 | 0.0 |
| H | 22.1 | 22.0 | 0.1 |
| I | 22.3 | 22.2 | 0.1 |
| J | 22.6 | 22.7 | -0.1 |
9.1 Threshold Construction From Reported Values
Two properties of the offset shape how thresholds are set. The offset is a bias rather than noise, so it does not average away over time; and its sign varies by module, so a single global correction removes the error on some links and doubles it on others. The workable practice is to record the offset per link at turn-up, when a spectrum analyser is on site anyway, and store it with the link record. Thereafter the reported value plus its recorded offset is the monitored quantity, and a change in that quantity is a change in the plant.
Pre-forward-error-correction bit error rate is the more reliable telemetry stream for degradation, because it is counted rather than estimated, and the coherent receiver's own decoder produces it. A soft failure shows first as a drift in pre-FEC bit error rate at constant received power, which is the signature that separates gradual margin loss from a discrete plant change. Predicted-against-measured comparison over time is the mechanism behind digital twin calibration loops for predicted and measured GSNR, and the same comparison detects a module drifting inside its own envelope.
Set signal-degrade thresholds on pre-forward-error-correction Q rather than on reported OSNR, and use reported OSNR with its recorded per-link offset for localisation. A degrade threshold placed directly on an uncorrected reported OSNR inherits up to 1.2 dB of platform-dependent bias.
Takeaway: module-reported OSNR carries a per-link bias of up to 1.2 dB that does not average away, so record the offset at turn-up against a spectrum analyser and alarm on pre-FEC Q rather than on the reported ratio.
10. Fault Reference for Link Establishment and Degradation
Cross-vendor faults separate cleanly into two classes with different diagnostic paths. A link that never establishes is a configuration or implementation-behaviour fault, and it presents as a persistent loss of frame or loss of multi-frame with no useful pre-forward-error-correction bit error rate to read. A link that establishes and then runs short of margin is an optical or implementation-penalty fault, and it presents as a pre-FEC bit error rate above expectation at a received power and OSNR that both read correctly.
The distinction matters operationally because the first class is resolved through firmware and configuration and the second through the link budget. Published campaign experience puts both classes in the field: three OpenZR+ pairings and two 800ZR pairings failed to establish a link during their respective events, and the OpenZR+ cases interoperated after post-event troubleshooting between the two suppliers.
| Observed condition | Likely cause | Diagnostic step | Resolution path |
|---|---|---|---|
| Link never establishes; loss of frame persists | Application select code mismatch between ends, or a mode one end does not implement | Read the media and host interface identifiers from both modules through CMIS and compare them literally | Set both ends to the same application code; where one end lacks the mode, the pairing is not permitted |
| Link establishes only in one direction | Asymmetric transmit power setpoint, or one receiver below its input power range | Compare reported transmit power and received power at both ends against the configured setpoints | Correct the add-port attenuator setting; re-verify received power before repeating the OSNR test |
| Link establishes intermittently at high OSNR | Implementation behaviour at acquisition, often firmware-revision dependent | Record both firmware revisions and repeat with each end at a known-good revision | Raise with both suppliers with the recorded revisions; retest before returning the pairing to service |
| Pre-FEC BER above expectation, power and OSNR correct | Cross-vendor implementation penalty above the qualified value | Compare the measured required OSNR for this pairing against the qualification record | Apply the inventory pairing rule; re-route or re-pair rather than adjusting line-system power |
| Reported OSNR disagrees with the spectrum analyser | Per-module and per-platform reporting bias, up to 1.2 dB | Measure with a high-resolution spectrum analyser at the same point and record the offset | Store the offset with the link record and monitor pre-FEC Q rather than the reported ratio |
| Pre-FEC BER drifting upward at constant received power | Soft failure: span-loss increase, connector contamination or module aging | Compare current pre-FEC Q against the turn-up record and the predicted GSNR for the path | Localise with an optical time-domain reflectometer (OTDR) and a per-span power profile before replacing any module |
| Client traffic interrupted with the line side error-free | Host electrical interface or client mapping fault, not a line interoperability fault | Read host-side local fault and remote fault indications and the client FEC counters | Resolve on the host side; the coherent line interface is not implicated |
Two entries in Table 8 deserve emphasis because they are the ones most often mis-routed. A cross-vendor implementation penalty is corrected by changing the pairing, not by raising launch power: adding power to a channel that is already at its optimum increases nonlinear interference faster than it increases OSNR, and on a shared line system it also degrades the neighbours. And a soft-failure drift is localised before any module is replaced, because module replacement resets the evidence. An OTDR trace with event interpretation is the standard first step for the span-loss branch.
Takeaway: separate link-establishment faults from margin faults before diagnosing. The first is resolved through application codes and firmware, the second through the pairing rule and the link budget, and neither is resolved by adjusting line-system power.
11. Interface Comparison and Selection Criteria
Interface selection in a multi-vendor inventory turns on three quantities: the conformance limit the receiver population is allowed to reach, the reference-bandwidth term that converts electrical signal-to-noise ratio at that symbol rate, and the spectral occupancy that fixes how many channels the band carries. Table 9 places them side by side.
| Interface | Symbol rate (GBd) | rOSNR limit (dB/0.1 nm) | Reference term (dB) | Channel spacing (GHz) | Interoperability status |
|---|---|---|---|---|---|
| OIF 400ZR | 59.84 | 26.0 | 6.81 | 75 | Multi-vendor matrices published across ten suppliers; volume deployment |
| OpenZR+ 400G 16QAM | 60.14 | 24.0 | 6.83 | 75 | Multi-vendor matrix published across ten suppliers; volume deployment |
| OIF 800ZR | 118.20 | 27.0 | 9.76 | 150 | Multi-vendor matrices published; deploying |
| 800G ZR+ PCS modes | 131 | Mode-dependent | 10.21 | 150 | Interoperable PCS defined in the Open ROADM MSA; vendor products shipping |
| 1600ZR class | Approximately 252 | Not yet published | 13.05 | Not yet published | Implementation agreements in progress |
Symbol rates and conformance limits for the first three rows are standard-specified; the 131 GBd figure for the 800G PCS mode and the approximate 252 GBd figure for the 1600ZR class are vendor-stated and forum-stated respectively. Reference terms are derived from the Section 2 relation. Channel spacing values are the deployed grid spacings the interfaces are specified against.
11.1 Reference-Bandwidth Term and Capacity Trade-Off
The reference term rises with symbol rate, and that rise is the largest single difference between interface generations. Doubling the symbol rate from 59.84 to 118.203 GBd adds 2.95 dB to the reference term, so an 800ZR interface needs roughly 3 dB more optical signal-to-noise ratio than a 400ZR interface at the same electrical signal-to-noise ratio, before any difference in coding gain or implementation is counted. That is most of the gap between the 26.0 and 27.0 dB conformance limits, with oFEC's higher coding gain recovering the remainder. Moving to the 1600ZR class adds a further 3.29 dB of reference term over 800ZR.
Capacity per unit of spectrum moves in the opposite direction, which is what justifies the higher OSNR requirement at the higher rates. An 800ZR channel at 150 GHz spacing carries 5.33 Gb/s per GHz against 5.33 Gb/s per GHz for a 400ZR channel at 75 GHz, so the two are equal on spectral efficiency and the 800ZR case halves the port count, the module count and the power per bit. The generation, its extended-reach modes and its thermal envelope are covered in the 800ZR and 800ZR+ deep dive.
Takeaway: each doubling of symbol rate adds about 3 dB to the reference-bandwidth term, so a higher-rate interface starts from a higher required OSNR and returns the difference as port count, module count and power per bit rather than as spectral efficiency.
12. Standards Status and Interface Roadmap
Multi-vendor demonstration scale is the clearest available indicator of how far a specification has reached implementation, and it has grown with each generation. The OFC 2026 showcase integrated nearly 100 coherent modules from 15 vendors across eleven host platforms and four open line systems under four IP and optical controllers, and extended the configuration into L-band operation and multi-span transmission over multi-core fiber (forum statement, OIF). Forty member companies participated. One open line system in that demonstration carried third-party transceivers over a multi-span path of up to 300 km on SMF-28 fiber across both C-band and L-band (vendor claim, Adtran).
Three directions in current specification work change what a qualification programme has to cover. The 1600ZR project defines a single-carrier DP-16QAM interface for data center interconnect at up to 120 km amplified, and the companion 1600ZR+ project targets point-to-point Ethernet performance modes to 1,000 km, with 1200ZR+ modes to 2,000 km (forum-stated scope, OIF current work). A 1600CL coherent-lite variant is also being defined for shorter intra-campus reaches. Vendors have announced products against these projects, and some are prioritising 1600ZR time to market with a digital signal processor that does not carry the 1600ZR+ mode set while others target one processor for both, which makes the application-code matrix of Section 8 wider rather than narrower in the next generation.
The management side is moving with it. CMIS remains the single management interface across form factors and module classes, with a Versatile Control Set and a form-factor hardware management specification alongside the core document, and CMIS interoperability is now a demonstration category in its own right at OIF events. That matters for the telemetry accuracy question of Section 9: reported diagnostics only become an operational threshold when their reporting behaviour is itself specified and tested.
Two skills follow for engineers working in this area. The first is reading a conformance matrix as a distribution rather than a pass or fail, which is what Sections 5 to 7 set out. The second is building and maintaining a qualification record that survives supplier substitution, firmware revision and generation change, since the same programme structure applies unchanged from 400ZR through the 1600ZR class. Planning tools built on GSNR models support both, and in-house multi-vendor link planning and simulation covers how an operator assembles that capability.
Takeaway: interoperability testing scale is growing faster than interface count, and the next generation widens the application-code matrix rather than simplifying it, so the qualification programme is the durable asset rather than any single interface qualification.
13. Quick Reference
13.1 Key Values
| Quantity | Value | Evidence class |
|---|---|---|
| 400ZR receiver OSNR tolerance | 26.0 dB/0.1 nm | Standard-specified, OIF 400ZR Implementation Agreement |
| OpenZR+ 400G 16QAM OSNR tolerance | 24.0 dB/0.1 nm | Standard-specified, OpenZR+ MSA |
| 800ZR receiver OSNR tolerance | 27.0 dB/0.1 nm | Standard-specified, OIF 800ZR Implementation Agreement |
| 400ZR loopback range across ten modules | 22.44–25.90 dB/0.1 nm | Measured, OIF plugfest campaign |
| 400ZR full-matrix mean and standard deviation | 23.85 dB, 0.85 dB | Measured, OIF plugfest campaign |
| 400ZR full-matrix spread across 100 pairings | 3.94 dB | Derived from the published matrix |
| Mean gap, loopback to worst pairing (400ZR) | 1.56 dB | Derived from the published matrix |
| Mean gap, loopback to worst pairing (OpenZR+) | 2.20 dB | Derived from the published matrix |
| Transmitter share of matrix variance | 49.1% | Derived from the published matrix |
| Module-reported OSNR bias against an OSA | Up to 1.2 dB | Measured, OIF plugfest campaign |
| Reference bandwidth, 0.1 nm at 1550 nm | 12.478 GHz | Standard-specified conversion |
| OSNR reference constant at 1550 nm | 58 dB | Standard-specified conversion |
13.2 Essential Relations
The reference-bandwidth conversion is OSNR0.1 nm = SNRelec + 10 log10 (Rs / 12.478), with Rs in GBd. The single-span delivered OSNR is 58 + Pch − Lspan − NF, and N identical spans subtract a further 10 log10 (N). The design requirement is the worst qualified pairing plus the aging and uncertainty allowances, and the end-of-life margin is delivered OSNR minus that requirement.
13.3 Glossary
- Application select code — the CMIS identifier pairing a media interface with a host electrical interface, which both ends of a link must match.
- CFEC — concatenated forward error correction, the code specified in the OIF 400ZR Implementation Agreement.
- CMIS — Common Management Interface Specification, the register model a host uses to configure and monitor a pluggable module.
- EVM — error vector magnitude, the root-mean-square difference between the measured and ideal transmitted symbols.
- GSNR — generalized signal-to-noise ratio, which includes nonlinear interference alongside amplified spontaneous emission noise.
- Loopback measurement — a required OSNR measurement with a module's own transmitter driving its own receiver.
- oFEC — open forward error correction, the higher-gain code used by OpenZR+, Open ROADM and OIF 800ZR.
- Required OSNR — the lowest optical signal-to-noise ratio at which a given transmitter and receiver pair decodes without post-FEC errors.
- VDM — Versatile Diagnostics Monitoring, the CMIS register group carrying reported optical and decoder telemetry.
14. Conclusion
Compliance guarantees that two modules interwork and says nothing about the threshold they reach together. On the published 400ZR population, ten compliant modules produced required OSNR values across a 3.94 dB range, two pairings sat above the conformance limit, and a receiver's worst cross-vendor pairing sat on average 1.56 dB above its own loopback figure. The OpenZR+ population showed the same structure against a tighter limit, with a 2.20 dB mean gap and a 3.50 dB largest gap.
Three engineering consequences follow. A link budget in a mixed inventory is sized against the worst pairing the inventory policy permits, which on the four-span example of Section 7 is the difference between 3.04 dB of margin and a 0.52 dB shortfall. A qualification programme screens both ends against fixed references before running a matrix, because transmitter and receiver identity together explain 87.5% of the observed variance. And an alarm threshold is placed on pre-forward-error-correction Q rather than on module-reported OSNR, because that telemetry carries a per-link bias of up to 1.2 dB that does not average away.
The mechanism behind all three is the same. A specification defines an envelope, a population fills that envelope unevenly, and a network built by mixing suppliers inherits the width of the envelope rather than the performance of its best member. Multi-vendor testing is how the width becomes visible, and the qualification record is how it becomes a design input. Resilience in an open optical network is the product of that record being complete, current and reproducible, which is why firmware revisions belong in it alongside decibels.
References
- Optical Internetworking Forum, Implementation Agreement 400ZR, Optical Internetworking Forum.
- Optical Internetworking Forum, Implementation Agreement 800ZR, Optical Internetworking Forum.
- Optical Internetworking Forum, 400ZR Interoperability White Paper, OFC Plugfest, Optical Internetworking Forum.
- Optical Internetworking Forum, Open400ZR+ Interoperability White Paper, ECOC Plugfest, Optical Internetworking Forum.
- Optical Internetworking Forum, 800ZR Interoperability White Paper, OFC Plugfest, Optical Internetworking Forum.
- Optical Internetworking Forum, Common Management Interface Specification (CMIS), Optical Internetworking Forum.
- OpenZR+ Multi-Source Agreement, OpenZR+ MSA Technical Specification, OpenZR+ MSA Group.
- Open ROADM Multi-Source Agreement, Open ROADM Optical Specification, Open ROADM MSA.
- ITU-T G.694.1, Spectral Grids for WDM Applications: DWDM Frequency Grid, ITU-T Study Group 15.
- ITU-T G.698.2, Amplified Multichannel DWDM Applications with Single Channel Optical Interfaces, ITU-T Study Group 15.
- ITU-T G.652, Characteristics of a Single-Mode Optical Fibre and Cable, ITU-T Study Group 15.
- IEEE 802.3, Standard for Ethernet, IEEE Standards Association.
Related Articles on MapYourTech