
Generic selectors
Exact matches only
Search in title
Search in content
Post Type Selectors
Articles
lp_course
lp_lesson
Back
HomeCoherent OpticsASE Noise in Optical Amplifiers
ASE Noise in Optical Amplifiers

ASE Noise in Optical Amplifiers

Last Updated: April 2, 2026
32 min read
132
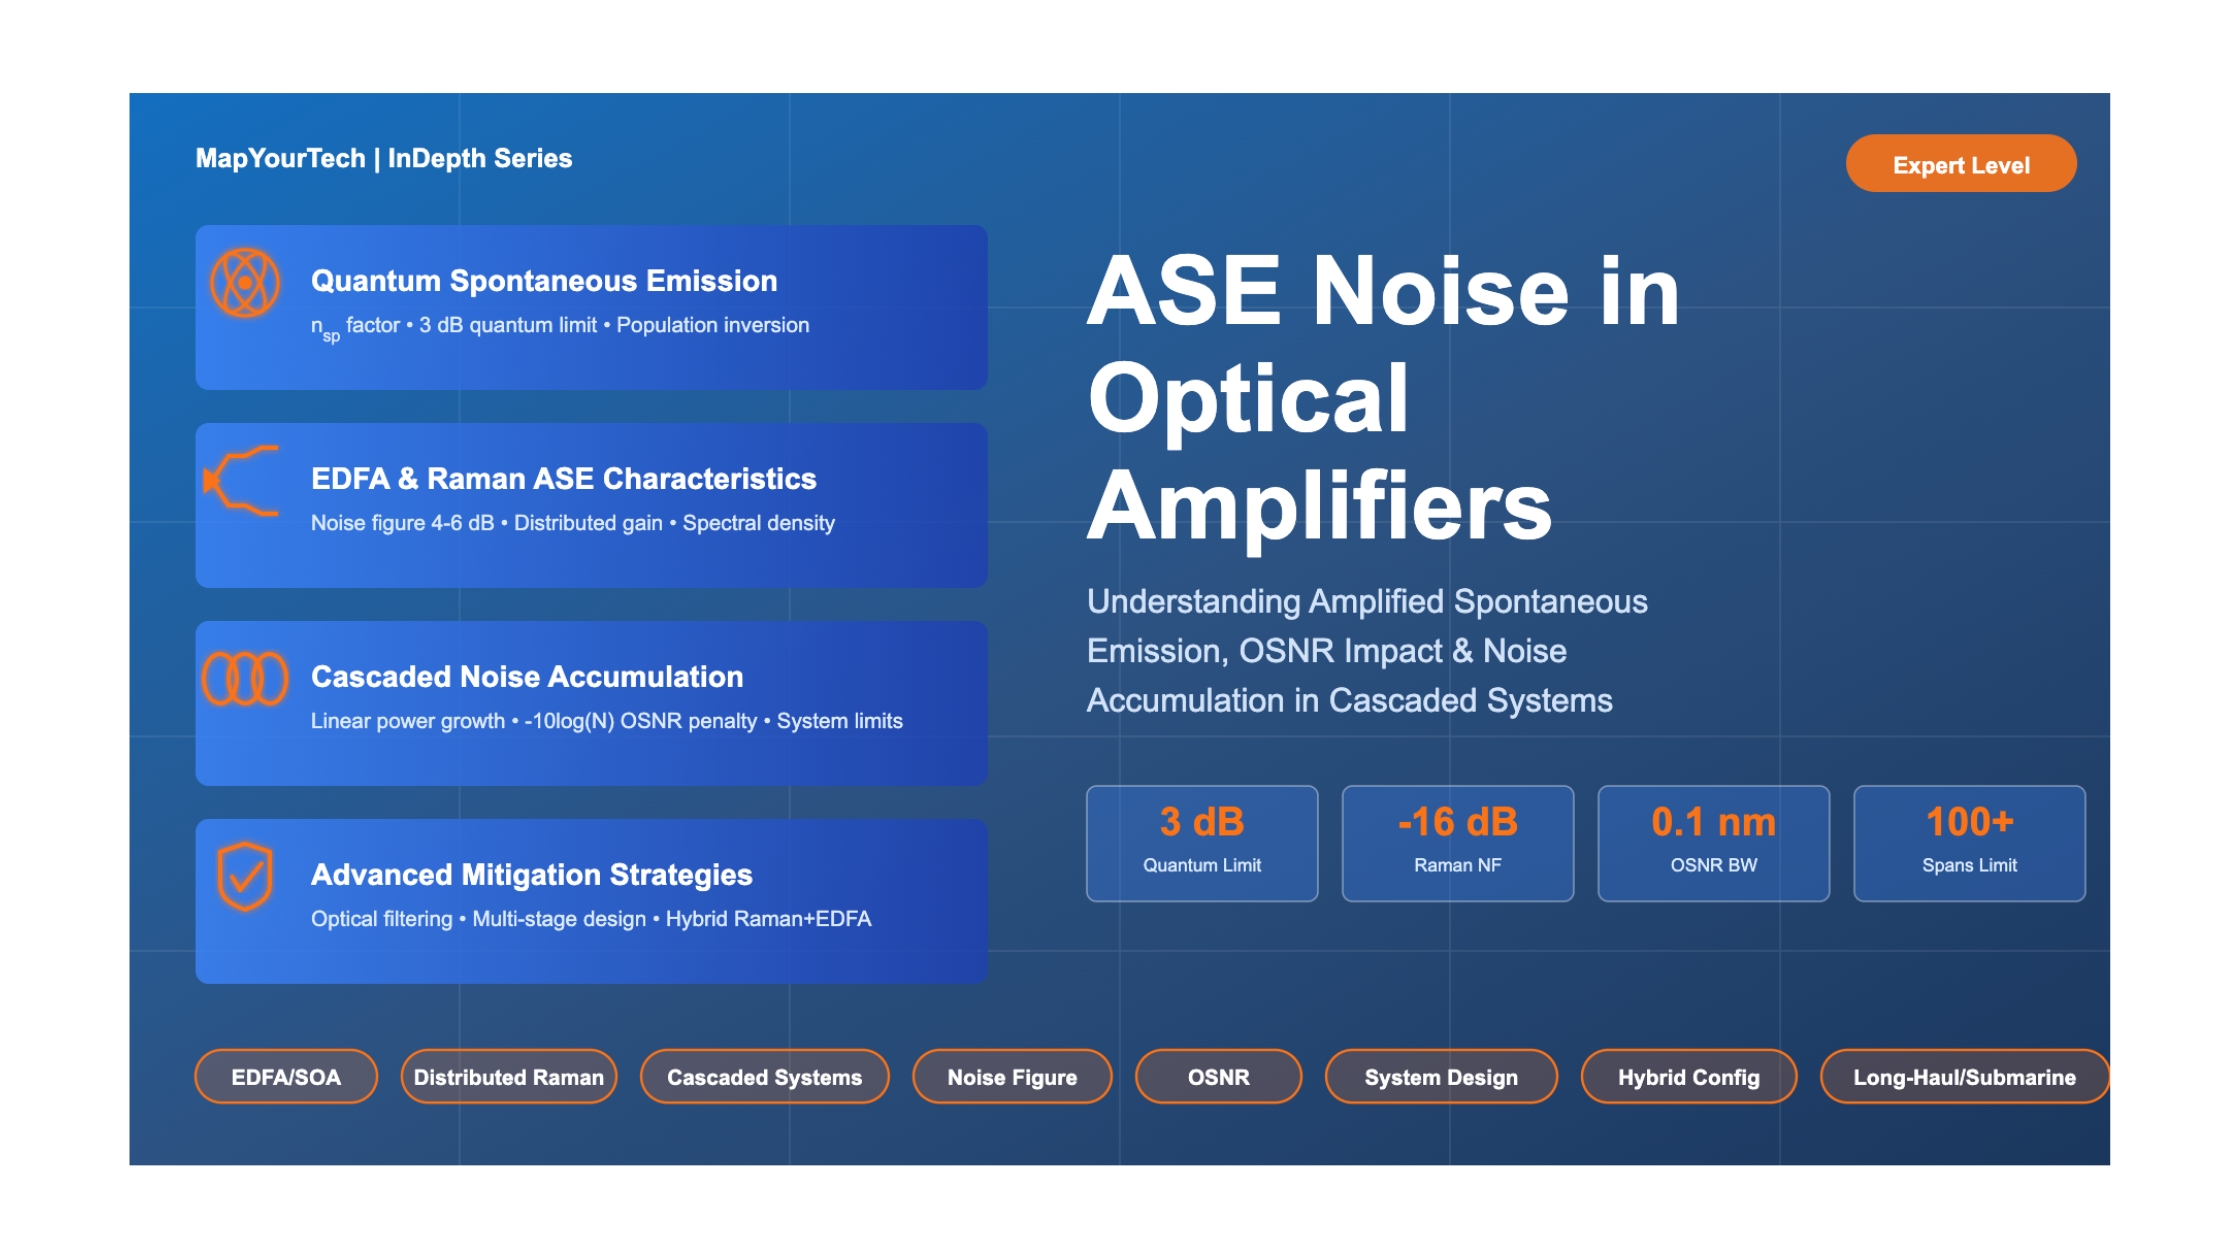
ASE Noise in Optical Amplifiers: Understanding Amplified Spontaneous Emission, OSNR Impact, and Cascaded Amplifier Noise Accumulation - Expert Deep Dive
ASE Noise in Optical Amplifiers - Image 1

ASE Noise in Optical Amplifiers

Expert Deep Dive: Understanding Amplified Spontaneous Emission, OSNR Impact, and Noise Accumulation in Cascaded Amplifiers
Optical Amplifier EDFA & Raman OSNR Analysis Noise Figure System Design

Introduction

Amplified Spontaneous Emission (ASE) represents one of the most fundamental and unavoidable noise mechanisms in optical amplification systems, profoundly impacting the performance, reach, and capacity of modern fiber-optic communication networks. In the era of 400G, 800G, and emerging terabit coherent transmission systems, understanding the physics, mathematical characterization, and mitigation strategies for ASE noise has become essential for network architects and optical systems engineers.

ASE noise originates from the quantum-mechanical process of spontaneous emission inherent to all optical amplifiers, including Erbium-Doped Fiber Amplifiers (EDFAs), Semiconductor Optical Amplifiers (SOAs), and Raman amplifiers. When pump energy excites dopant ions or creates population inversion in the gain medium, electrons spontaneously decay from higher to lower energy states, emitting photons in random directions with random phases. Unlike the coherent signal photons generated through stimulated emission, these spontaneous photons are amplified alongside the signal, creating a broadband noise background that accumulates with each amplification stage in cascaded systems.

The significance of ASE noise extends beyond simple signal degradation. It directly determines the Optical Signal-to-Noise Ratio (OSNR), which serves as the primary figure of merit for optically amplified transmission systems. As OSNR degrades through cascaded amplification, the receiver's ability to correctly decode transmitted information deteriorates, ultimately limiting maximum transmission distance, channel count in Dense Wavelength Division Multiplexing (DWDM) systems, and achievable data rates. Modern 400G coherent systems with advanced modulation formats like 16-QAM or 64-QAM are particularly sensitive to OSNR degradation, requiring careful ASE noise management throughout the optical path.

This detailed analysis provides comprehensive coverage of ASE noise physics, mathematical modeling, measurement techniques, and mitigation strategies. We examine the fundamental mechanisms of ASE generation in EDFAs and Raman amplifiers, derive the governing equations for noise figure and OSNR evolution in cascaded systems, and explore advanced topics including ASE spectral characteristics, polarization properties, and interaction with fiber nonlinearities. The analysis integrates both theoretical frameworks and practical system design considerations, supported by detailed visualizations and worked examples from deployed optical networks.

Understanding ASE noise is not merely an academic exercise but a critical requirement for designing next-generation optical transport systems. As network operators transition to higher-capacity coherent transmission, space-division multiplexing, and ultra-long-haul submarine systems, the interplay between ASE noise, modulation format selection, forward error correction overhead, and nonlinear impairments becomes increasingly complex. This deep dive equips senior engineers and system architects with the analytical tools and physical insights needed to optimize amplifier placement, select appropriate gain and power levels, and predict system performance limits in ASE-dominated regimes.

Figure 1: ASE Generation Mechanism in EDFA

Visualization of spontaneous emission and amplification process in erbium-doped fiber

Erbium-Doped Fiber Core Pump 980nm Signal 1550nm Er3+ (Ground) Er3+ (Excited) Spontaneous Emission Stimulated Emission Amplified Signal + ASE Noise Pump Absorption Erbium ions excited to higher energy level Spontaneous Emission Random decay creates photons in all directions Stimulated Emission Signal photons trigger coherent amplification ASE photons are amplified alongside signal, creating broadband noise background

1. Fundamental Physics of ASE Noise Generation

1.1 Quantum Mechanical Origins

The generation of ASE noise in optical amplifiers is rooted in the quantum-mechanical nature of light-matter interaction within the gain medium. When a population inversion is established through optical pumping, electrons (or more precisely, dopant ions in fiber amplifiers) occupy excited energy states. According to quantum mechanics, these excited states have finite lifetimes, typically on the order of milliseconds for erbium ions in EDFAs. The transition from an excited state to the ground state can occur through two distinct mechanisms: stimulated emission and spontaneous emission.

Stimulated emission occurs when an incoming photon with energy matching the transition energy interacts with an excited ion, triggering the emission of a second photon that is coherent with the incident photon—having identical phase, polarization, and propagation direction. This process forms the basis of optical amplification and laser operation. However, even in the absence of an external stimulating field, excited ions will spontaneously decay to lower energy states, emitting photons with random phases and propagation directions. This spontaneous emission is fundamentally unavoidable, as dictated by Heisenberg's uncertainty principle and the finite lifetime of excited quantum states.

The spontaneous emission factor nsp quantifies the efficiency of population inversion in the gain medium and directly relates to the minimum achievable noise figure. For a three-level atomic system with uniform populations N2 (excited state) and N1 (ground state), the spontaneous emission factor is defined as:

Spontaneous Emission Factor

The spontaneous emission factor represents the population inversion efficiency and determines the minimum noise contribution:

nsp = N2 / (N2 - N1)

Where:
  nsp = Spontaneous emission factor (dimensionless)
  N2 = Population density in excited state (ions/m³)
  N1 = Population density in ground state (ions/m³)

Key Insights:
  • For complete inversion (N1 → 0): nsp → 1 (quantum limit)
  • Typical EDFA operation: nsp ≈ 1.3 to 2.0
  • Higher pump power → better inversion → lower nsp
  • 980nm pump provides better inversion than 1480nm
  • Noise figure minimum: NFmin = 2nsp ≈ 3 dB (ideal case)

The quantum limit of nsp = 1 corresponds to complete population inversion, where all ions are in the excited state and none remain in the ground state. This theoretical limit yields a minimum noise figure of 3 dB for an ideal amplifier with infinite gain. In practical EDFAs, achieving nsp values approaching 1.3 requires careful optimization of pump wavelength, pump power, erbium dopant concentration, and fiber length. The 980 nm pump wavelength generally provides superior inversion efficiency compared to 1480 nm pumping, resulting in lower spontaneous emission factors and improved noise performance.

1.2 ASE Power Spectral Density

Spontaneously emitted photons that are guided within the fiber core experience amplification through stimulated emission as they propagate through the gain medium, just as signal photons do. This amplification of spontaneous emission creates the characteristic ASE noise spectrum that extends across the entire gain bandwidth of the amplifier. Unlike the signal, which occupies a narrow spectral region defined by the modulation format and data rate, ASE noise is distributed continuously across wavelengths where gain exists—typically 1530-1565 nm for C-band EDFAs and 1570-1610 nm for L-band EDFAs.

The ASE power generated by an optical amplifier depends on several key parameters: the amplifier gain G, the spontaneous emission factor nsp, the optical bandwidth Bo over which the noise is measured, and fundamental constants including Planck's constant h and the photon frequency ν. The total ASE power in both polarization states is given by:

ASE Noise Power Formula

Total ASE power generated in both polarization states across optical bandwidth Bo:

PASE = 2 × nsp × (G - 1) × h × ν × Bo

Where:
  PASE = Total ASE power in both polarizations (W)
  nsp = Spontaneous emission factor (typically 1.3-2.0)
  G = Amplifier gain (linear units, not dB)
  h = Planck's constant = 6.626 × 10⁻³⁴ J·s
  ν = Optical frequency (Hz) ≈ 193.1 THz at 1550 nm
  Bo = Optical bandwidth (Hz) - typically 12.5 GHz (0.1 nm)
  2 = Factor accounting for two orthogonal polarization states

Standard Reference Bandwidth:
  Bo = 0.1 nm = 12.5 GHz at λ = 1550 nm
  This bandwidth is convention for OSNR measurements

Example Calculation:
  Given: G = 20 dB = 100 (linear), nsp = 1.5, λ = 1550 nm
  
  PASE = 2 × 1.5 × (100 - 1) × (6.626×10-34) × (1.934×1014) × (12.5×109)
  
  PASE ≈ 5.0 × 10⁻⁶ W = -23 dBm (in 0.1 nm bandwidth)

Key Observations:
  • ASE power scales linearly with (G-1) → higher gain = more ASE
  • Factor of 2 for polarization is critical - often forgotten!
  • ASE proportional to optical bandwidth - wider filters = more noise
  • For G >> 1: PASE ≈ 2nsphνGBo
Premium Article — Free 21% Preview

Read the Full Analysis with Premium

The remaining 79% of this article — the design numbers, trade-offs and field guidance — is part of MapYourTech Premium, along with the full premium library, courses and professional tools.
Instant access · Cancel anytime · 48-hour trial available
Sanjay Yadav

Optical Communications & Network Automation Expert | Author of 3 Books for Optical Engineers | Founder, MapYourTech

Optical networking engineer with nearly two decades of experience across DWDM, OTN, coherent optics, submarine systems, and cloud infrastructure. Founder of MapYourTech.

Follow on LinkedIn

You May Also Like

15 min read 6 0 Like Connector Types and Their Loss Budgets: SC, LC, MPO Skip to main content MapYourTech...
  • Free
  • July 11, 2026
16 min read 6 0 Like Cooled vs Uncooled Lasers: The Pluggable Power Trade-off Skip to main content MapYourTech |...
  • Free
  • July 11, 2026
16 min read 8 0 Like Automation Blast Radius: Scoping What a Bad Intent Can Touch Skip to main content...
  • Free
  • July 11, 2026

Course Title

Course description and key highlights

Course Content

Course Details