20 min read

Digital Signal Processing in Modern Subsea Optical Systems
Introduction
Digital Signal Processing (DSP) has fundamentally transformed subsea optical communications, making possible transmission capacities and distances that legacy direct-detection technologies could not achieve. Modern submarine cable systems carry over 99 percent of intercontinental internet traffic, supporting global cloud services, financial transactions, streaming platforms, and all forms of international digital communication. The DSP subsystems in these systems compensate for transmission impairments accumulated over distances exceeding 12,000 kilometers while processing signals at rates beyond 100 gigabaud.
This article provides comprehensive technical reference material on DSP in subsea optical systems. The content addresses coherent detection mechanisms, chromatic dispersion compensation algorithms, polarization demultiplexing techniques, forward error correction coding, and modulation format selection. Engineers and technical professionals will gain knowledge required to understand, design, optimize, and troubleshoot modern coherent subsea transmission systems. The scope includes current deployments and emerging technologies that will shape the next generation of submarine cable infrastructure.
Fundamental Principles
Coherent Detection Architecture
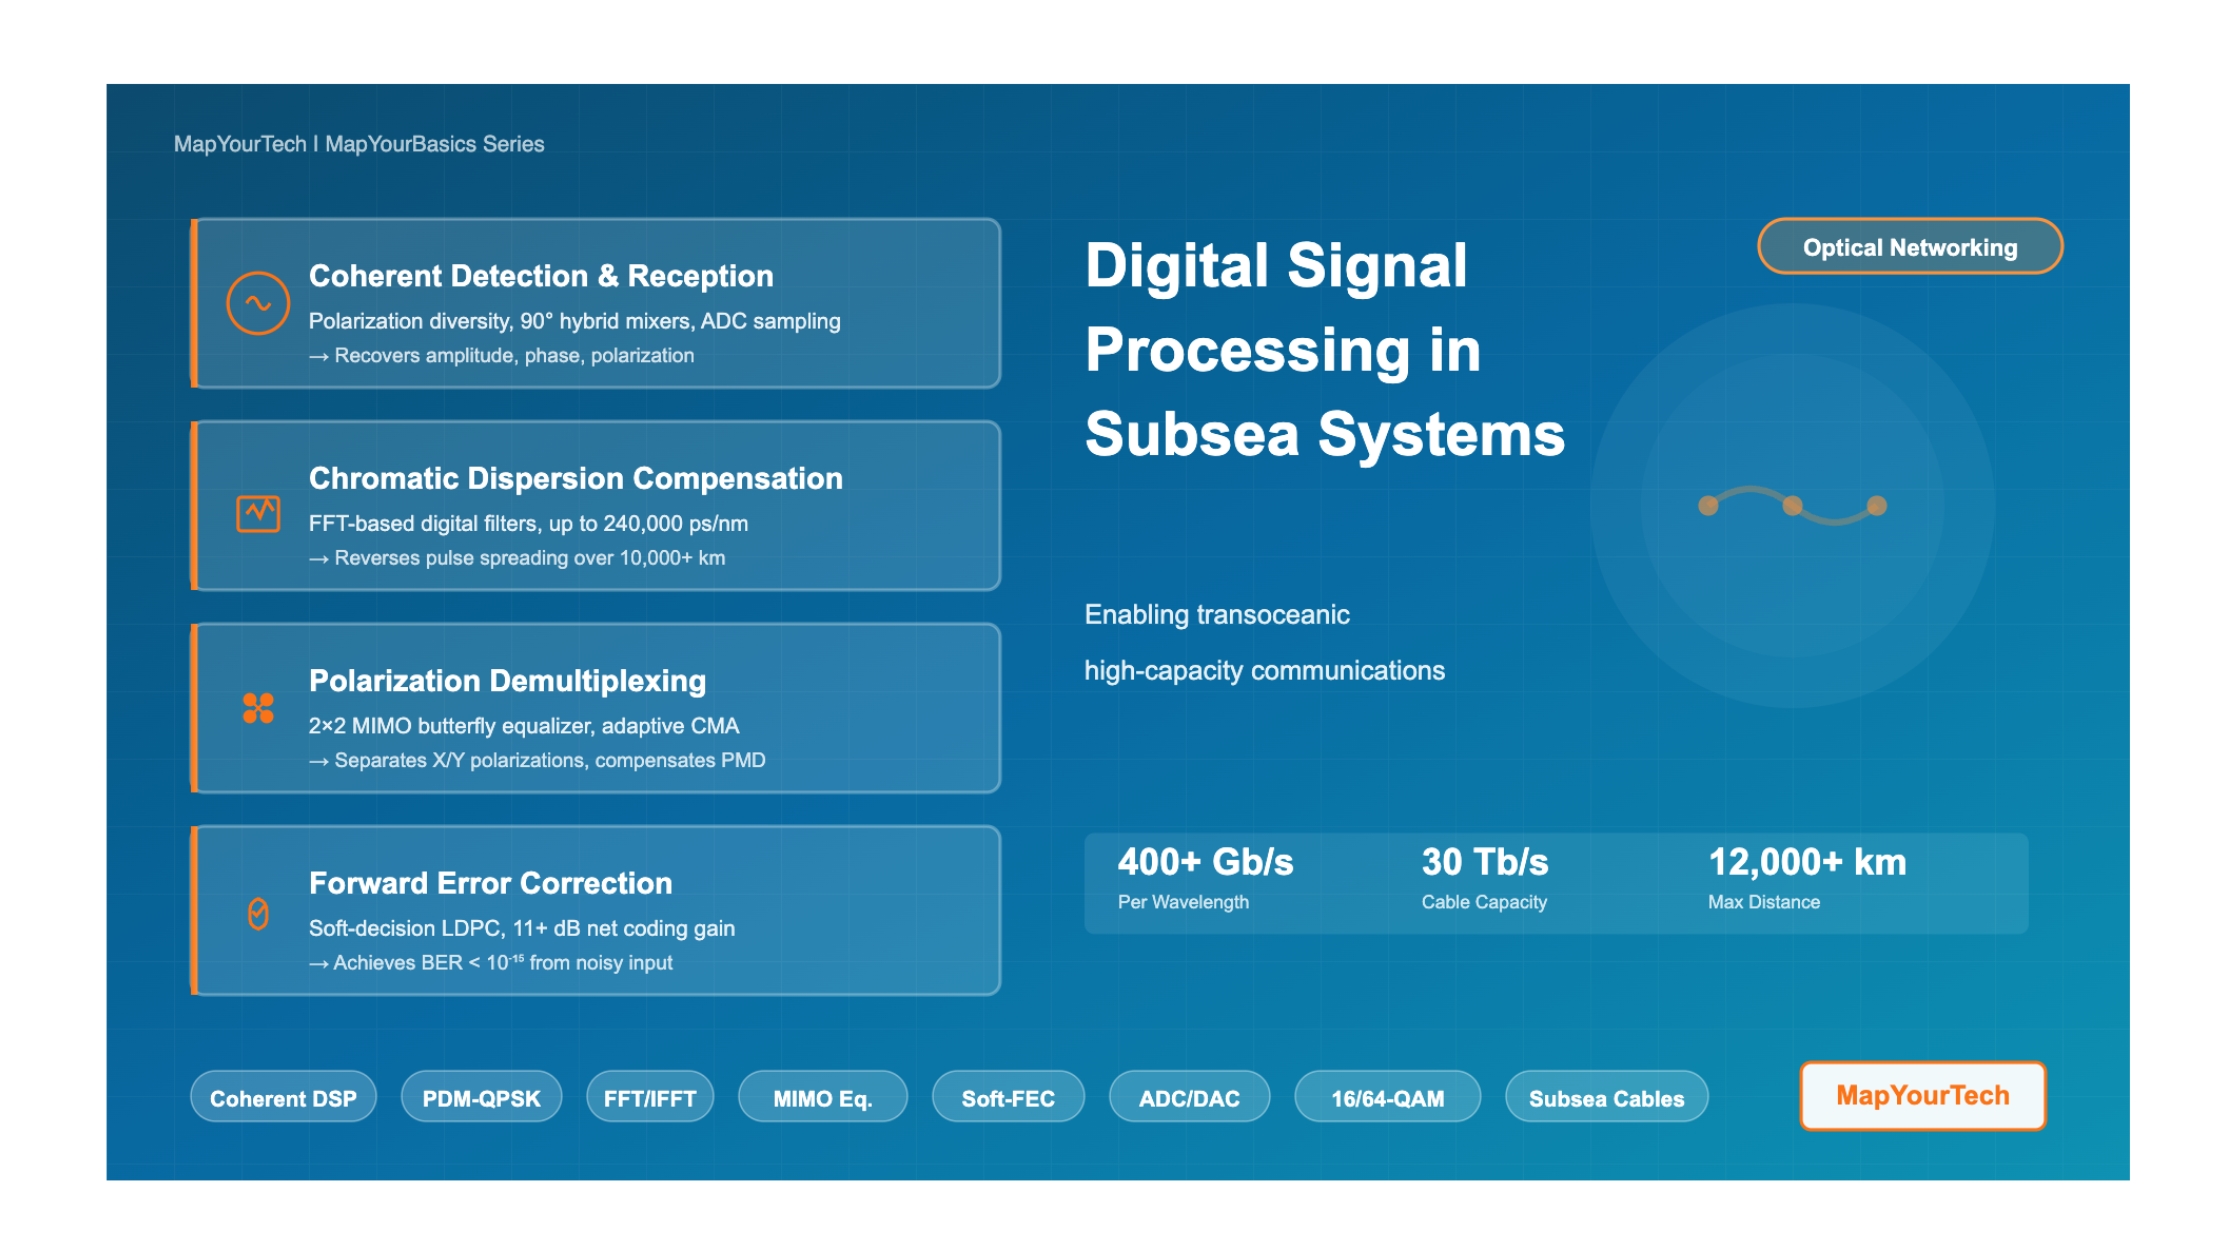
Coherent optical detection forms the foundation that enables comprehensive DSP functionality in subsea systems. Unlike direct detection, which captures only signal intensity, coherent detection recovers the complete optical electric field including amplitude, phase, and polarization state. This complete field recovery allows digital processing algorithms to reverse transmission impairments that would otherwise render signals unrecoverable after transoceanic propagation.
The coherent receiver architecture employs a local oscillator laser operating at nearly the same frequency as the signal carrier wavelength. When the incoming optical signal mixes with the local oscillator in 90-degree optical hybrids, the resulting interference produces intermediate frequency signals containing all encoded information. The receiver implements polarization diversity using a polarization beam splitter to separate the two orthogonal polarization states, followed by two coherent mixers (one per polarization) that each generate in-phase and quadrature components. Four high-speed photodetectors convert these optical interference signals to electrical currents. Analog-to-digital converters (ADCs) operating at sampling rates typically twice the symbol rate then digitize these electrical signals.
ADC Performance Requirements
The Shannon-Nyquist sampling theorem dictates that ADCs must sample at least twice the signal bandwidth. Modern subsea systems employ ADCs with sampling rates around 64 to 120 gigasamples per second for 32 to 60 Gbaud signals. The effective number of bits (ENOB) typically ranges from 5 to 6 bits, providing sufficient dynamic range and quantization resolution for accurate signal reconstruction. The ADC 3-dB bandwidth approximates 50 percent of the symbol rate in practical implementations.
Coherent Receiver Architecture with Digital Signal Processing Chain
Complete signal path from optical frontend through DSP blocks to recovered data output
Chromatic Dispersion and Compensation Mechanisms
Chromatic dispersion occurs because different wavelength components of an optical signal propagate at slightly different velocities through optical fiber. The group velocity dispersion parameter, typically around 17 to 21 picoseconds per nanometer per kilometer for standard single-mode fiber at 1550 nanometers, causes optical pulses to spread temporally as they travel. For a 10,000 kilometer subsea system, the total accumulated chromatic dispersion reaches approximately 210,000 ps/nm, spreading pulses to the extent that individual symbols become completely overlapped and indistinguishable without compensation.
The DSP compensates chromatic dispersion by implementing the inverse transfer function in the frequency domain. The compensation algorithm transforms the time-domain waveform to the frequency domain using Fast Fourier Transform (FFT), applies the complex conjugate of the fiber dispersion transfer function through complex multiplication, and transforms back to the time domain using Inverse FFT (IFFT). This approach proves computationally efficient because convolution in the time domain corresponds to multiplication in the frequency domain.
Chromatic Dispersion Compensation Transfer Function
H_CD(β₂, L, ω) = exp(iβ₂ω²L/2)

Where:
  β₂ = second-order dispersion coefficient (ps²/km)
  L = fiber length (km)
  ω = angular frequency offset from carrier (rad/s)

Compensation Steps:
1. FFT: Transform time-domain signal to frequency domain
2. Multiply by H_CD* (complex conjugate of fiber response)
3. IFFT: Transform back to time domain

For 10,000 km system at 1550 nm with 30 GHz channel:
- Total accumulated dispersion: ~210,000 ps/nm
- Number of interfering symbols: ~1500
- Required FFT size: 3000-4000 points
- Processing power consumption: ~40% of total DSP capacity
The exact accumulated dispersion value remains unknown initially and must be estimated during system startup. The DSP employs a search algorithm that systematically tests different dispersion values to minimize the residual dispersion penalty. Modern implementations use overlap-and-save or overlap-and-add algorithms to enable continuous processing of the data stream without frame boundaries.
Polarization Mode Dispersion and MIMO Processing
Modern subsea systems transmit independent data streams on the two orthogonal polarization states of light, effectively doubling spectral efficiency. However, fiber birefringence causes the polarization state to evolve unpredictably along the transmission path, mixing the two transmitted signals. Polarization Mode Dispersion (PMD) further complicates signal recovery by introducing differential group delay between the polarization components, where different polarization states arrive at different times.
The DSP addresses these polarization effects using a two-by-two multiple-input multiple-output (MIMO) equalizer with butterfly structure. Four finite impulse response (FIR) filters designated h_xx, h_xy, h_yx, and h_yy simultaneously demultiplex the polarization tributaries and equalize transmission distortions. The Constant Modulus Algorithm (CMA) provides adaptive updates to the filter coefficients, maintaining optimal equalization as polarization conditions change due to environmental factors affecting the undersea cable.
MIMO Butterfly Equalizer Mathematical Model
Output signals from 2×2 MIMO equalizer:

O₁(n) = h_xx ⊗ I₁ + h_xy ⊗ I₂
O₂(n) = h_yx ⊗ I₁ + h_yy ⊗ I₂

Where:
  ⊗ = convolution operator
  I₁, I₂ = input signals (mixed polarizations from ADCs)
  O₁, O₂ = output signals (separated polarizations)
  h_xx, h_xy, h_yx, h_yy = adaptive FIR filter tap coefficients

CMA Coefficient Update Rule:
h(n+1) = h(n) + μ · e(n) · I*(n)

Where:
  μ = step size parameter (controls adaptation speed)
  e(n) = error signal = (R² - |O(n)|²) · O(n)
  R = target modulus (unity for normalized QPSK)
  I* = complex conjugate of input

Typical Implementation Parameters:
- Filter length: 9-17 taps per FIR filter
- PMD compensation range: 100-200 picoseconds
- Tracking bandwidth: tens of kilohertz
- Convergence time: less than 1 millisecond
The adaptive nature of the MIMO equalizer enables tracking of environmental changes in the subsea cable, including polarization rotation caused by ocean currents, seismic activity, temperature variations, and cable movements. Modern implementations successfully track polarization changes at rates exceeding 10 kilohertz while maintaining clean constellation diagrams with minimal inter-symbol interference.
Technical Architecture and System Model
DSP ASIC Implementation Architecture
Modern coherent DSP implementations integrate all processing functions into Application-Specific Integrated Circuits (ASICs) built using advanced CMOS technology nodes ranging from 16 nanometers to 5 nanometers. A state-of-the-art DSP ASIC processing 100 gigabaud signals contains billions of transistors operating at multi-gigahertz clock frequencies while consuming power levels from 50 to 80 watts. This represents a critical constraint for systems that must operate reliably for 25 years on the ocean floor.
The ASIC architecture partitions into several major functional blocks. The ADC interface section provides high-speed serial connections supporting 80 to 120 gigasamples per second aggregate bandwidth across four input channels. The chromatic dispersion compensation engine implements large FFT and IFFT blocks, typically 3000 to 4000 points, with dedicated hardware for complex multiplication. Clock recovery circuitry employs digital phase-locked loops achieving sub-picosecond jitter performance. The MIMO equalizer section contains parallel FIR filter banks with adaptive coefficient update engines running at symbol rate. Carrier phase recovery blocks estimate frequency offset and track phase noise. The FEC decoder occupies substantial chip area, often consuming 40 percent of the total silicon, with massive parallel processing arrays for Low-Density Parity-Check (LDPC) decoding. Embedded CPU cores handle system management, performance monitoring, and algorithm parameter adaptation.
Modulation Format Architecture
The choice of modulation format represents a fundamental trade-off between transmission reach and capacity. Quadrature Phase Shift Keying (QPSK) encodes 2 bits per symbol using four phase states separated by 90 degrees, providing excellent optical signal-to-noise ratio (OSNR) sensitivity around 11 to 12 decibels for 100 gigabits per second polarization-division multiplexed QPSK and strong tolerance to fiber nonlinear effects due to constant signal envelope.
Higher-order Quadrature Amplitude Modulation (QAM) formats increase spectral efficiency at the expense of noise tolerance. The format designated 8-QAM encodes 3 bits per symbol, 16-QAM handles 4 bits per symbol, and 64-QAM carries 6 bits per symbol. However, constellation points become progressively closer together, requiring higher OSNR and more sophisticated DSP algorithms to maintain acceptable bit error rates. Modern subsea systems employ adaptive modulation where different channels or cable segments use different modulation orders based on OSNR availability and distance requirements.
Modulation Format Constellation Diagrams and Reach Comparison
QPSK, 8-QAM, 16-QAM, and 64-QAM showing capacity versus distance trade-offs
Forward Error Correction Architecture
Forward Error Correction (FEC) adds controlled redundancy to transmitted data, enabling the receiver to detect and correct errors caused by optical noise, thereby permitting operation at significantly lower OSNR levels than would otherwise be achievable. Early submarine systems employed Reed-Solomon (RS) codes with hard-decision decoding, typically RS(255,239) providing 6.7 percent overhead and achieving coding gains around 5.8 decibels. Hard-decision FEC makes binary zero or one decisions on received bits before error correction, discarding valuable information about signal quality.
Soft-decision FEC revolutionized subsea transmission by using multi-bit quantized samples from the ADCs, typically 3 to 5 bits per sample, providing confidence information for each bit decision. Modern systems employ Low-Density Parity-Check (LDPC) codes or concatenated coding schemes that achieve net coding gains exceeding 11 decibels with overheads ranging from 15 to 25 percent. These advanced FEC implementations approach within 1 to 2 decibels of the Shannon limit, the theoretical maximum coding gain for a given overhead level.
Forward Error Correction Performance Metrics
Coding Gain (CG) = Q_after_FEC - Q_before_FEC (in dB)

Net Coding Gain (NCG) = CG - 10 × log₁₀(n/k)

Where:
  n = total bits in codeword (data + redundancy)
  k = information bits in codeword
  n/k = redundancy ratio (overhead factor)

The 10×log₁₀(n/k) term accounts for the penalty from increasing
symbol rate due to redundant bits, which increases noise power.

Example: Modern Soft-Decision LDPC FEC
- Coding Gain: 12.5 dB (improves from BER 10⁻³ to 10⁻¹⁵)
- Overhead: 20 percent (n/k = 1.2)
- Overhead Penalty: 10×log₁₀(1.2) = 0.79 dB
- Net Coding Gain: 12.5 - 0.79 = 11.71 dB

This 11.7 dB NCG provides equivalent benefit to:
- Extending reach by approximately 700 kilometers
- Reducing required OSNR by 11.7 dB
- Supporting approximately 14 additional repeater spans
Operational Behavior and Mechanism
System Startup and Initialization Sequence
The DSP subsystem executes a structured initialization sequence when a subsea system powers up or a channel becomes active. The process begins with ADC calibration to optimize sampling phase and amplitude levels. The chromatic dispersion estimation algorithm performs a coarse search across the expected dispersion range, typically testing values from zero to 300,000 ps/nm in steps of 5,000 to 10,000 ps/nm. Signal quality metrics guide the search toward the optimal value, followed by fine tuning in smaller steps to achieve residual dispersion below 100 ps/nm.
Following dispersion compensation convergence, the MIMO equalizer initialization begins. The butterfly filter taps start from initial values, often an identity matrix configuration, and the CMA algorithm iteratively updates coefficients to separate the polarization tributaries. Convergence typically completes within 1 to 10 milliseconds depending on signal quality and polarization coupling strength. The carrier phase recovery block then estimates and tracks the frequency offset between local oscillator and signal carrier, which may reach several gigahertz due to laser frequency drift. Phase noise tracking engages to maintain constellation quality. Finally, the FEC decoder synchronizes to frame boundaries and begins error correction operations.
Adaptive Operation and Environmental Tracking
Once initialized, the DSP continuously adapts to changing channel conditions. The MIMO equalizer tracks polarization state changes at rates up to tens of kilohertz, responding to cable movements caused by ocean currents, temperature variations, and seismic activity. The carrier phase recovery adapts to laser frequency drift and phase noise variations. Performance monitoring algorithms continuously measure pre-FEC bit error rate, post-FEC bit error rate, estimated OSNR, chromatic dispersion, and PMD values.
The system can detect degradations indicating component aging, fiber damage, or amplifier performance changes. When performance metrics approach alarm thresholds, the system generates notifications for proactive maintenance. Some implementations incorporate machine learning algorithms that analyze long-term performance trends to predict component failures before they impact service availability.
Performance Considerations and Trade-offs
OSNR Requirements and System Margin
The optical signal-to-noise ratio (OSNR) represents the primary performance metric for coherent subsea systems. OSNR quantifies the ratio of signal power to amplified spontaneous emission (ASE) noise power within a defined optical bandwidth, typically 0.1 nanometers (approximately 12.5 gigahertz at 1550 nanometers). Modern 100 gigabits per second PDM-QPSK systems require OSNR values around 11 to 12 decibels to achieve bit error rates below 10⁻¹⁵ after FEC decoding.
Higher-order modulation formats demand progressively higher OSNR due to reduced Euclidean distance between constellation points. A 16-QAM system typically requires 3 to 4 decibels additional OSNR compared to QPSK for equivalent error performance. The system must provision adequate OSNR margin to accommodate component aging, cable repairs that introduce additional loss, environmental variations affecting amplifier performance, and worst-case polarization-dependent loss conditions.
Power Consumption and Thermal Management
Power efficiency remains critical in subsea applications where transponders must dissipate heat in the confined environment of submarine line terminal equipment cabinets. A typical modern coherent transceiver consumes 50 to 80 watts, with the DSP ASIC representing the largest power consumer. Modern implementations employ dynamic voltage and frequency scaling to adapt processing resources to traffic load, clock gating to disable inactive circuit portions, and algorithmic optimizations to reduce computational requirements without degrading performance. Advanced CMOS process nodes including 7 nanometers and 5 nanometers provide superior performance-per-watt compared to older technology generations.
| Parameter | Direct Detection Legacy | Coherent DSP Modern |
|---|---|---|
| Recovered Information | Intensity only | Amplitude, phase, polarization |
| Spectral Efficiency | 0.4 - 0.8 bits/s/Hz | 3.5 - 6+ bits/s/Hz |
| CD Compensation | Optical domain (DCF modules) | Digital domain (FFT-based) |
| PMD Tolerance | Limited (under 20 ps for 10 Gb/s) | Excellent (100-200 ps for 100 Gb/s) |
| OSNR Requirement | Higher (15-18 dB for 10 Gb/s) | Lower (11-14 dB for 100 Gb/s QPSK) |
| Capacity per Wavelength | 10 Gb/s maximum | 100 Gb/s to 1.2 Tb/s |
| System Flexibility | Fixed optical compensation | Software-reconfigurable parameters |
Nonlinear Impairment Tolerance
Fiber nonlinear effects including self-phase modulation (SPM), cross-phase modulation (XPM), and four-wave mixing (FWM) impose fundamental limits on achievable capacity. Modern uncompensated subsea systems with uniform positive dispersion fiber exhibit reduced nonlinear penalties compared to legacy dispersion-managed systems because large chromatic dispersion causes rapid signal walk-off between wavelength channels. Advanced DSP implementations can apply digital backpropagation algorithms to partially compensate deterministic nonlinear distortions, though real-time implementation complexity limits the number of digital propagation steps that can be computed within power and latency constraints.
Practical Applications and Use Cases
Transoceanic Cable System Example
A modern transoceanic cable system spanning 10,000 kilometers across the Atlantic Ocean typically implements the following specifications. The system achieves total capacity of 30 terabits per second per fiber pair using 150 wavelength channels each carrying 200 gigabits per second. Modulation format selection uses adaptive approaches, with QPSK for the longest spans where OSNR margin is minimal and 8-QAM for shorter spans where excess OSNR permits higher spectral efficiency.
The DSP subsystem compensates chromatic dispersion up to 210,000 picoseconds per nanometer accumulated over the cable length. Polarization mode dispersion tolerance extends to 150 picoseconds differential group delay. The soft-decision FEC provides 11.5 decibels net coding gain with approximately 20 percent overhead. Optical repeaters spaced 50 to 70 kilometers apart amplify signals, with exact spacing depending on ocean depth, bottom topology, and cable routing constraints. The system design targets 25-year operational lifetime with software upgradeability for future capacity increases through improved modulation formats or advanced DSP algorithms.
Regional Submarine System Applications
Regional submarine systems connecting neighboring countries or spanning distances under 3,000 kilometers can employ higher-order modulation formats including 16-QAM or 64-QAM to maximize spectral efficiency. These shorter distances accumulate less chromatic dispersion and ASE noise, providing OSNR budgets sufficient to support the tighter constellation spacing of advanced modulation schemes. Regional systems often achieve per-wavelength capacities exceeding 400 gigabits per second, approaching the theoretical Shannon limit for the available OSNR.
Performance Monitoring and Optimization
Modern DSP systems incorporate comprehensive telemetry and performance monitoring capabilities. Parameters tracked in real-time include pre-FEC and post-FEC bit error rates, estimated Q-factor and OSNR, chromatic dispersion and PMD measurements, carrier frequency offset and phase noise characteristics, adaptive equalizer tap coefficient values indicating channel state, and environmental metrics including temperature, power consumption, and signal levels. This telemetry enables proactive maintenance, early fault detection before service impact, and continuous optimization of system performance parameters. Machine learning algorithms increasingly analyze historical telemetry data to predict component aging trends, optimize DSP algorithm parameters, and maximize available system margin.
Limitations and Boundary Conditions
Computational Complexity Constraints
DSP processing capability faces fundamental limits imposed by CMOS technology scaling, power consumption budgets, and thermal dissipation requirements. The chromatic dispersion compensation block consumes approximately 40 percent of total DSP processing power for transoceanic distances. Adding comprehensive nonlinear compensation through digital backpropagation would require processing power increases of 5 to 10 times, exceeding practical power and cost constraints for real-time implementation. Current systems therefore limit nonlinear compensation to simplified algorithms providing modest performance gains of 0.5 to 1 decibel.
Laser Phase Noise and Linewidth Requirements
The combined linewidth of the transmitter laser and local oscillator laser must remain sufficiently narrow to prevent phase noise from degrading signal quality. For systems compensating large chromatic dispersion digitally, the equalization-enhanced phase noise (EEPN) effect causes phase noise to be amplified by the chromatic dispersion compensation process. Practical laser linewidth values below 100 kilohertz maintain EEPN within acceptable limits even after 10,000 kilometers of accumulated dispersion. Tighter linewidth requirements apply for higher-order modulation formats with denser constellation spacing.
System Design Boundaries
Several physical and engineering boundaries constrain subsea DSP system design. The maximum transmission distance for QPSK modulation extends to approximately 12,000 kilometers before OSNR degradation prevents reliable operation. Higher-order modulation formats face progressively shorter reach limits. The maximum per-wavelength capacity in deployed systems approaches 400 to 600 gigabits per second using advanced QAM formats on regional systems. Total cable capacity faces limits from available optical bandwidth (approximately 40 nanometers for C-band erbium-doped fiber amplifiers), repeater power consumption constraints, and nonlinear effects that intensify as channel counts and power levels increase.
Future Directions
Artificial Intelligence Enhanced DSP
Machine learning algorithms show promise for optimizing nonlinear compensation, adaptive equalization, and system-wide performance in real-time. Neural networks can learn optimal compensation strategies from training data, potentially achieving better performance-to-complexity ratios than traditional algorithmic approaches. As of 2025, research demonstrations have shown neural network-based equalizers achieving 0.5 to 1.5 decibel OSNR improvement compared to conventional constant modulus algorithms, with ongoing work targeting real-time implementation in power-constrained ASICs.
Space-Division Multiplexing Integration
Space-division multiplexing (SDM) using multi-core or multi-mode fibers promises to multiply cable capacity by factors of 3 to 12 without requiring additional optical repeaters. However, SDM introduces spatial mode coupling that requires advanced multi-dimensional MIMO DSP processing signals across multiple spatial modes simultaneously. Research systems have demonstrated SDM transmission over limited distances, with ongoing development targeting the power-efficient ASIC implementations required for practical subsea deployment. Industry projections suggest initial SDM cable deployments may occur in the late 2020s for regional systems, with transoceanic applications following as technology matures.
Probabilistic Constellation Shaping
Probabilistic shaping optimizes the distribution of transmitted symbols to approach Shannon capacity limits more closely. Rather than using all constellation points with equal probability, shaping favors inner constellation points with lower amplitude that exhibit greater robustness to noise. Advanced shaping techniques can provide 1 to 1.5 decibels OSNR gain, effectively extending transmission reach or enabling higher-order modulation for a given distance. Modern systems increasingly incorporate shaping capabilities, with further refinements expected as DSP processing power continues scaling with CMOS technology nodes approaching 3 nanometers and below.
Conclusion
Digital signal processing has fundamentally transformed subsea optical communications, enabling transmission capacities and distances that would be impossible with legacy direct-detection technologies. Modern coherent DSP systems routinely compensate for chromatic dispersion exceeding 200,000 picoseconds per nanometer, polarization mode dispersion up to 200 picoseconds, and accumulated ASE noise over transoceanic distances while achieving spectral efficiencies of 3.5 to 6 bits per second per hertz.
The technical architecture integrates coherent detection, FFT-based chromatic dispersion compensation, adaptive MIMO equalization, carrier phase recovery, and powerful soft-decision forward error correction within Application-Specific Integrated Circuits built on advanced CMOS technology nodes. Modulation format selection balances reach and capacity requirements, with QPSK providing maximum distance capability around 12,000 kilometers and higher-order QAM formats enabling higher capacity on shorter regional systems.
Future developments including artificial intelligence-enhanced algorithms, space-division multiplexing, and advanced probabilistic shaping techniques promise further improvements in capacity, reach, and spectral efficiency. As global data traffic continues exponential growth driven by cloud services, video streaming, and emerging applications, DSP technology will remain central to expanding and optimizing the submarine cable infrastructure that carries the world's intercontinental digital communications.
References
- ITU-T Recommendation G.975 – Forward error correction for submarine systems, 2000.
- ITU-T Recommendation G.709 – Interfaces for the optical transport network, 2020.
- S. J. Savory, "Digital Coherent Optical Receivers: Algorithms and Subsystems," IEEE Journal of Selected Topics in Quantum Electronics, vol. 16, no. 5, pp. 1164-1179, 2010.
- E. Ip and J. M. Kahn, "Compensation of Dispersion and Nonlinear Impairments Using Digital Backpropagation," Journal of Lightwave Technology, vol. 26, no. 20, pp. 3416-3425, 2008.
- D. S. Millar et al., "Blind Adaptive Equalization of Polarization-Switched QPSK Modulation," Optics Express, vol. 19, no. 26, pp. B825-B830, 2011.
- T. Pfau, S. Hoffmann, and R. Noé, "Hardware-Efficient Coherent Digital Receiver Concept With Feedforward Carrier Recovery for M-QAM Constellations," Journal of Lightwave Technology, vol. 27, no. 8, pp. 989-999, 2009.
- G. Charlet, "Progress in Digital Coherent Transmission," Proceedings of the Optical Fiber Communication Conference (OFC), 2012.
- Sanjay Yadav, "Optical Network Communications: An Engineer's Perspective" – Bridge the Gap Between Theory and Practice in Optical Networking.
- P. Poggiolini, "The GN Model of Non-Linear Propagation in Uncompensated Coherent Optical Systems," Journal of Lightwave Technology, vol. 30, no. 24, pp. 3857-3879, 2012.
- M. Secondini and E. Forestieri, "Scope and Limitations of the Nonlinear Shannon Limit," Journal of Lightwave Technology, vol. 35, no. 4, pp. 893-902, 2017.
For educational purposes in optical networking and DWDM systems
Note: This guide is based on industry standards, best practices, and real-world implementation experiences. Specific implementations may vary based on equipment vendors, network topology, and regulatory requirements. Always consult with qualified network engineers and follow vendor documentation for actual deployments.
Unlock Premium Content
Join over 400K+ optical network professionals worldwide. Access premium courses, advanced engineering tools, and exclusive industry insights.
Already have an account? Log in here