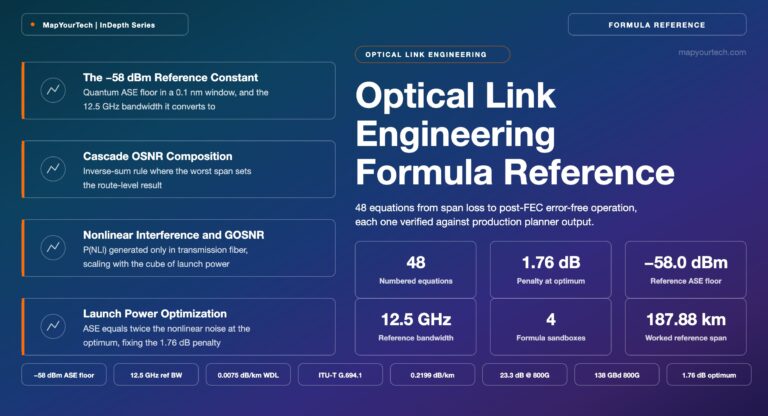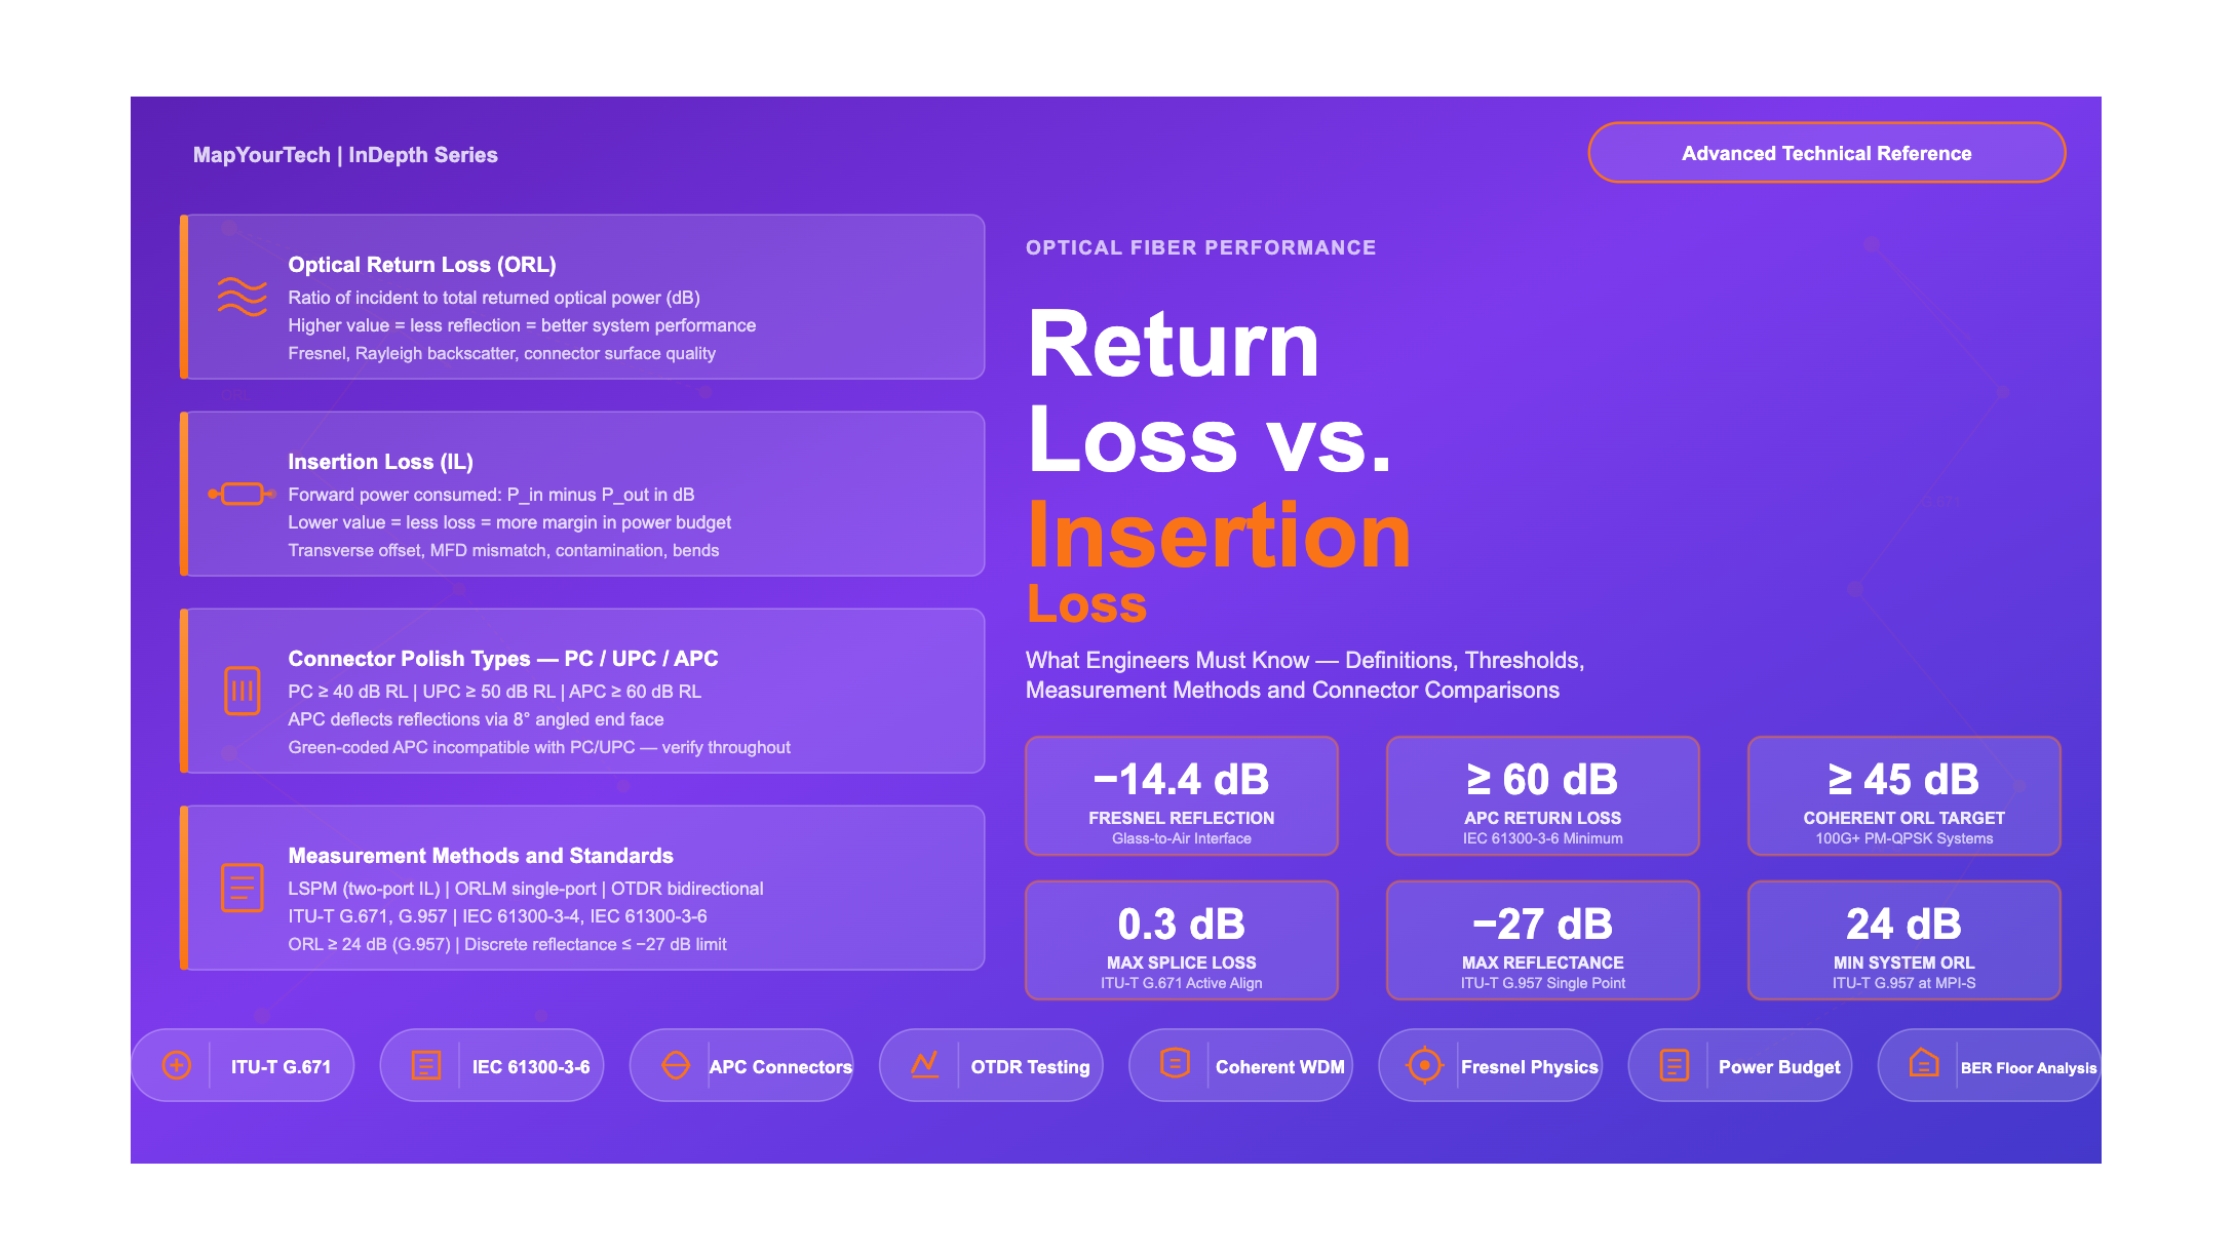

Optical Return Loss vs. Insertion Loss
Introduction
Every fiber optic link degrades optical signals in two distinct and fundamentally different ways. The first is straightforward: power is consumed as light travels through the link, and you receive less power at the far end than you launched. The second is more insidious: light reflects backward toward the source, and those reflections — when they return to a laser transmitter — cause noise, instability, and error-rate penalties that power alone cannot explain. These two phenomena are quantified by Insertion Loss (IL) and Optical Return Loss (ORL) respectively, and misunderstanding the difference between them is one of the most common sources of commissioning failures and unexplained system performance issues in operational networks.
Both parameters are expressed in decibels (dB), both involve optical power ratios, and both are measured at connectors, splices, and passive components. Yet they describe opposite directions of signal travel and require completely different measurement instruments, troubleshooting approaches, and acceptance thresholds. An engineer who confuses high insertion loss with poor return loss — or who assumes that a connector cleaned to an acceptable insertion loss also meets return loss requirements — will deploy systems that fail in service.
This article provides a rigorous engineering treatment of both parameters: their physical origins, mathematical definitions, ITU-T and IEC standard thresholds, measurement methods, connector-type comparisons, and their cascaded impact on system performance. The article draws on ITU-T Recommendations G.671, G.957, and L.36, as well as IEC 61300-3-6, with worked numerical examples throughout. By the end, you will be equipped to specify, measure, and troubleshoot ORL and IL for any single-mode terrestrial or submarine optical network.
Fundamental Definitions and Physical Origins
2.1 Insertion Loss — What It Measures
Insertion loss measures how much optical power a component or cable section absorbs, scatters, or otherwise removes from the forward-propagating signal. It is defined as the ratio of optical power incident at the input of a device to the optical power transmitted at its output, expressed in dB. A higher insertion loss value means more power is lost.
IL = 10 × log10 ( Pin / Pout )    [dB]

  Equivalently using dBm values:

IL = Pin (dBm) − Pout (dBm) [dB]Insertion loss arises from several physical mechanisms operating simultaneously. In a connector pair, the dominant cause is transverse offset — the fiber cores are not perfectly aligned, so part of the light from the transmitting fiber misses the receiving fiber core entirely. Angular offset (where the fiber axes are not parallel), a gap between fiber end faces, and differences in mode field diameter (MFD) between the two fibers each contribute additional loss. In a splice, the same mechanisms apply, with MFD mismatch being more significant because splicing joins two sections of potentially different fiber.
In fiber itself, insertion loss comes from two sources. Intrinsic attenuation — Rayleigh scattering and infrared absorption — is a material property of the silica glass and peaks at 1383 nm (the OH absorption peak in conventional fiber) while reaching minimum values near 0.18–0.20 dB/km at 1550 nm in ultra-low-loss fiber. Extrinsic attenuation from bends, micro-bends, and stress-induced effects depends on installation quality. ITU-T G.652.D specifies a maximum cable attenuation coefficient of 0.4 dB/km at 1310 nm and 0.3 dB/km at 1550 nm for standard single-mode fiber, though modern cabled fiber routinely achieves values below these limits.
2.2 Optical Return Loss — What It Measures
Optical return loss measures the total amount of optical power reflected back toward the source from all reflection points in a link — connectors, splices, component surfaces, and Rayleigh backscatter from the fiber itself. Per ITU-T G.671, ORL is defined as the ratio of incident optical power to total returned optical power, expressed in dB. A higher ORL value is better — it means less light returns to the source.
ORL = 10 × log10 ( Pincident / Preturned ) [dB]ORL must be carefully distinguished from reflectance, which ITU-T defines separately. Reflectance describes the reflection from any single discrete point — one connector, one surface, one mechanical splice — and is expressed as a negative dB value (e.g., −27 dB reflectance means −27 dB relative to the incident power at that point). ORL is the system-level aggregate: it includes all discrete reflections plus distributed Rayleigh backscatter from the entire fiber length. When a standard asks for ORL of at least 24 dB, it is specifying a total link property. When it specifies a maximum reflectance of −27 dB, it is specifying a single-point property.
Critical Distinction: ORL vs. Reflectance
ORL is a link-level cumulative property — it captures all reflected power integrated across the entire optical path, including distributed Rayleigh backscatter. Reflectance is a component-level or single-event property. An individual APC connector may have a reflectance of −65 dB, yet the system ORL may be 30 dB if there are many reflections and significant Rayleigh scatter contributing. Always use the correct term and measurement approach for the parameter you are specifying.
2.3 Side-by-Side Comparison
Optical Return Loss (ORL)
Direction: Backward — reflected power returning to source
Units: dB (positive value; higher = better)
Measured at: Source end of link; single port measurement
Typical range: 14 dB (min) to 60+ dB (APC links)
Affected by: Connector polish, gap, contamination, number of connectors, fiber Rayleigh scatter
Instrument: Optical return loss meter (ORLM), OTDR
Insertion Loss (IL)
Direction: Forward — power lost in the intended direction of propagation
Units: dB (positive value; lower = better)
Measured between: Input and output ports; two-port measurement
Typical range: 0.1–0.5 dB per connector; 0.1–1.0 dB per splice
Affected by: Transverse offset, angular offset, MFD mismatch, gap, contamination
Instrument: Light source + optical power meter (LSPM), OTDR
Physical Origins — Why Light Reflects and Why Power Is Lost
3.1 Fresnel Reflection — The Fundamental Driver of ORL
The dominant source of discrete reflections at connectors and other interfaces is Fresnel reflection, which occurs whenever light crosses a boundary between two media with different refractive indices. At a glass-air interface — such as an open fiber end face or a gap between two connectors — approximately 4% of the incident power (equivalent to −14 dB reflectance) reflects back toward the source. This is described by the Fresnel reflection coefficient:
R = [ ( n1 − n2 ) / ( n1 + n2 ) ]2

  For silica (n ≈ 1.467) to air (n = 1.000):
  R = [(1.467 − 1.000) / (1.467 + 1.000)]² ≈ 0.036  (about 3.6%)
Reflectance = 10 × log₁₀(0.036) ≈ −14.4 dBThis −14.4 dB reflectance from a glass-air gap explains the minimum ORL threshold of 14 dB that appears in some ITU-T specifications — it represents the worst case of a single open connector termination. Real systems contain multiple connectors, increasing the aggregate reflected power. Connector end-face polish type is the primary engineering tool for reducing Fresnel reflections, as discussed in Section 5.
3.2 Rayleigh Backscatter — The Distributed Reflection Contribution
Even a perfectly polished, gap-free fiber section reflects some light back through Rayleigh scattering — the same mechanism responsible for fiber attenuation. Rayleigh scattering arises from microscopic density fluctuations frozen into the silica glass during manufacture, and a small fraction of scattered power couples back into the guided mode and propagates toward the source. The backscatter power is distributed along the entire fiber length. In the OTDR, this distributed backscatter produces the characteristic sloping baseline from which discrete events stand out as spikes (reflections) or steps (losses).
For a long fiber span, the aggregate contribution of Rayleigh backscatter to the system ORL is significant and effectively sets a lower bound on what is physically achievable. At 1550 nm in standard G.652 fiber, the Rayleigh backscatter coefficient is approximately −75 to −78 dB relative to the launched power per meter of fiber, and the accumulated backscatter over a 100 km span contributes roughly 32–38 dB to the ORL calculation depending on fiber type and wavelength. This is why long, well-terminated fiber links (with APC connectors) can achieve ORL values in the 35–45 dB range even without any discrete reflections — Rayleigh scatter itself limits further improvement.
Acceptable Thresholds — ITU-T and IEC Standards
4.1 Insertion Loss Thresholds
Insertion loss thresholds for passive optical components are consolidated in ITU-T Recommendation G.671 ("Transmission characteristics of optical components and subsystems"). For connectors and splices in single-mode networks, the key values from G.671 and related standards are:
ITU-T and IEC Insertion Loss Limits
4.2 Optical Return Loss Thresholds
ORL thresholds appear in ITU-T G.957, G.691, G.671, and related recommendations. The most commonly referenced thresholds are those from G.957 and the TR-OFCS Chapter 7 design guidance, which specify ORL at the transmitter reference point (MPI-S):
| Parameter | Threshold | Standard Reference | Context / Application |
|---|---|---|---|
| Min. ORL at MPI-S (cable plant) | ≥ 24 dB | ITU-T G.957 / TR-OFCS Ch.7 | Standard terrestrial optical systems, general minimum |
| Min. ORL at MPI-S (some interfaces) | ≥ 14 dB | ITU-T G.957 | Relaxed threshold permitted for specific interface configurations |
| Max. discrete reflectance (single connector/joint) | ≤ −27 dB | ITU-T G.957 / TR-OFCS Ch.7 | Maximum reflectance allowed from any single discrete reflection point between MPI-S and MPI-R |
| Connector return loss — PC polish | ≥ 40 dB (typical) | IEC 61300-3-6 / G.671 | Standard physical-contact (PC) polish; acceptable for non-coherent links |
| Connector return loss — UPC polish | ≥ 50 dB | IEC 61300-3-6 / G.671 | Ultra-physical contact; standard for single-mode patch panels and telecom equipment ports |
| Connector return loss — APC polish | ≥ 60 dB | IEC 61300-3-6 / G.671 | Angled physical contact (8° ferrule); required for coherent systems, DWDM, CATV, ROADMs |
| ORL — coherent system recommendation | ≥ 45 dB | Field best practice / G.671 | Recommended for 100G+ coherent links and any system with DFB lasers sensitive to backreflection noise |
Why the Direction of the dB Scale Trips Engineers
For insertion loss, "better" means a smaller number (0.1 dB is better than 0.5 dB). For ORL and reflectance, the convention differs: ORL of 50 dB is better than ORL of 30 dB because it means less light returns. But reflectance is expressed as a negative value — a connector with reflectance of −60 dB is far better than one at −40 dB. When mixing these in a system budget, always double-check which direction improvement lies. Replacing −27 dB with −40 dB reflectance improves the situation; replacing 24 dB ORL with 40 dB ORL also improves the situation. Both numbers get "more extreme" in opposite directions.
Figure 2: Typical Insertion Loss vs. Return Loss by Connector Polish Type
Connector-Type Comparisons — PC, UPC, and APC
The single most impactful design choice for controlling return loss in fiber optic systems is the connector end-face polish type. Three polish standards dominate single-mode telecom: Physical Contact (PC), Ultra Physical Contact (UPC), and Angled Physical Contact (APC). Each offers a fundamentally different trade-off between return loss performance and compatibility with the installed base.
5.1 Physical Contact (PC)
The PC connector uses a slightly convex spherical polish with a radius of curvature of approximately 25 mm. The convex surface ensures that the two fiber cores touch at the apex when mated, eliminating any air gap and substantially reducing Fresnel reflections compared with an unpolished flat end face. Typical return loss for a PC-polished connector is in the range of 35–45 dB, with many standards requiring a minimum of 40 dB. PC connectors are compatible with SC, LC, ST, FC, and other ferrule types and are widely used in legacy installations, multimode patch panels, and test equipment ports where return loss requirements are not stringent.
5.2 Ultra Physical Contact (UPC)
UPC connectors extend the PC concept by using a finer polishing process that produces a smoother surface and a smaller radius of curvature (typically 10–25 mm, tightly controlled). The improved surface quality reduces microscopic air gaps and surface irregularities, pushing return loss to 50 dB or better. UPC has become the standard for single-mode telecom connectors used in central offices, equipment patch panels, and outside plant distribution frames. The blue color coding used on most LC-UPC and SC-UPC connectors is an industry convention, though not a formal standard. Per ITU-T G.671 and IEC 61300-3-6, the UPC grade minimum return loss is ≥ 50 dB.
5.3 Angled Physical Contact (APC)
The APC connector achieves dramatically superior return loss through a fundamentally different principle: the fiber end face is polished at an 8° angle from the perpendicular (per IEC 61755-3-2). Instead of trying to maximize physical contact quality to reduce Fresnel reflection amplitude, APC redirects the reflected beam away from the fiber core entirely. The 8° angle sends reflections at roughly 16° from the fiber axis, far outside the acceptance angle of the guided mode. The result is return loss consistently exceeding 60 dB, and values up to 70 dB are achievable with high-quality APC connectors on clean, well-polished end faces.
The trade-off with APC is mechanical incompatibility with PC and UPC connectors. Mating an APC with a non-APC connector causes high insertion loss (typically 1–2 dB or more) due to the angular mismatch, and can physically scratch the angled surface of the APC connector. For this reason, APC connectors are standardized with green-colored housing to prevent accidental mismatching. Any installation plan that includes APC connectors must ensure the entire path — including equipment ports, patch panels, and pigtails — uses APC connectors end-to-end. The project knowledge from submarine cable observatory systems confirms this: APC is generally preferred over PC for improved return loss, while PC is offered only where compatibility with earlier connectors is required.
Measurement Methods
6.1 Measuring Insertion Loss
The primary method for measuring insertion loss uses a calibrated light source and an optical power meter (LSPM method), also known as the cutback or two-point method in IEC 61300-3-4 for connector components, and the insertion method for installed links. The procedure is:
First, the reference power level is established by connecting the light source directly to the power meter through a reference jumper, recording the reading as Pref (dBm). Then the device under test (connector pair, splice, or link) is inserted into the optical path and the output power Pout is recorded. Insertion loss equals Pref − Pout in dB. This method is simple and yields accurate results, but it requires access to both ends of the fiber simultaneously, which is not always practical in the field.
The OTDR provides an alternative single-ended method. An OTDR injects a short, high-power pulse into the fiber and captures the Rayleigh backscatter signature and reflection events as a function of time delay. Since the speed of light in fiber is known (approximately 2 × 10⁸ m/s), time delay maps directly to distance. Connector IL appears as a step decrease in the backscatter trace, while reflective connectors also show a spike above the trace baseline. The OTDR reads splice and connector losses directly, but for single-mode fiber, only bidirectional OTDR measurements should be used for accurate splice loss values — one-way OTDR can show anomalously positive or negative values due to Mode Field Diameter (MFD) differences between adjacent fiber sections.
6.2 Measuring Optical Return Loss
ORL is measured from a single port using an optical return loss meter (ORLM). The instrument contains a stable Continuous Wave (CW) light source, a directional coupler (or optical circulator), and a sensitive power meter. The directional coupler separates the incident and returned optical power. The instrument launches known power into the fiber under test and captures all reflected power returning to the same port, calculating ORL automatically. This is fundamentally a one-ended measurement — no access to the far end is needed — which makes ORL testing highly practical for installed plant verification.
The far end of the link during an ORL measurement can be left open (producing a large reflection from the end face that will dominate the reading) or terminated with an optical termination plug (angled or index-matching gel). For a meaningful system ORL assessment that reflects the actual operating condition, the far end should be terminated with a matching connector or absorptive terminator. Leaving an unterminated open fiber end during an ORL measurement will always produce a low ORL reading that does not represent the installed network's actual operating ORL.
The OTDR provides an alternative view: by analyzing the amplitude of reflection spikes in the trace, an experienced engineer can extract per-event reflectance values and estimate the aggregate system ORL, though this requires careful analysis and is less direct than using a dedicated ORLM. The IEC 61300-3-6 standard defines the test method for component return loss measurement, while ITU-T G.957 and G.671 define the system-level ORL requirements.
Practical Note: Connector Cleanliness Dominates Both Measurements
Contamination is the most common cause of both high insertion loss and degraded return loss in the field. A single dust particle on an APC connector end face can raise insertion loss by 0.5–2 dB and reduce return loss by 10–20 dB. The IPC/FOCIS standard and ITU-T L.36 Appendix II both provide visual inspection criteria. Before any fiber measurement, clean end faces with a one-click cleaner or lint-free wipe and isopropyl alcohol, then inspect with a calibrated fiber scope at 200× or greater magnification. Never test with unclean connectors — the results will not be repeatable or meaningful.
Impact on System Performance
7.1 Insertion Loss and the Power Budget
Every optical link operates within a power budget: the available margin between the transmitter's launch power and the receiver's sensitivity threshold. Insertion loss directly consumes this margin. A 100 km link at 0.2 dB/km fiber attenuation plus three connectors at 0.3 dB each plus two splices at 0.1 dB each accumulates 21.5 dB of total IL. If the transmitter launches 0 dBm and the receiver requires −20 dBm, the link is 1.5 dB into margin — barely acceptable. Add a fourth connector (0.3 dB) and the link fails.
PRx = PTx − [α × L] − [Nconn × ILconn] − [Nsplice × ILsplice] − ILother

Link Margin = PRx − SensRx [dB] (must be positive)7.2 ORL and Laser Noise — The Interference Mechanism
While insertion loss is relatively forgiving in analog terms (you simply receive less power), poor ORL causes a qualitatively different impairment: it introduces optical noise that degrades the signal-to-noise ratio in ways that cannot be recovered by simply increasing transmit power. This is particularly severe for Distributed Feedback (DFB) lasers, which are the standard transmitter technology for long-haul and DWDM systems.
When reflected light re-enters a DFB laser cavity, it disturbs the carefully controlled resonance condition. This causes fluctuations in laser output power and frequency — known as mode hopping, injection-induced linewidth broadening, and relative intensity noise (RIN) increase. The resulting noise appears as interferometric noise on the received signal, increasing the effective Bit Error Rate (BER) floor. Unlike thermal noise or shot noise, this interferometric noise is deterministic in origin and creates a BER floor that cannot be overcome by simply receiving more optical power. A system with poor ORL will exhibit a BER plateau — error rates that stop improving with increasing OSNR, which is a diagnostic signature of reflection-induced noise.
ORL Penalty in Coherent 100G and 400G Systems
Modern coherent transceivers using PM-QPSK, 16QAM, or higher-order modulation are significantly more sensitive to reflection-induced noise than direct-detect systems. The narrow laser linewidth (typically < 100 kHz) and phase-sensitive modulation formats mean that even small amplitude or phase perturbations from reflected light create disproportionate noise penalties. For any 100G+ coherent deployment, optical return loss of the entire link should be verified to meet ≥ 45 dB before service activation. Using APC connectors throughout is the most reliable way to achieve this reliably.
7.3 Multiple Reflections — The Cascade Effect
In a link with multiple connectors, reflections from different points can undergo multiple round-trips between connectors before finally being lost or escaping the fiber. These multiple-reflection paths create a phenomenon called interferometric intensity noise (IIN), which is particularly harmful because the delayed reflection paths arrive at the receiver at different times and with different phase relationships. ITU-T G.957 limits the maximum discrete reflectance to −27 dB between source and receive reference points specifically to prevent this effect from accumulating to a system-impacting level.
Figure 5: Effect of ORL on BER Floor — Coherent vs. Direct-Detect Systems
Practical Applications and Worked Examples
8.1 Link Budget Calculation — 80 km Single-Span
Case Study 1: 10G DWDM Link, 80 km, Single Span
ScenarioA regional operator is deploying a 10G SDH signal over an 80 km single-span link without optical line amplifiers. The design must meet a BER objective of 10−12 per ITU-T G.957 application code P1L1-2D2.
Given ParametersTransmitter launch power (min): 0 dBm | Receiver sensitivity (min): −24 dBm | Fiber attenuation: 0.22 dB/km @ 1550 nm | Span length: 80 km | Connectors in path: 4 × UPC (IL = 0.3 dB each) | Fusion splices: 10 (every 8 km, IL = 0.1 dB each) | Optical path penalty (CD + PMD): 2 dB
CalculationFiber loss: 0.22 × 80 = 17.6 dB | Connector loss: 4 × 0.3 = 1.2 dB | Splice loss: 10 × 0.1 = 1.0 dB | Subtotal IL: 19.8 dB | Optical path penalty: 2.0 dB | Total budget consumed: 21.8 dB
Available budget: 0 − (−24) = 24 dB | Margin: 24 − 21.8 = 2.2 dB — acceptable (ITU-T recommends ≥ 0 dB margin).
ORL VerificationAll connectors are SC-UPC, return loss ≥ 50 dB each. Worst-case discrete reflectance is −50 dB per connector — well within the −27 dB ITU-T limit. System ORL measured at MPI-S: 35 dB — meets the ≥ 24 dB minimum threshold. No laser noise issue expected for this direct-detect application.
LessonFor direct-detect 10G systems, UPC connectors provide adequate ORL margin. The binding constraint is insertion loss and power budget. A 2.2 dB margin is acceptable but not generous; if any connectors degrade to 0.5 dB IL at end of life (as permitted by G.671), the margin shrinks to approximately 0.4 dB — design should be reviewed for end-of-life worst case.
Case Study 2: 100G Coherent DWDM — ORL-Driven Failure
ScenarioA carrier deploys 100G coherent PM-QPSK on a 240 km terrestrial link with three EDFA spans. Post-installation, BER does not improve beyond 10−4 regardless of OSNR adjustments — a classic BER floor signature. The power budget shows adequate received power, so the problem is not insertion loss.
InvestigationORL measurement at the transmitter reference point shows 18 dB — far below the recommended ≥ 45 dB for coherent systems. OTDR trace analysis reveals two connectors in the first span exhibiting reflectances of −27 dB, right at the ITU-T limit. On closer inspection, these are SC-PC connectors (not SC-UPC) with contaminated end faces that were not properly cleaned during installation. The reflected power returns to the DFB laser, increasing RIN and creating a phase noise floor that PM-QPSK demodulation cannot overcome.
ResolutionReplacing the PC connectors with APC connectors and verifying cleanliness raises the link ORL to 47 dB. The BER floor disappears, and system Q-factor improves by approximately 3.5 dB — consistent with elimination of interferometric noise.
LessonFor coherent systems, always specify and verify APC connectors with ≥ 60 dB return loss throughout the link. ORL testing must be part of the acceptance procedure alongside OSNR and BER measurements. Never assume adequate ORL from power budget calculations alone — it must be directly measured.
Troubleshooting — Identifying and Resolving ORL and IL Problems
9.1 Common IL Problems and Solutions
The most common causes of excess insertion loss in the field are: contaminated connector end faces (most frequent — responsible for up to 80% of connector-related IL issues), excessive bend radius violations, poor fusion splice geometry due to equipment misalignment or dirty V-grooves, and mechanical connector damage (chipped or scratched ferrule end faces). The diagnosis path is straightforward with OTDR: locate the event by distance, visually inspect the connector or splice at that location, clean or reterminate as required, and reverify.
MFD mismatch is a subtler but important contributor in networks that mix fiber types. Splicing G.652.D fiber (MFD approximately 10.4 µm at 1550 nm) to G.654.E fiber (MFD approximately 12 µm) creates an unavoidable IL from the MFD difference that cannot be cleaned away — it is a geometric incompatibility. Active alignment during splicing minimizes but does not eliminate this effect. Bidirectional OTDR is essential to accurately quantify MFD-mismatch splice losses, as one-way readings can be misleadingly positive or negative.
9.2 Common ORL Problems and Solutions
Poor ORL almost always traces back to one of three causes: PC-polished connectors in a system requiring APC, contaminated or damaged connector end faces (which increase effective reflectance by creating irregular gaps), or the accidental use of unterminated open fiber ends during system operation or testing. Open SFP cages or fiber stubs left without endcaps reflect strongly and can dominate system ORL readings.
The fix for ORL problems follows a hierarchy: first, clean all end faces; second, inspect and replace any damaged ferrules; third, replace PC connectors with APC where the system ORL requirement demands it; fourth, add optical isolators at the transmitter output if reflections cannot be fully eliminated (some equipment vendors include built-in isolation; where it is absent, an external isolator achieving 30–40 dB can be added).
Higher-Speed Systems and Evolving Requirements
As optical networks move toward 400G, 800G, and eventually 1.6 Tb/s per wavelength, both ORL and IL requirements tighten. Higher-order modulation formats (64QAM, 128QAM) combined with narrow laser linewidths (sub-100 kHz DFB or external cavity lasers) are increasingly sensitive to optical feedback. The OIF 400ZR and 400ZR+ implementation agreements, which define 400G DWDM coherent interfaces for data center interconnect, specify demanding ORL budgets on the optical path that effectively require APC connectors throughout.
Photonic integrated circuits (PICs), which integrate multiple laser and modulator functions on a single chip, are even more sensitive to optical feedback than discrete component designs because the tight on-chip waveguide structures and shared substrates can propagate reflections between functions. PIC-based transceivers from multiple vendors specify minimum ORL of 40–45 dB at the input facet, making APC the mandatory connector choice for all PIC-equipped equipment ports where accessible.
Insertion loss requirements are also evolving. As systems push toward multi-terabit spectral loading, the OSNR budget becomes extremely tight, and every fraction of a dB of additional IL has a measurable impact on reach. Ultra-low-loss (ULL) connectors achieving ≤ 0.05 dB per mating have entered commercial availability for critical high-density ODF applications, and field-polished connector assemblies capable of 0.1 dB or below are standard practice in carrier-grade network deployments as of 2025.
Figure 7: System Sensitivity to ORL Degradation by Transmission Technology (illustrative)
Conclusion and Design Guidelines
Insertion loss and optical return loss are complementary parameters that together define the passive optical performance of any fiber link. IL tells you how much signal power arrives at the receiver; ORL tells you how much noise the transmitter laser is being subjected to from backward-traveling reflections. An engineer who optimizes only one while ignoring the other will build links that fail in service in one or the other respect.
The practical engineering rules are straightforward: for direct-detect 10G and below, UPC connectors with ≥ 50 dB return loss and verified insertion loss ≤ 0.3 dB per connector deliver reliable system performance within ITU-T G.671 and G.957 limits. For coherent 100G and above, APC connectors with ≥ 60 dB return loss are required for robust operation, and the full link ORL should be verified to exceed 45 dB before service turn-up. Clean connectors are non-negotiable for both parameters — contamination is the leading cause of both high IL and degraded ORL in the field.
Summary — Key Engineering Points
- ORL measures reflected power returning to the source (higher dB = less reflection = better); IL measures forward power loss (lower dB = less loss = better).
- Fresnel reflection at a glass-air gap produces approximately −14.4 dB reflectance; the ITU-T 14 dB minimum ORL threshold reflects this worst case.
- Maximum discrete reflectance per ITU-T G.957 is −27 dB; minimum system ORL at MPI-S is generally 24 dB.
- APC connectors (≥ 60 dB RL) are required for coherent systems; UPC (≥ 50 dB RL) is acceptable for direct-detect single-mode links; PC (≥ 40 dB RL) is adequate only for non-sensitive applications.
- Bidirectional OTDR averaging is required for accurate single-mode splice IL measurement — one-way readings can be misleadingly positive or negative due to MFD differences.
- ORL-induced BER floors cannot be overcome by increasing optical power — they are optical noise effects requiring ORL improvement or optical isolation at the laser source.
- Clean and inspect connectors before any IL or ORL measurement — contamination renders all results unreliable.
References
- ITU-T Recommendation G.671 – Transmission characteristics of optical components and subsystems.
- ITU-T Recommendation G.957 – Optical interfaces for equipments and systems relating to the synchronous digital hierarchy.
- ITU-T Recommendation L.36 – Single mode fibre optic connectors.
- IEC 61300-3-4 – Fibre optic interconnecting devices and passive components — Basic test and measurement procedures — Part 3-4: Examinations and measurements — Attenuation.
- IEC 61300-3-6 – Fibre optic interconnecting devices and passive components — Basic test and measurement procedures — Part 3-6: Examinations and measurements — Return loss.
- IEC 61755-3-2 – Fibre optic connector optical interfaces — Part 3-2: Optical interface for single mode fibres with angled physical contact connectors.
- ITU-T Technical Report TR-OFCS (2015-07) – Technical Report on Optical fibres, cables and systems, Chapters 4, 6, and 7.
- Sanjay Yadav, "Optical Network Communications: An Engineer's Perspective" – Bridge the Gap Between Theory and Practice in Optical Networking.
Developed by MapYourTech Team
For educational purposes in Optical Networking Communications Technologies
Note: This guide is based on industry standards, best practices, and real-world implementation experiences. Specific implementations may vary based on equipment vendors, network topology, and regulatory requirements. Always consult with qualified network engineers and follow vendor documentation for actual deployments.
Feedback Welcome: If you have any suggestions, corrections, or improvements to propose, please feel free to write to us at [email protected]
Related Articles on MapYourTech


Continue Reading This Article
Sign in with a free account to unlock the full article and access the complete MapYourTech knowledge base.