Tag

AMPLIFIERS

Browsing

When working with amplifiers, grasping the concept of noise figure is essential. This article aims to elucidate noise figure, its significance, methods for its measurement and reduction in amplifier designs. Additionally, we’ll provide the correct formula for calculating noise figure and an illustrative example.

Table of Contents

  1. What is Noise Figure in Amplifiers?
  2. Why is Noise Figure Important in Amplifiers?
  3. How to Measure Noise Figure in Amplifiers
  4. Factors Affecting Noise Figure in Amplifiers
  5. How to Reduce Noise Figure in Amplifier Design
  6. Formula for Calculating Noise Figure
  7. Example of Calculating Noise Figure
  8. Conclusion
  9. FAQs

What is Noise Figure in Amplifiers?

Noise figure quantifies the additional noise an amplifier introduces to a signal, expressed as the ratio between the signal-to-noise ratio (SNR) at the amplifier’s input and output, both measured in decibels (dB). It’s a pivotal parameter in amplifier design and selection.

Why is Noise Figure Important in Amplifiers?

In applications where SNR is critical, such as communication systems, maintaining a low noise figure is paramount to prevent signal degradation over long distances. Optimizing the noise figure in amplifier design enhances amplifier performance for specific applications.

How to Measure Noise Figure in Amplifiers

Noise figure measurement requires specialized tools like a noise figure meter, which outputs a known noise signal to measure the SNR at both the amplifier’s input and output. This allows for accurate determination of the noise added by the amplifier.

Factors Affecting Noise Figure in Amplifiers

Various factors influence amplifier noise figure, including the amplifier type, operation frequency (higher frequencies typically increase noise figure), and operating temperature (with higher temperatures usually raising the noise figure).

How to Reduce Noise Figure in Amplifier Design

Reducing noise figure can be achieved by incorporating a low-noise amplifier (LNA) at the input stage, applying negative feedback (which may lower gain), employing a balanced or differential amplifier, and minimizing amplifier temperature.

Formula for Calculating Noise Figure

The correct formula for calculating the noise figure is:

NF(dB) = SNRin (dB) −SNRout (dB)

Where NF is the noise figure in dB, SNR_in is the input signal-to-noise ratio, and SNR_out is the output signal-to-noise ratio.

Example of Calculating Noise Figure

Consider an amplifier with an input SNR of 20 dB and an output SNR of 15 dB. The noise figure is calculated as:

NF= 20 dB−15 dB =5dB

Thus, the amplifier’s noise figure is 5 dB.

Conclusion

Noise figure is an indispensable factor in amplifier design, affecting signal quality and performance. By understanding and managing noise figure, amplifiers can be optimized for specific applications, ensuring minimal signal degradation over distances. Employing strategies like using LNAs and negative feedback can effectively minimize noise figure.

FAQs

  • What’s the difference between noise figure and noise temperature?
    • Noise figure measures the noise added by an amplifier, while noise temperature represents the noise’s equivalent temperature.
  • Why is a low noise figure important in communication systems?
    • A low noise figure ensures minimal signal degradation over long distances in communication systems.
  • How is noise figure measured?
    • Noise figure is measured using a noise figure meter, which assesses the SNR at the amplifier’s input and output.
  • Can noise figure be negative?
    • No, the noise figure is always greater than or equal to 0 dB.
  • How can I reduce the noise figure in my amplifier design?
    • Reducing the noise figure can involve using a low-noise amplifier, implementing negative feedback, employing a balanced or differential amplifier, and minimizing the amplifier’s operating temperature.

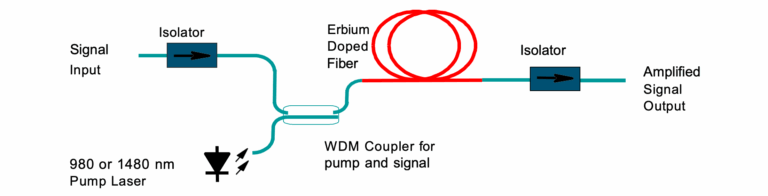
The maximum number of erbium-doped fiber amplifiers (EDFAs) in a fiber chain is about four to  six.

edfa


Explanation 

The rule is based on the following rationales:

1. About 80 km exists between each in-line EDFA, because this is the approximate distance at which the signal needs to be amplified.

2. One booster is used after the transmitter.

3. One preamplifier is used before the receiver.

4. Approximately 400 km is used before an amplified spontaneous emission (ASE) has approached the signal (resulting in a loss of optical signal-to-noise ratio [OSNR]) and regeneration needs to be used.

An EDFA amplifies all the wavelengths and modulated as well as unmodulated light. Thus, every time it is used, the noise floor from stimulated emissions rises. Since the amplification actually adds power to each band (rather than multiplying it), the signal-to-noise ratio is decreased at each amplification. EDFAs also work only on the C and L bands and are typically pumped with a 980- or 1480-nm laser to excite the erbium electrons. About 100 m of fiber is needed for a 30-dB gain, but the gain curve doesn’t have a flat distribution, so a filter is usually included to ensure equal gains across the C and L bands.

For example, assume that the modulated power was 0.5 mW, and the noise from stimulated emission was 0.01 mW. The signal-to-noise ratio is 0.5/0.01 or 50. If an EDFA adds a 0.5 mW to both the modulated signal and the noise, then the modulated signal becomes 1 mW, and the noise becomes 0.501 mW, and the SNR is reduced to 2. After many amplifications,even if the total power is high, the optical signal-to-noise ratio becomes too low. This typically occurs after four to six amplifications.

Another reason to limit the number of chained EDFAs is the nonuniform nature of the gain. Generally, the gain peaks at 1555 nm and falls off on each side, and it is a function of the inversion of Er+3. When a large number of EDFAs are cascaded, the sloped of the gain becomes multiplied and sharp, as indicated in Fig. 6.3. This results is too little gain-bandwidth for a system. To help alleviate this effect, a gain flattening device often is used, such as a Mach–Zehnder or a long-period grating filter.


Reference

1. A. Willner and Y. Xie, “Wavelength Domain Multiplexed (WDM) Fiber-optic Communications Networks,” in Handbook of Optics, Vol. 4., M. Bass, Ed.,McGraw-Hill, New York, pp. 13–19, 2001.

2.http://www.pandacomdirekt.com/en/technologies/wdm/optical-amplifiers.html

3.http://blog.cubeoptics.com/index.php/2015/03/what-edfa-a-noise-source

Source: Optical Communications Rules of Thumb

Note:I have heard many times among optical folks discussing  maximum number of amplifiers in a link;so thought of posting this.