OTDR in Hollow Core Fiber: Challenges, Innovations, and Field Deployment Strategies
How the dramatically lower backscatter in hollow core fiber forces a rethink of optical time-domain reflectometry -- and the engineering solutions bridging the gap between laboratory research and production networks.
1 Introduction
Optical Time-Domain Reflectometry (OTDR) has been the backbone of fiber optic network characterization for over four decades. By launching short optical pulses into a fiber and analyzing the time-resolved backscattered light, OTDR instruments provide engineers with distributed measurements of attenuation, splice loss, connector reflections, and fault locations along the entire fiber link -- all from a single end. For standard Single-Mode Fiber (SMF) based on silica glass, this approach works reliably because Rayleigh scattering from density fluctuations frozen into the glass core generates a predictable and relatively strong backscatter signal.
Hollow Core Fiber (HCF) disrupts this fundamental assumption. In HCF, light propagates through air (or gas) rather than glass, and the air-glass microstructure that confines the mode operates on anti-resonance or photonic bandgap principles rather than total internal reflection. As of 2025, HCF has achieved record-breaking attenuation as low as 0.091 dB/km at 1550 nm -- surpassing the Rayleigh scattering floor of conventional silica fiber -- while offering approximately 33% lower latency, dramatically reduced nonlinearity, and wider spectral bandwidth. These advantages have driven commercial deployments at Microsoft Azure, high-frequency trading firms, and data center interconnect providers.
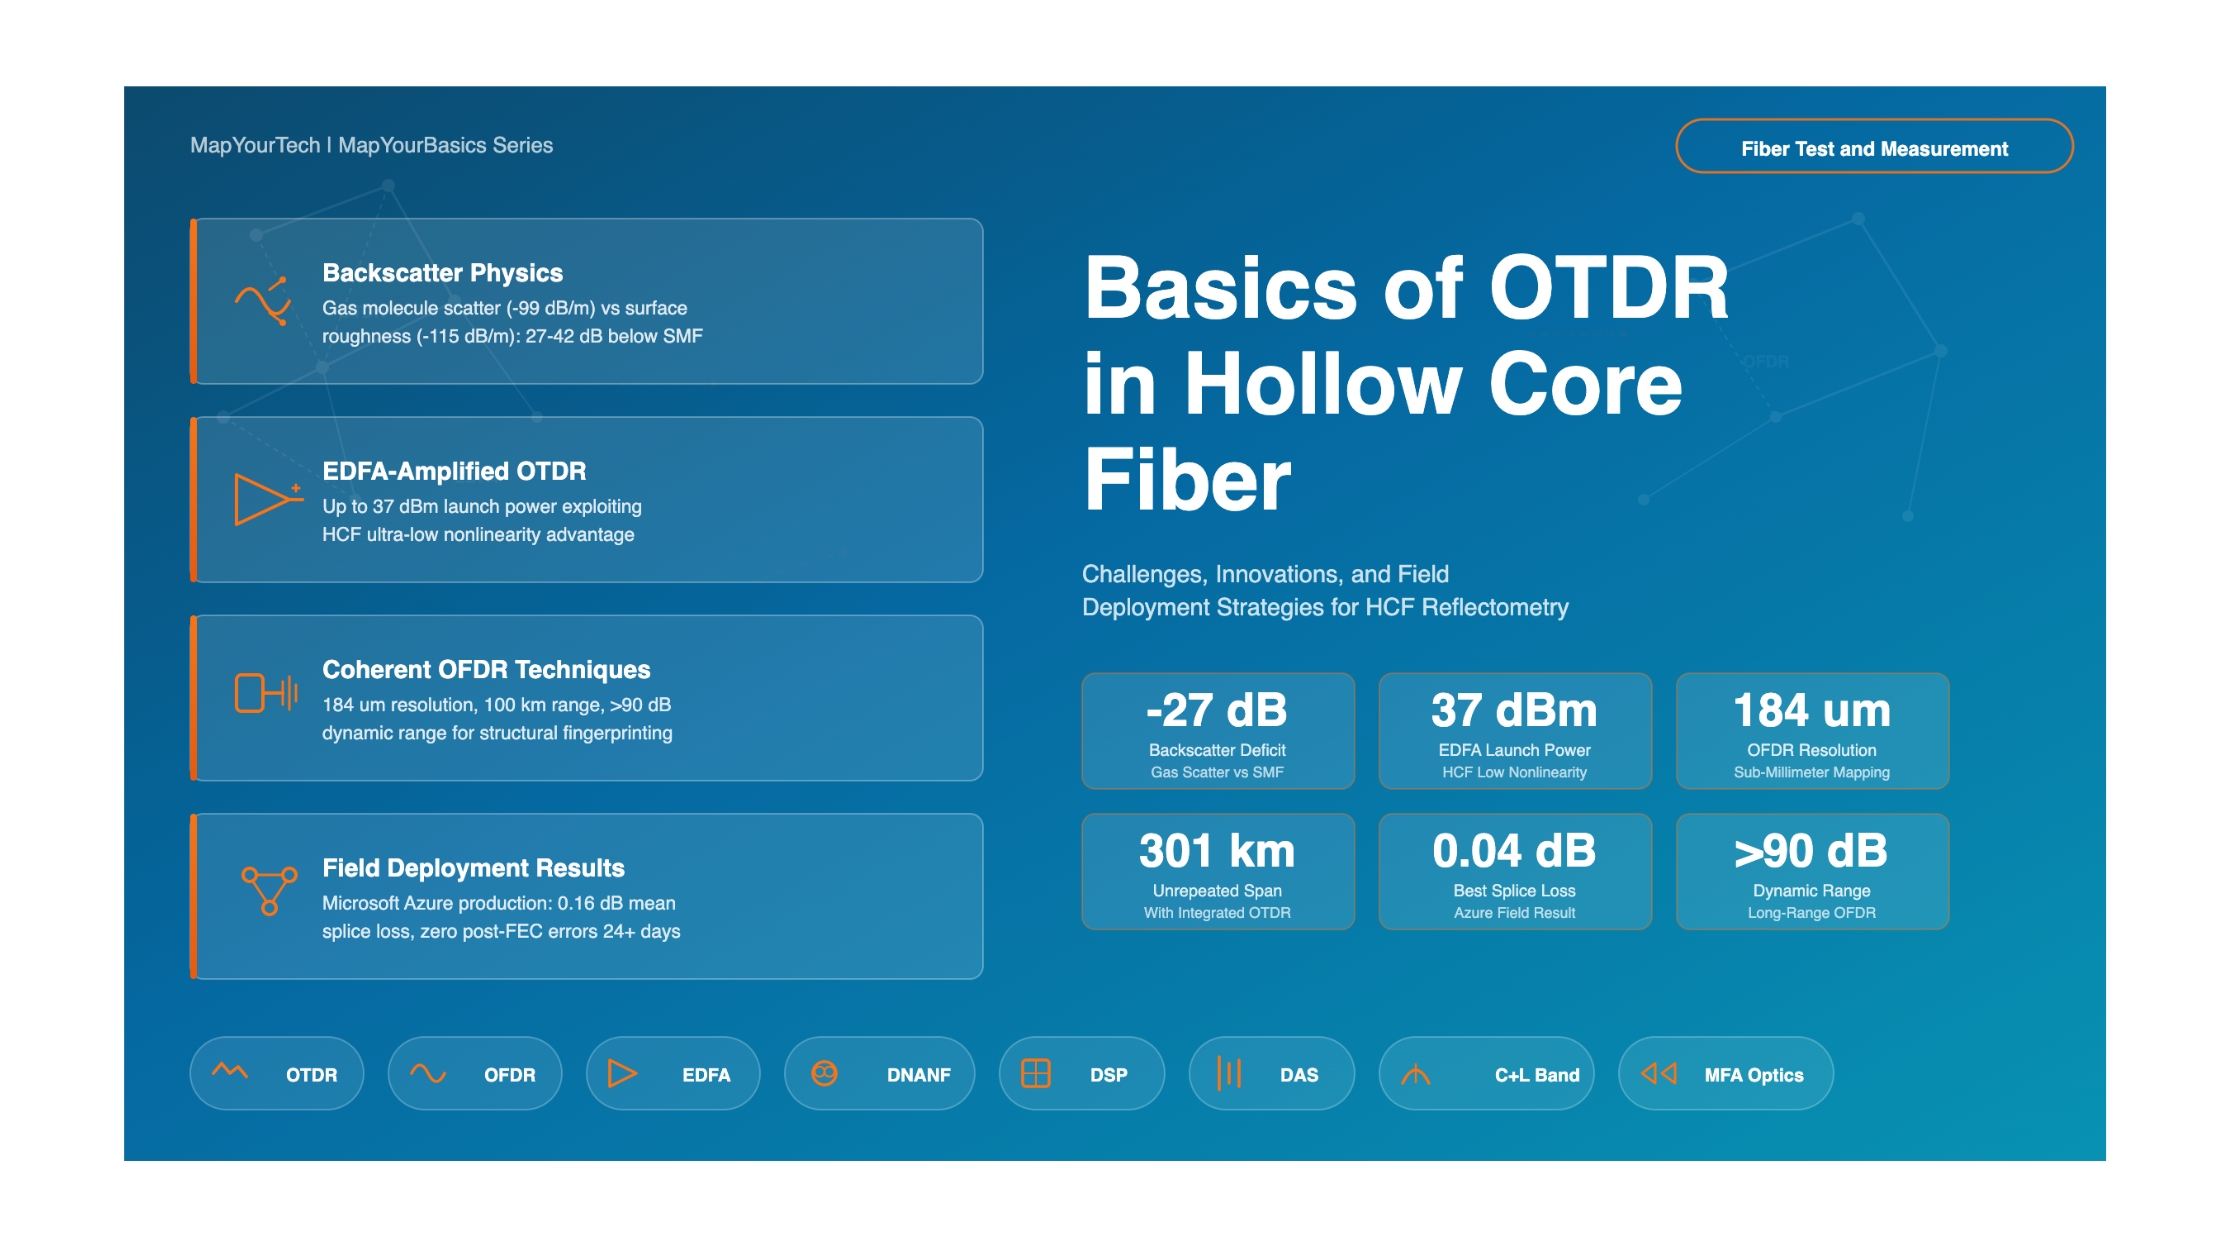
The catch: HCF produces backscatter that is 27 to 42 dB lower than SMF Rayleigh levels, depending on the scattering mechanism. This means conventional OTDR instruments designed for solid-core fiber are effectively blind when connected to HCF. The dynamic range, sensitivity thresholds, and trace interpretation algorithms in standard OTDR units assume backscatter coefficients typical of glass-core fibers. When applied to HCF, the signal falls below the noise floor, rendering the instrument useless for distributed characterization.
This article provides a comprehensive technical analysis of OTDR measurement in Hollow Core Fiber. It examines the physics of backscatter in air-core fibers, the specific engineering challenges this creates for time-domain and frequency-domain reflectometry, the solutions developed by research groups and vendors, real-world field deployment results, and the emerging commercial test equipment ecosystem now maturing around HCF networks. The scope covers both Optical Time-Domain Reflectometry (OTDR) and its complementary technique, Optical Frequency-Domain Reflectometry (OFDR), as both are essential for complete HCF characterization.
2 Backscatter Physics: Why HCF Breaks Conventional OTDR
2.1 Rayleigh Scattering in SMF vs. HCF
In conventional SMF, Rayleigh scattering originates from frozen-in density and compositional fluctuations in the fused silica glass. These scatterers are stationary, and the resulting backscattered field has a well-defined phase relationship with the launched pulse. This forms the basis for both intensity-based OTDR and coherent OFDR techniques. The Rayleigh backscatter coefficient in standard SMF is approximately -72 dB/m at 1550 nm, providing enough return signal for instruments with 40-50 dB dynamic range to characterize links over 100 km or more.
In HCF, the light-guiding core is hollow, filled with air or a specific gas. The backscatter in this environment originates from two fundamentally distinct mechanisms, each with very different characteristics:
Dynamic Scattering from Gas Molecules
Air molecules (primarily nitrogen and oxygen) in the hollow core produce Rayleigh scattering from their random thermal motion. This gas-phase backscatter is approximately 27 dB below the Rayleigh scattering level of solid-core SMF. Critically, the constant random motion of these air molecules produces Doppler shifts upon reflection, broadening the backscattered spectrum by approximately 500 MHz. This broadening causes the signal to decohere within picoseconds, meaning that gas backscatter cannot maintain phase coherence over measurement timescales relevant to OFDR. However, it can still be detected by intensity-based OTDR systems, provided they have enough dynamic range.
Static Scattering from Surface Roughness
The air-glass interfaces forming the anti-resonant microstructure (the tube walls in a NANF or DNANF design) have surface roughness at the nanometer scale. This roughness scatters light back along the guided mode. Surface roughness backscatter is an additional 15 dB lower than the gas-molecule backscatter -- placing it more than 40 dB below standard SMF levels. Unlike the gas scatter, this surface roughness scatter is static, permanent, and repeatable. It functions much like the Rayleigh fingerprint in SMF and maintains coherence over time, making it accessible to coherent reflectometry (OFDR) techniques.
OTDR instruments primarily detect gas-molecule scatter (approximately -99 dB/m, 27 dB below SMF). OFDR instruments can filter the incoherent gas scatter and access the even weaker surface-roughness scatter (approximately -115 dB/m, >40 dB below SMF). Each instrument type reveals different physical information about the fiber.
2.2 Quantitative Backscatter Comparison
| Parameter | Standard SMF (G.652) | HCF (DNANF) -- Gas Scatter | HCF (DNANF) -- Surface Scatter |
|---|---|---|---|
| Backscatter Level | ~-72 dB/m | ~-99 dB/m | ~-115 dB/m |
| Deficit vs. SMF | Reference (0 dB) | -27 dB | -42 dB |
| Scatterer Type | Static (frozen glass density fluctuations) | Dynamic (moving gas molecules) | Static (air-glass interface roughness) |
| Phase Coherence | Maintained (enables OFDR) | Lost within picoseconds (~500 MHz broadening) | Maintained (enables OFDR) |
| Measurable By | Standard OTDR, OFDR | Amplified OTDR only | High-sensitivity OFDR |
| Physical Information | Loss, splice events, fault location | Gas pressure gradients, bulk attenuation | Fiber structural uniformity, birefringence |
An important phenomenon unique to HCF is that gas pressure within the hollow core varies along the fiber length, particularly near the fiber ends where atmospheric air can ingress. Since gas-molecule backscatter is proportional to the local gas density, OTDR traces of HCF show characteristic anomalies near splice points and fiber ends where pressure gradients exist. This is a transient effect -- the backscatter level appears elevated at points of higher pressure, creating apparent "bumps" in the OTDR trace that do not correspond to actual attenuation changes.
Bi-directional OTDR measurements address this challenge. By measuring from both ends and combining the forward and backward traces, engineers can mathematically separate the true longitudinal loss profile from pressure-induced scattering coefficient variations. The forward trace F and backward trace B yield the fiber attenuation from 2.5 x log10(F/B) and the local scatter coefficient from 10 x log10(F x B), enabling clean separation of these two distinct effects.
-- Fiber Attenuation (independent of local scatter):
  Attenuation(z) = 2.5 × log10( F(z) / B(z) )

-- Local Scatter Coefficient (reveals structural variations):
Scatter(z) = 10 × log10( F(z) × B(z) )3 Engineering Challenges for OTDR in HCF
3.1 Dynamic Range Deficit
The 27-30 dB reduction in backscatter level compared to SMF translates directly into a dramatic loss of usable dynamic range for conventional OTDR instruments. A standard field OTDR with 40 dB dynamic range on SMF effectively has only 10-13 dB of usable range on HCF. Since every 1 dB of dynamic range corresponds to approximately 5 km of measurable fiber distance at typical HCF loss levels (0.1-0.15 dB/km), this limits conventional instruments to characterizing only very short HCF sections before the signal disappears into the noise floor.
A conventional OTDR with 40 dB dynamic range on SMF has effectively only ~10-13 dB usable range on DNANF-type HCF. This is enough to measure perhaps 50-70 km of HCF versus 200+ km of SMF, even before accounting for splice losses and connector reflections that further reduce the dynamic range budget.
3.2 EDFA Amplification: Exploiting HCF's Low Nonlinearity
One of the most elegant solutions to the dynamic range problem exploits a unique property of HCF: its dramatically lower optical nonlinearity (orders of magnitude below SMF). In conventional SMF, OTDR launch power is limited to approximately +20 to +24 dBm before nonlinear effects such as Stimulated Brillouin Scattering (SBS), Self-Phase Modulation (SPM), and Four-Wave Mixing (FWM) distort the OTDR pulse and corrupt the measurement. This nonlinear power ceiling effectively caps the dynamic range improvement achievable through higher launch power.
HCF removes this ceiling. Because the guided light interacts with air rather than glass, the Kerr nonlinear coefficient is reduced by orders of magnitude. Engineers can therefore boost the OTDR pulse energy far beyond what is possible in SMF by inserting an Erbium-Doped Fiber Amplifier (EDFA) between the OTDR instrument and the HCF under test. Practical implementations have used EDFA booster output powers of up to 37 dBm (+5 W peak) to compensate for the 30 dB lower backscattering of DNANF, effectively restoring much of the lost dynamic range.
The measurement architecture for EDFA-amplified OTDR in HCF typically consists of the OTDR pulse source, an EDFA booster amplifier, a mode-field adaptor (to match the larger Mode Field Diameter of HCF), and the fiber under test. The mode-field adaptor is a critical component -- HCF typically has an MFD of 17-24 micrometers compared to SMF's 10.4 micrometers, and the adaptor ensures efficient coupling while minimizing back-reflections that could saturate the OTDR detector.
3.3 Mode Field Diameter Mismatch
The mismatch between SMF MFD (~10.4 micrometers) and HCF MFD (17-24 micrometers) creates challenges specific to OTDR measurement. The OTDR instrument's laser source and detector are optimized for SMF, so connecting to HCF introduces both coupling loss and the potential excitation of Higher-Order Modes (HOMs). These HOMs have different propagation constants and loss rates than the fundamental mode, and they can create ghost signals and multipath interference artifacts in the OTDR trace that complicate interpretation.
Specialized mode-field adaptors -- such as Thermally Expanded Core (TEC) fibers, GRIN lens assemblies, or custom intermediate fibers -- bridge this gap. In field deployments, HCF-specific patch tails are used to interface between the installed HCF cable and standard SMF test equipment ports. These patch tails are factory-fabricated with optimized splices designed to minimize both insertion loss and back-reflection at the SMF-HCF transition.
3.4 Fresnel Reflections at Air-Glass Interfaces
Because HCF guides light through air, every SMF-to-HCF junction creates a glass-to-air transition producing strong Fresnel reflections. The refractive index step from glass (n = 1.468) to air (n = 1.0) produces approximately -14.7 dB return loss per flat-polished interface -- much stronger than the back-reflection from SMF-to-SMF connections (typically < -55 dB for APC connectors). These strong reflections can saturate the OTDR receiver, creating dead zones that obscure splice information near the connection points.
Suppressing Fresnel reflections to acceptable levels (typically below -50 to -60 dB) is critical for clean OTDR traces. Solutions include angle-cleaved fiber end-faces (using 4.5-degree cleaves with controlled offsets), Anti-Reflection (AR) coatings on the SMF end-faces, and GRIN lens mode-field adaptors designed to minimize the glass-air interface return. Recent developments have achieved below -64 dB back-reflection using advanced angle-splice techniques. However, AR coatings face a durability challenge: they can be damaged during the heat of the fusion splicing process, limiting the achievable long-term suppression.
3.5 Higher-Order Mode Artifacts
Despite being designed to propagate a fundamental-like mode at low loss, HCF structures -- particularly those with larger core diameters -- are inherently multi-modal. Imperfections such as splices, connectors, or macro-bends can excite HOMs, which then propagate with different loss rates and group velocities than the fundamental mode. On an OTDR trace, this manifests as ghost reflections, unusual step-like features, and apparent asymmetry in splice loss when measured from different directions. Inter-Modal Interference (IMI) can also cause trace oscillations that do not correspond to real fiber events.
This asymmetry is particularly important for OTDR-based splice loss measurements. When light crosses an SMF-HCF junction, HOMs may be excited that propagate for some distance before being stripped. The apparent splice loss measured from the HCF side can differ from the loss measured from the SMF side, and neither measurement alone gives the true insertion loss. Bi-directional OTDR measurements and careful launch conditioning are therefore essential for accurate HCF splice characterization.
4 EDFA-Assisted OTDR: The Practical Solution for HCF Networks
4.1 System Architecture
The practical architecture for EDFA-assisted OTDR measurement of HCF has been validated both in laboratory research and in production deployments. The configuration developed by Microsoft Azure Fiber for their DNANF deployments represents the current state of the art. The system consists of a commercial OTDR unit (such as the Viavi E41DWDMC) coupled through a high-power EDFA booster to compensate for the approximately 30 dB lower backscattering of DNANF. The OTDR pulse is amplified and coupled into the fiber under test through a spliced mode-field adaptor.
The key measurement parameters used in practical DNANF characterization are time resolution of 10 to 30 ns, corresponding to spatial resolution of 1.5 to 4.5 meters. These spatial resolution values reflect the faster group velocity of light in HCF compared to SMF -- since light travels approximately 33% faster in air than in glass, each nanosecond of pulse width maps to a proportionally longer fiber segment. Measurements are typically performed at both 1310 nm and 1550 nm to provide dual-wavelength characterization of the fiber loss profile.
4.2 Bi-Directional Methodology
Bi-directional OTDR is strongly recommended for HCF characterization, and for several reasons beyond the gas-pressure separation discussed in Section 2.3. First, it enables accurate splice loss measurements despite the HOM excitation asymmetry described in Section 3.5. Second, it provides redundancy against dead zones caused by strong Fresnel reflections at connection points. Third, it allows verification of fiber uniformity by comparing the attenuation slope from both directions.
In the characterization of a record-breaking 15 km DNANF with 0.091 dB/km loss, bi-directional OTDR traces at 1310 nm and 1550 nm showed uniform loss across the full fiber length, confirming the structural consistency achieved by the drawing process. The OTDR results agreed closely with independent cutback measurements, validating the amplified OTDR approach as a reliable characterization tool for HCF.
4.3 Field Deployment Results
Microsoft Azure's commercial HCF deployment represents the most extensive field validation of OTDR testing on production HCF links. A custom-designed HCF-specific OTDR was developed to measure individual splice losses and verify attenuation across all cable sections. The OTDR was used to check against rigorous Azure HCF specification requirements, locating high splice losses or faults that needed rework before the link entered service.
The field results demonstrated that EDFA-amplified OTDR reliably identified splice locations and measured individual splice loss levels across installed HCF strands. A mean splice loss of 0.16 dB was achieved across the deployment, with individual splices measured as low as 0.04 dB -- performance comparable to conventional SMF networks. The OTDR system also provided continuous monitoring capability, enabling rapid fault location (such as cable cuts) for quick recovery.
For longer-reach laboratory demonstrations, OTDR was used to estimate splice losses on a 200.5 km DNANF link composed of 57 individual fiber bobbins (with lengths ranging from 2 km to 17.9 km). The OTDR-measured splice losses of 0.1-0.15 dB per joint were consistent with transmission penalty measurements, confirming the validity of the OTDR approach for characterizing complex multi-span HCF links.
Microsoft Azure's HCF deployment achieved mean splice loss of 0.16 dB (individual splices as low as 0.04 dB) validated by custom HCF-specific OTDR. The OTDR tool proved essential for pre-service qualification and ongoing monitoring of production HCF links carrying live customer traffic.
4.4 High-Power OTDR Integration
The unrepeated HCF transmission experiments extending to 301.7 km used a custom-developed bi-directional HCF line system built around a 37 dBm output power EDFA. This rack-mounted system integrated the high-power booster amplifier with a low-noise preamplifier for the receiver path, and included internal optical switching to provide OTDR access to either fiber direction. The high peak pulse power was specifically engineered to overcome HCF's low backscattering, enabling long-range OTDR characterization of fiber links approaching 300 km.
This integration of OTDR capability directly into the line-system hardware represents an important architectural concept for HCF networks. Rather than using OTDR as a standalone test instrument, embedding it within the transmission equipment allows continuous or on-demand link monitoring without service interruption -- a capability that becomes increasingly important as HCF links are deployed in production environments.
5 OFDR: Accessing the Hidden Fingerprint of HCF
5.1 Why OFDR Complements OTDR for HCF
While EDFA-amplified OTDR effectively solves the distributed loss measurement problem for HCF, it captures only the gas-molecule backscatter -- the "dynamic" scattering component. The static surface-roughness scattering, which is 15 dB weaker than gas scatter but carries critical information about fiber structural uniformity, is completely swamped by air backscatter in OTDR measurements.
Optical Frequency-Domain Reflectometry (OFDR) can access this static fingerprint by exploiting the coherence difference between the two scattering mechanisms. Because gas molecules are in constant random motion, their Doppler-broadened backscatter (~500 MHz spectral width) decoheres within picoseconds. Surface roughness scatter, being from frozen-in structural features, maintains perfect coherence. A swept-laser OFDR system with sufficient coherence length can therefore selectively detect the surface scatter by coherent averaging that naturally rejects the incoherent gas component.
5.2 High-Resolution OFDR (Sub-millimeter)
Research from Nokia Bell Labs and Microsoft Azure Fiber demonstrated a high-resolution OFDR system capable of sub-millimeter spatial resolution on HCF. The setup used a continuously swept laser scanning 20 nm (approximately 800 GHz bandwidth) at 1550 nm, with a polarization-diverse heterodyne receiver digitizing at 400 MS/s. The system included a phase noise and sweep nonlinearity tracking asymmetric Mach-Zehnder Interferometer for calibration.
This system achieved Fourier transform-limited resolution of 184 micrometers -- an order of magnitude improvement over previous HCF OFDR demonstrations that achieved only meter-level resolution. Measurements of a 600-meter HCF section revealed the surface-roughness backscatter level at approximately -115 dB/m (about 40 dB below SMF Rayleigh levels). The traces showed 1 dB fluctuations in backscatter coefficient along the fiber length, attributed to variations in the fiber cross-section during drawing -- a signature that could be used for non-invasive fabrication quality control.
5.3 Distributed Birefringence Measurement
One of the most significant applications of high-resolution OFDR to HCF is the measurement of distributed modal birefringence. Small asymmetries in the position, size, and thickness of the anti-resonant tubes in the cladding structure induce birefringence that causes the polarization state of the guided light to rotate as it propagates. By analyzing the polarization-resolved OFDR traces and performing spectral cross-correlation between the two received polarization channels, researchers extracted the local birefringence along a 5-km DNANF sample.
The measurements revealed beat lengths varying between 5 and 16 meters along the fiber, with the average spectral shift of the cross-correlation peak at 0.05 GHz. The backward measurement mirrored the forward measurement, confirming the result's validity. This distributed birefringence mapping has direct practical significance: variations in birefringence along the fiber correlate with structural non-uniformities that affect PMD, a critical parameter for high-speed coherent transmission systems.
5.4 Long-Range OFDR (100-km Scale)
The same research team adapted their OFDR technique for long-range measurements, achieving distributed characterization over 100-km HCF spans with meter-scale resolution. The long-range OFDR system used an external IQ modulator (rather than direct laser sweeping) with a Hz-linewidth laser to minimize phase noise. Both polarizations were swept over 250 MHz in 67 ms at a 1 GHz offset frequency, providing 0.3-meter theoretical Nyquist resolution.
The launch signal was amplified to 10 dBm, and the laser was stepped over 50 wavelengths with 1 GHz step size to average out coherent speckle and produce smooth backscatter traces. This multi-wavelength averaging is essential for HCF because the speckle pattern from surface roughness varies with wavelength. The system achieved greater than 90 dB dynamic range, enabling characterization at 3-meter FWHM resolution at 10-km distance and 25-meter FWHM resolution at 100 km.
| OFDR Configuration | Range | Spatial Resolution | Dynamic Range | Primary Application |
|---|---|---|---|---|
| High-Resolution (swept laser, 800 GHz scan) | Up to 5 km | 184 micrometers | ~50 dB | Birefringence mapping, fabrication QC |
| Long-Range (external modulation, Hz-linewidth laser) | Up to 100 km | 3 m (at 10 km), 25 m (at 100 km) | >90 dB | Metro link monitoring, structural uniformity |
5.5 Thermal Sensitivity Measurement
OFDR can also measure the distributed thermal sensitivity of HCF by tracking spectral shifts in the backscatter fingerprint as temperature changes. The phase thermal sensitivity of the guided mode (d(betaL)/dT) in HCF was found to be approximately 20 times lower than in SMF -- a result consistent with the minimal glass-light overlap in anti-resonant fiber designs. This has practical implications for HCF deployed in environments with varying temperature: the lower thermal sensitivity means less phase drift and potentially better stability for sensing applications.
- HCF backscatter is 27-42 dB below SMF levels, with two distinct mechanisms (gas scatter and surface roughness scatter) that require different measurement approaches.
- EDFA-amplified OTDR, exploiting HCF's low nonlinearity to boost launch power to 37 dBm+, restores practical dynamic range for loss and splice measurement up to 300 km.
- Bi-directional OTDR is essential for HCF to separate gas-pressure effects from true attenuation and to resolve asymmetric splice loss from HOM excitation.
- High-resolution OFDR (sub-mm) accesses the static surface-roughness fingerprint for fabrication quality control, distributed birefringence mapping, and thermal sensitivity measurement.
- Long-range OFDR (100-km, >90 dB dynamic range) enables metro-scale link monitoring using the coherent surface scatter fingerprint.
6 OTDR vs. OFDR for HCF: Choosing the Right Tool
OTDR (Amplified / Intensity-Based)
Detects: Gas-molecule backscatter
Resolution: 1.5 - 4.5 m typical
Range: Up to 300+ km (with high-power EDFA)
Best for: Splice loss measurement, fault location, link acceptance testing, field deployment QA
Limitation: Cannot detect structural uniformity; gas-pressure artifacts require bi-directional correction
Field-readiness: Production-deployed (Microsoft Azure, EXFO, VIAVI equipment)
OFDR (Coherent / Frequency-Domain)
Detects: Surface-roughness backscatter (static fingerprint)
Resolution: Sub-mm to 25 m (range dependent)
Range: Up to 100 km demonstrated
Best for: Fabrication quality control, birefringence mapping, structural uniformity, thermal sensitivity
Limitation: Requires Hz-linewidth laser and advanced post-processing; not yet widely available as field instrument
Field-readiness: Research / advanced laboratory tool
The choice between OTDR and OFDR for HCF characterization depends on the measurement objective. For network installation, commissioning, and maintenance -- where the primary need is locating splices, measuring loss, and finding faults -- EDFA-amplified OTDR is the practical choice. It uses commercially available equipment (with HCF-specific amplification), provides the range needed for metro and long-haul links, and produces trace formats familiar to field technicians.
For fiber manufacturing quality assurance, research into fiber structural properties, and advanced distributed sensing applications, OFDR provides information that OTDR cannot access. The ability to map birefringence along kilometers of fiber, detect sub-millimeter structural variations, and measure thermal sensitivity with 20x better performance than SMF opens new possibilities for fabrication optimization and fiber health monitoring.
An additional reflectometry variant worth noting is Correlation OTDR (C-OTDR), which uses coded sequences rather than single pulses to improve dynamic range through processing gain. C-OTDR has been used for high-resolution group delay measurements in HCF, suggesting its potential applicability for characterizing dispersion properties that conventional OTDR cannot measure.
7 Commercial Test Equipment Ecosystem
7.1 The Standardization Challenge
The practical consequence is that each manufacturer and deployer of HCF currently develops proprietary test procedures. Microsoft, for example, developed its own HCF-specific OTDR and acceptance specifications tailored to their deployment requirements. This situation drives the need for purpose-built HCF test equipment from established T&M vendors.
7.2 Emerging HCF-Optimized OTDR Solutions
The test and measurement industry has responded to the growing HCF deployment market. EXFO launched the first HCF-optimized bidirectional OTDR at ECOC in September 2025. This NS-348x kit provides 150 km measurement range with 46 dB dynamic range -- specifications designed to compensate for HCF's reduced backscatter while reaching metro-scale distances. The instrument includes specialized algorithms for interpreting HCF traces, including gas-pressure artifact correction and HOM-aware splice analysis.
VIAVI Solutions announced an all-in-one HCF testing and certification solution in January 2026, validated with three leading hyperscaler customers. This solution integrates OTDR measurement with insertion loss testing, back-reflection measurement, and end-to-end link certification in a single workflow designed for HCF field deployment.
These commercial solutions represent a critical milestone in HCF's transition from laboratory technology to production infrastructure. The availability of purpose-built, field-portable test equipment means that network operators no longer need to develop custom OTDR solutions -- reducing the barrier to HCF adoption.
7.3 Measurement Best Practices for HCF OTDR
Based on field deployment experience and published research, the following practices are recommended for OTDR characterization of HCF links:
Always measure bi-directionally. This is not optional for HCF. Gas-pressure gradients near fiber ends and splice-induced HOM effects create directional asymmetries that single-ended measurement cannot resolve. Average the forward and backward splice loss measurements for the most accurate result.
Use mode-field adaptors with low back-reflection. The SMF-HCF interface is the most critical point in the measurement setup. Ensure the adaptor provides below -60 dB return loss to minimize dead zones and detector saturation. Factory-fabricated HCF patch tails with verified reflection performance are preferable to field-assembled connections.
Account for the different group velocity. Light travels approximately 33% faster in HCF than in SMF. The OTDR instrument's distance calibration assumes the group index of SMF (approximately 1.468). For HCF, where the group index is close to 1.0, the instrument will report incorrect distances unless re-calibrated. Apply a correction factor of approximately nSMF / nHCF (roughly 1.468 / 1.003 = 1.464) to convert reported distances to actual fiber length.
Increase pulse width for long-range measurements. Given the lower backscatter, wider OTDR pulses (20-30 ns rather than the 5-10 ns typical for SMF) improve the signal-to-noise ratio at the expense of spatial resolution. For 100-km class links, spatial resolution of 3-5 meters is generally acceptable for splice and fault identification.
Validate OTDR splice loss against insertion loss measurements. Because OTDR splice loss measurement in HCF depends on the backscatter coefficient (which may vary along the fiber and differ between HCF and SMF), cross-referencing OTDR results with power-meter-based insertion loss measurements provides additional confidence, especially for HCF-to-SMF junctions.
8 Patent Landscape: OTDR Methods for HCF
The development of OTDR techniques for HCF has generated significant intellectual property activity. International patent application WO 2023/152468 (PCT/GB2023/050231), filed by the University of Southampton's Optoelectronics Research Centre, describes a method for OTDR measurement in hollow core optical fiber that specifically addresses the gas-scattering mechanism. The method involves launching optical pulses into the HCF, detecting backscattered light produced by Rayleigh scattering from gas molecules in the hollow core, and processing the detected signal to create a reflectometry profile showing the distribution of backscattered power along the fiber length.
The patent claims cover several practical applications of HCF OTDR: determining fiber attenuation from the profile, identifying peaks that locate defects or damage, extracting information about core size from backscatter power levels, and performing measurement during fabrication to provide real-time quality control feedback. The claims also extend to fiber configured as a gas-cell optical sensor, where OTDR monitors a parameter of interest that affects backscattered power. The patent describes the use of an input/output fiber (solid core) with an applied treatment (angled cleave or AR coating) to suppress back-reflection at the glass-air interface.
This patent activity reflects the commercial importance of HCF OTDR measurement and the recognition that purpose-built techniques (rather than simple adaptation of SMF methods) are required for production-quality HCF characterization.
9 Distributed Acoustic Sensing in HCF: Challenges and Opportunities
Distributed Acoustic Sensing (DAS) can be understood as a coherent extension of OTDR: instead of measuring only the intensity of backscattered light, DAS records the phase of the Rayleigh backscattered signal to detect acoustic and vibration events along the fiber. This technique has found extensive application in submarine cable monitoring, pipeline security, and seismic research using conventional SMF.
Applying DAS to HCF faces the same fundamental challenge as OTDR: the dramatically lower backscatter coefficient reduces the signal-to-noise ratio available for phase extraction. The first field demonstration of hollow-core fiber supporting Distributed Acoustic Sensing was reported at ECOC 2024, confirming that the technique is feasible but requires significant sensitivity enhancement compared to SMF-based DAS systems.
The gas-molecule backscatter in HCF presents an interesting duality for DAS. On one hand, its incoherent nature (due to molecular motion) makes traditional coherent DAS processing more challenging. On the other hand, the backscatter from gas molecules is sensitive to pressure and temperature changes within the hollow core, potentially enabling novel sensing modalities not possible with solid-core fiber. Monitoring gas pressure gradients along HCF could, for example, detect seal failures or atmospheric ingress in hermetically sealed fiber installations.
The low thermal sensitivity of HCF (20x lower than SMF, as measured by OFDR) also has implications for DAS: it means that temperature-induced phase drift -- a major source of noise in SMF-based DAS -- is substantially reduced in HCF. Whether this advantage offsets the lower backscatter signal remains an active area of research.
10 Future Directions
10.1 Next-Generation OTDR Architectures
Several research directions promise to further improve OTDR capability for HCF. Photon-counting OTDR, which uses single-photon avalanche detectors rather than conventional APDs, can extend dynamic range by 10-15 dB beyond conventional detection. When combined with EDFA amplification, this could enable OTDR characterization of HCF links exceeding 500 km -- distances relevant to future submarine or ultra-long-haul terrestrial HCF applications.
Coherent OTDR (C-OTDR) techniques, which use coding and correlation processing to improve dynamic range without increasing pulse power, are also being adapted for HCF. C-OTDR has already shown utility for high-resolution group delay measurements in HCF, and further development could combine the range advantage of OTDR with some of the structural information currently accessible only to OFDR.
10.2 Standardization Pathway
As EXFO, VIAVI, and other T&M vendors bring HCF-specific test equipment to market, pressure will build for standardized test procedures. ITU-T and IEC working groups are expected to develop OTDR measurement standards for HCF that address the unique backscatter mechanisms, specify appropriate measurement parameters, define calibration requirements (including group index correction), and establish pass/fail criteria for splice loss and link attenuation that account for HCF-specific physics.
10.3 Integrated Monitoring
The trend toward embedding OTDR capability directly into HCF line systems (as demonstrated in the 301.7-km unrepeated transmission system) will likely accelerate. As HCF moves into production networks, operators will demand continuous monitoring that does not require dedicated test instruments or service interruption. Software-defined OTDR modules integrated into DWDM line cards, combined with machine-learning-based trace analysis, could provide automated health monitoring of HCF links with splice-level granularity.
11 Conclusion
The 27-42 dB reduction in backscatter that makes Hollow Core Fiber so attractive for bidirectional transmission simultaneously creates one of its most significant deployment challenges: the inability of conventional OTDR instruments to characterize these fibers. The physics is clear -- light guided through air scatters far less than light guided through glass -- and the engineering response has been equally clear: amplified OTDR, bi-directional measurement methodology, purpose-built mode-field adaptors, and complementary OFDR techniques.
The field deployment evidence from Microsoft Azure demonstrates that these challenges have practical solutions. Custom HCF-specific OTDR has proven capable of measuring individual splice losses (mean 0.16 dB, best 0.04 dB), verifying distributed attenuation, and providing continuous monitoring of production HCF links carrying live customer traffic. Research OFDR systems have pushed the boundary further, accessing the fiber's structural fingerprint at sub-millimeter resolution and mapping birefringence variations along 5-km DNANF samples.
With EXFO and VIAVI now bringing HCF-optimized OTDR instruments to market, and standardization efforts underway at ITU-T and IEC, the test and measurement ecosystem is maturing in parallel with the fiber technology itself. The complete toolkit for HCF characterization -- spanning field-deployable OTDR for installation and maintenance, laboratory OFDR for fabrication quality control, and integrated monitoring for production networks -- is now taking shape. As HCF deployment scales from hyperscaler data center interconnect to broader telecom applications, this measurement infrastructure will be essential for ensuring the quality and reliability that optical network operators require.
References
- E. Numkam Fokoua, V. Michaud-Belleau, J. Genest, R. Slavik, and F. Poletti, "Theoretical analysis of backscattering in hollow-core antiresonant fibers," APL Photonics, vol. 6, no. 9.
- N. K. Fontaine, M. Mazur, B. J. Puttnam et al., "Ultra-high resolution and long-range OFDRs for characterizing and monitoring Hollow-core DNANFs," OFC.
- X. Wei, B. Shi, D. J. Richardson, F. Poletti, and R. Slavik, "Distributed Characterization of Low-loss Hollow Core Fibers using EDFA-assisted Low-cost OTDR instrument," OFC, paper W1C.4.
- Y. Chen et al., "Hollow core DNANF optical Fiber with <0.11 dB/km loss," OFC, paper Th4A-8.
- A. Ali et al., "Unrepeated HCF Transmission over spans up to 301.7 km," OFC.
- E. Ip et al., "First Field Demonstration of Hollow-Core Fibre Supporting Distributed Acoustic Sensing," ECOC.
- V. Michaud-Belleau et al., "Backscattering in antiresonant hollow-core fibers," Optica, vol. 8, no. 2.
- B. Zhu et al., "First Demonstration of Hollow-Core-Fiber Cable for Low Latency Data Transmission," OFC, paper Th4B.3.
- Microsoft Azure Blog, "The Deployment of Hollow Core Fiber" -- HCF field deployment and OTDR testing methodology.
- International Patent Application WO 2023/152468 -- OTDR methods for hollow core optical fibre (University of Southampton).
- ITU-T Recommendation G.652 -- Characteristics of a single-mode optical fibre and cable.
- Sanjay Yadav, "Optical Network Communications: An Engineer's Perspective" -- Bridge the Gap Between Theory and Practice in Optical Networking.
Developed by MapYourTech Team
For educational purposes in Optical Networking Communications Technologies
Note: This guide is based on industry standards, best practices, and real-world implementation experiences. Specific implementations may vary based on equipment vendors, network topology, and regulatory requirements. Always consult with qualified network engineers and follow vendor documentation for actual deployments.
Feedback Welcome: If you have any suggestions, corrections, or improvements to propose, please feel free to write to us at [email protected]

Optical Communications & Network Automation Expert | Author of 3 Books for Optical Engineers | Founder, MapYourTech
Optical networking engineer with nearly two decades of experience across DWDM, OTN, coherent optics, submarine systems, and cloud infrastructure. Founder of MapYourTech. Read full bio →
Follow on LinkedInRelated Articles on MapYourTech