Author

MapYourTech

Browsing
Share and Explore the Tech Inside You!!!

The number one way to ace to an interview is to know yourself! Always complete your research before an interview: know the kinds of things you are good at, the kind of things that you may need to work on, the kinds of experiences you’ve had in the past, what kind of boss you’d like to work for, what kind of company you’d like to work for, etc.

Questions that revolve around potential negatives are always the toughest to answer. Prepare for them by thinking about answers ahead of time. Type up answers or write them out, and review them before going into the interview. It is like studying concise, and then stopping and seeing if the interviewer wants to pursue it further.

The following questions have been identified as some of the toughest in the interviewing business. These are the ones you need to prepare for ahead of time!

1. Tell me about yourself.
Probably the easiest difficult question you will face! It is easy to talk about you, but what does the employer really want to know? Try talking about personal characteristics and skills that translate into career strengths. Develop a one ­minute commercial for yourself. In one minute, tell someone from your high school days upward why you chose the college you did; what you did in college and why you made the decision to go into your particular field.

Typically the interviewer is looking for an overview of your related experience. Provide an answer that shows a logical progression throughout your educational/professional career. If your educational background led you in a certain direction, include that in the overview. While this may be seen as an easy question for some, quite a few solid candidates blundered on this simple question. We are not used to selling our abilities and competencies like a product. For those who have given it some thought, this is the right opportunity to talk about your strengths such as your enthusiasm, leadership, self­-confidence and reliability, with a few real ­life anecdotes thrown in to support your points.

EXAMPLE: “I love to jump into projects with both feet. I can concentrate on solving a tech problem for hours, although I know to effectively use my time I need to consult my colleagues for their expertise, and often convene brief project team meetings bounce around a solution, plotting it out, and preparing a presentation for my boss. Object ­oriented technology [or any other skill] is my newest challenge.”

EXAMPLE: “My background to date has been centered on planning myself to become the very best I can become.

Let me tell you specifically how I’ve prepared myself…”

2. What are your greatest strengths?
You certainly have many positive qualities, but since you can only choose a few, be careful as your answer will also reflect your values. Some might say honesty, other reliability or a strong sense of leadership, but whatever it might be, be ready to make reference to a situation where you have demonstrated such strength. Examples help solidify and support your strengths.

3. What is your greatest weakness?
Admit that you have a weakness, and that you are successfully using a strategy to improve this weak are you have realized in your professional array of skills and experience. This technique turns the weakness into a strength by demonstrating your commitment to self­ improvement.

EXAMPLE: “I would say that my greatest weakness has been a lack of proper planning in the past. I would over­commit myself with too many variant tasks, then not b able to fully accomplish each as I would like. However, since I’ve come to recognize that weakness, I’ve taken steps to correct it. For example, I now carry my palm pilot at all times so that I can effectively plan my appointments and “to do list” items.”

4. What were your favorite subjects in school and why?
Of course, if your major is Computer Science, you want to mention some of your computer science classes. You can mention other related subjects as well. For example, if you’re interviewing at a financial services firm, you might discuss why you liked your accounting or finance classes. If you did any usual or special projects in that area bring it up now. Mention anything that shoes keen interests in this employer’s particular kind of work.

5. Why change jobs now?
Interviewers want to now your reasons for leaving a particular position/employer. It is important to stay positive about your past experiences. Nobody wants to hire a person that complains about past employers­they figure you may complain about them in the future. Talk about why it was time to move on, that you learned a lot, you are seeking new and more challenging opportunities, etc.

6. What makes you stand out when compared with your peers?
Employers want to know that they are considering someone who will go above and beyond the call of duty. It is easy to hire a person that will do that they are asked to do between nine and five. However, it is better to hire a person that meets all the

basic expectations and more. Provide examples of projects which you excelled with, ideas that helped streamline operations, or new sales/marketing techniques that increased revenues. If you put some thought into it, there are probably several things you have accomplishes in the past that makes you stand out.

7. What type of management / supervision do you prefer?
This question can come in many forms, but the meaning is always the same: are you able to be managed by people with different styles? You probably have reported to managers with vastly different approaches to management and supervision, and have learned which styles you prefer. Since you probably do not know the manager’s style at the prospective employer, talk about the positive aspects of each style you’ve encountered.

8. What do you like about your current position? What would you add to make it more challenging?
Interviewers are looking for people that have some relevant experience for the position offered. This question allows you to pick the responsibilities that you enjoyed that are also included in the available position. (I like the people is NOT an acceptable answer, unless you are taking them with you!) The second part of this question focuses on what you want to learn in your next job. If it were available in your present/last position, you would still be there. Think about what this position offers and what you can contribute. This should match well with that you want to learn/do.

9. Where do you see yourself in (X) years?
This may be the toughest question of them all! If you only had a crystal ball! Basically, however, Interviewers are doing a reality check here. They want to see if you are a realistic about your career goals and the steps you will need to take to attain them.

The best answers start in the present and work forward. Talk about your next move and what you hope to accomplish over the next year or two. Then take that one or two more steps. Most importantly, keep your dreams within the realm of reality.

10. Why should we hire you for this position?
This question is as straightforward as they come. If you’ve prepared for the interview ahead of time, this one should be easy. Your answer should focus on your experience, accomplishments, why you are different than your peers, and your work ethic, as they pertain to the specific job description. If you handled the interview well up to this point, you are just tying it all together.

11. What books/magazines do you read?
Obviously, a technical or trade journal is one answer they are looking for. The books you’ve read tell the manager something about you personality. Whatever you do, don’t say, “I don’t like to read.”

12. What interests you most about this position?
Your education, training and experience as well as your accomplishments should provide good references for answering that question. Do not hesitate to stress the fact that this would represent a dynamic move, while giving you the opportunity to grow, to increase your responsibilities and knowledge of the field, and may possibly help you define and reach new goals.

13. Do you work well under pressure?
Of course everyone will say yes, but it is more convincing if you could provide examples of situations when you have remained cool under fire. Be careful not to choose a situation of crisis for which you were the one responsible!

14. If you could change one thing about your personality, what would it be, and why?

Make the answer to this question positive by referencing your attitude and determination. Comments such as “I am sometimes impatient with slow performers” or “Being very demanding of myself” or “Sometimes I expect too much from others” are good. Keep in mind that most interviewers will use the information you give them to raise even more incisive questions.

15. How has your education prepared you for your career?
EXAMPLE: “As you will note on my resume, I’ve taken not only the required core classes in the field, I’ve also gone above and beyond. I’ve taken every class the college has to offer in the field and also completed an independent study project specifically in this area. But it’s not just taking the classes to gin academic knowledge­I’ve taken each class both inside and outside of my major, with this profession in mind. So when we’re studying in , I’ve viewed it from the perspective of . In addition, I’ve always tried to keep practical view of how the information would apply to my job. Not just theory, but how it would actually apply. My capstone course project in my final semester involved developing a real­world model of , which is very similar to what might be used within your company. Let me tell you about it…”

16. Are you a team player?
EXAMPLE: “Very much so. In fact, I’ve had opportunities in both athletics and academics to develop my skills as a team player. I was involved in at the intramural level, including leading my team in assists during the past year­I always try to help others achieve their best. In academics, I’ve worked on several team projects, serving as both a member and a team leader. I’ve seen the value of working together as a team to achieve a higher goal than any one of us could have achieved individually. As an example…”

17. Have you ever had a conflict with a boss or professor? How was it resolved?
EXAMPLE: “Yes, I have had conflicts in the past. Never major ones, but certainly there have been situations where there was a disagreement that needed to be resolved. I’ve found that when conflict occurs, it’s because of a failure to see both sides of a situation. Therefore, I ask the other person to give me their perspective and at the same time ask that they allow me to fully explain my perspective. At that point, I would work with the person to find out if a compromise could be reached. If not, I would submit their decision because they are my superior. In the end, you have to be willing to submit yourself to the directives of your superior, whether you’re in full agreement or not. An example of this was when…”

18. If I asked your professors to describe you, what would they say?
EXAMPLE: “I believe they would say I am very energetic person, that I put my mind to the task at hand and see to it that it’s accomplished. They would say that if they ever had something that to be done, I was the person who they could always depend on to see that it was accomplished. They would say that I always took a keen interest in the subjects that I was studying and always sought ways to apply the knowledge in real world settings. Am I just guessing that they would say these things? No, in fact, I am quite certain they would say those things because I have them with me in several letters of recommendation from my professors, and those are their very words.”


19. What qualities do you feel a successful manager should have?
EXAMPLE: “The key quality should be leadership ­ the ability to be the visionary for the people who are working under them; the person who can set the course and direction for subordinates. A manager should also be a positive role model for others to follow. The highest calling of a true leader is inspiring others to reach the highest of their abilities. I’d like to tell you about a person who I consider to be a true leader…”


20. If you had to live your life over again, what would you change?
EXAMPLE: “That’s a good question. I realize that it can be very easy to look back and wish that things had been different in the past. But I also realize that things in the past cannot be changed, that only things in the future can be changed. That’s why I continually strive to improve myself everyday and that is why I am working hard to become the very best your company has ever had­ to make a positive change. So in answer to your question, there isn’t anything in my past that I would change. I look to the future to make changes in my life.”


21. Why were you fired from your last job?
If you were fired wrongfully, say it matter­ of­ factly. Do not show a grudge against your old employer. If you were fired because something that was your fault, say it in a less damaging way.


EXAMPLE: “I cut prices on our product to make a customer happy without asking my superior. The company lost money and I was fired because of that. I agree it was my fault­I should have asked my superior. I have learned my lesson and it will never happen again.”


22. It’s been 6 years since you started your bachelor’s degree, why aren’t you finished?
Be as positive as possible and explain your reasons calmly and logically. Never answer the following: you are having too much fun and did not have time, you do not think a degree is important, etc.


23. If you join our company, and another company offers you more money, will you leave? Or, how long will you stay with us?
If you say yes, you will probably not get the job. If you want, you can tell them that the salary will make you happy and keep you with this company. For example, you might say something like, “If I accept the job, then that means that I also accept the salary and I do not think I will leave.” Concerning your length of employment longer is better. You may want to discuss that you want to stay at your next job as long as the relationship is mutually beneficial.


24. What are the things in a job that make you more productive? Less productive?
Remember, no work environment is 100% perfect. You can’t please all of the people all of the time. However, we adapt and make the best of what we have. So make your answer practical.


25. Why have you been unemployed for the last two years?
You must have a sound reason for not working so long or having a big gap in your work history. Some examples of good reason would be: Caring for a sick family member; Raising children; Looking for the right job where you can really contribute (this will not work if the period of unemployment was an extremely long time); Trying out self­ employment or owning your own business; Returning to school for further training; Learning new skills; Exploring or traveling (for a short gap only).


26. At your last job, you worked at the same position for five years without a promotion. Why?
Avoid saying anything negative. Tell the truth in a positive way.Its human unconscious bias, negative things stuck in mind for long.


EXAMPLE: “There was not much growth in our department. None of the people working in my department had been promoted. This is one of the reasons I am looking for a new employment opportunity.”


27. What salary are you looking for? Or, what kind of salary do you think you are worth?
Don’t be too specific – a range is often most comfortable for everyone to work with. Even better, ask if the company has a salary scale and base your answer on that. Remember, salary is related to market value. Research your worth before you get into the interview. Also, interviews are not ignorant. Research your market value and give a range


EXAMPLE: “I checked a few sites on the internet and found that the average salary for a web designer ranges from 45K to 60K per year in this geographic area, depending on the responsibilities and duties involved. I am not set on a specific number and am willing to negotiate.”


28. How many players are there in a soccer game?
This type of question has nothing to do with your career. Right or wrong answers do not matter. Interviewers want to see if you can manage with non­related subjects, and think on your feet. They might be testing your ability to reason, problem solve, and utilize resources.


EXAMPLE: “I am not sure but my guess would be at least two players on each side, one in the goal and one to play defense. I will put the number between seven and twelve on each team. I would definitely want to consult a colleague of mine who plays soccer if this was a game show right now – using phone a friend is important sometimes in utilizing available resources.


29. Do you have any questions?
If you have done your homework, you’ll have several questions to ask about the position, company, or industry. Having questions already prepared makes you appear motivated to excel in the interview, and generally organized and put­ together. If all else fails, ask the interviewer if they need any further clarification about your qualifications.


These questions and answers are collected from internet pool.

Questions on WDM Technology

  • How to determine aggregate output power of a WDM?
  • Spectral width wavelength to frequency conversion.
  • Difference between CWDM and DWDM.
  • What is Red band and Blue band?
  • What is dark fibre and dim fibre?
  • What are dark fibre considerations?
  • How many types of optical fibres?
  • Specifications of Multimode Fibre?
  • How many types of Single mode Optical fibres.
  • What are dispersion and attenuation coefficient of NDSF.
  • If for same distance OTDR done and wavelength changed, will it show any difference in Losses?
  • What is micro bending and macro bending?
  • What is fibre characterization?
  • Types of patch cord.
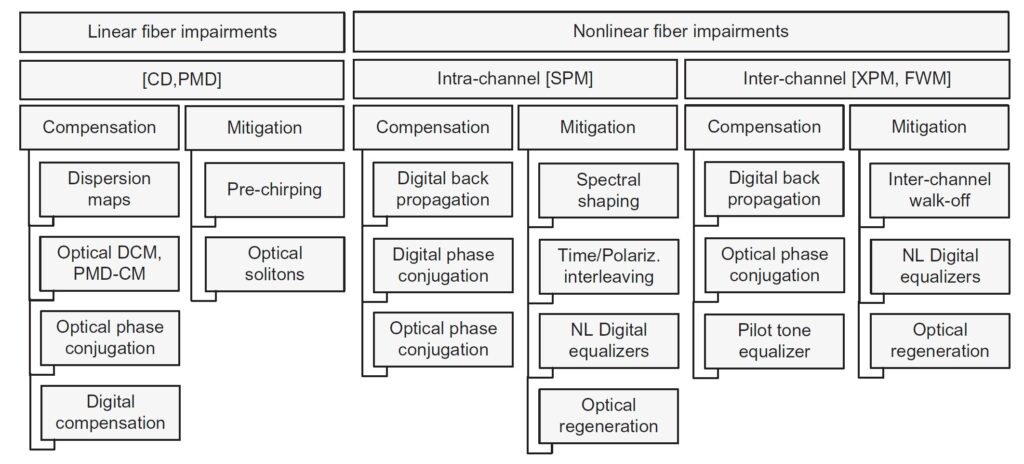
  • What is Linear and nonlinear impairments
  • What is Stimulated Raman Scattering (SRS)?
  • What is Stimulated Brillouin Scattering (SBS)?
  • What is Four Wave Mixing (FWM)?
  • What is Intensity Modulation (MI)?
  • What is Self phase modulation (SPM)?
  • What is Cross phase Modulation (CPM or XPM)?
  • How to reduce FWM impact?
  • What is impact of linear and nonlinear effects in DWDM network?
  • What are 3R, 2R and 1R?
  • What are types of Pluggable Optics?
  • What is common optical specification of Optical Transceiver (Pluggable Optics or Transponder)?
  • What is fixed optics?
  • If for point to point fiber link, two routers are connected and LX SFP used. If losses increased in fibre, what are possibilities to keep the link working?Want to connect client who is 300 kms apart. I don’t want to use EoSDH. I have 1000base ZX SFP. Can I send my link using 5 amplifiers.
  • Types of Receivers?
  • Why Receiver Sensitivity is so important for optical module?
  • How many types of Amplifiers used in DWDM network?
  • Raman Amplifier specification Vs. EDFA Specification.
  • Difference between EDFA and Raman amplifier?
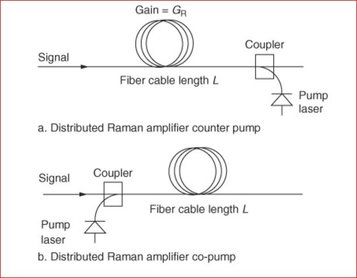
  • Typical application of Raman amplifier.
  • What is Dual or Double stage amplification?
  • What are probable causes when second amplifier is getting low input power or no power, while first amplifier is transmitting target power in Dual stage amplifier?
  • What is Hybrid Amplification?
  • What is difference between Pre- Amplifier and Post- Amplifier (Booster)?
  • What is power control mode and Gain control mode?
  • What is effect of Amplifier gain on OSNR while reducing or increasing flat gain? (Linkedin).
  • What are Specifications of Optical Amplifiers?
  • What is gain tilt and Gain ripple?
  • How amplifier positioned in Bidirectional Single fiber DWDM network?
  • How WDM Works?
  • What are typical specifications of DWDM MUX?
  • What is Maximum channel capacity of DWDM channel?
  • What are key attributes for selecting OADM?
  • What are optical specifications of OADM?
  • What is CWDM?
  • What is channel equalization? What is impact of non-uniform power spectrum?
  • What are probable causes when among 10 channels; one transponder at remote end is getting power below set threshold?
  • How equalization can be checked?
  • What is PMD?
  • What is DGD?
  • Is there any correlation between chromatic dispersion and PMD?
  • What is Linear and nonlinear impairments?
  • What is dispersion?
  • What are the types of dispersion?
  • What is Pilot Tone in WDM?
  • How CD and PMD limits vary with channels and bitrate?
  • What is FEC?
  • How does FEC impact OSNR and BER value of a link?
  • What is Q factor?
  • Why we simulate Q rather BER?
  • What is OSNR and what is its significance?
  • How to improve OSNR of a link?
  • At what point OSNR is max and min in a WDM link?
  • What is OSC in DWDM link? What are the wavelengths used for it?
  • What is the bandwidth of OSC signal?
  • Where is OSC signal introduced in a DWDM link?
  • What if OSC is inserted on MUX port?
  • Why 3dB is crucial factor in WDM and what does it mean?
  • What is dead zone and why it is created in Photonic’s spectrum?
  • What is centre frequency and how is it important?
  • What is channel width slot width, channel spacing and centre frequency?
  • What is the modulation techniques used in current for WDM transmission?
  • What is the difference between transponder and muxponder ?
  • What are the type of module used for transmitter and receiver in WDM link?
  • Why EDFA is considered as best for commercial use?
  • How RAMAN amplifier is used in the network?
  • What is the frequency band for EDFA and RAMAN?
  • Whether EDFA can be used in bidirectional WDM and if yes how?
  • What is composite power and how it is measured?
  • How to measure composite power when all input powers are different?
  • How monitoring ports work on WDM cards?
  • What are the causes and source of ASE generation in WDM link?
  • Do we place attenuator with EDFA amplifiers and if yes where?
  • Why we put DCM in between two AMP in a WDM link?
  • What is the maximum and minimum value of OSNR for a link?
  • What are the different types of amplifiers available?
  • What is Channel flatness and how it is important?
  • Why changing power of one channel affects whole band power or composite power?
  • Can you please tell me what the difference between, dB and dBm when you are trying to test fiber optic cable.
  • What is ORL value? How does it matters in a link?
  • What is BOL and EOL and what is the margin between them?
  • Why there is ALS system on AMPs or photonic systems?
  • Why is it required to create adjacencies or logical connection between MUX and Transponder and other elements in WDM network?
  • What is fiber fuse and what is the cause for the same?
  • What is chirp and what is it’s effect and how it affect a link?
  • Why Raman is not used in place of EDFA ?
  • What is Q factor ? and how it is calculated ?
  • Noise figure ?
  • How OSA tester works and what are different options in the test instrument ?
  • Commissioning of new OCH in the network?
  • Link budgeting and commisioning parameters ?
  • Braggs Grating & AWG difference?
  • How to test OSNR using OSA for 10G, 40G & 100G channels ?
  • Soft DECISION & Hard DECISION FEC?
  • What is osnr threshold for 10 / 40/ 100G?
  • what is the max no. OF repeater can be used in a link?
  • How alarm propogate when there is no frame structure in dwdm?
  • What are the general alarms observed in a DWDM network?
  • What are the performance parameters for DWDM elements.
  • How DCM is used in DWDM?
  • Can we use DCM in 100 G network?
  • What is the channel spacing for hybrid channels(10/40/100/200) coherent and non coherent?
  • Will a single mode connector work on multi-mode cable?
  • How an optical power meter differs from an OTDR.
  • Is it possible to convert optical fiber signal into cat5 and if yes how?
  • Why do some power meters have calibration at 1300 nm while others are 1310 nm?
  • What is flexgrid network?
  • What is difference between CDC networks?
  • What is WSS based technology?
  • What is ITL used for?
  • Why WDM network doesnot requires external SYNC ?
  • How Extended shelf communicates in rack ?
  • What are the passive and active components available in a DWDM network?
  • How different modulation techniques affect technical parameters in a link?
  • What are the various graphs generally used for representing WDM performance for a network?
  • What if very high power launch from transmitter/OTDR with another end open.

FIber Technology Questions

1. What is optical fiber?
Optical fiber is a glass or plastic filament that guides a light wave along its path.

2. What is multimode fiber?
Multimode fiber is optical fiber that allows light to travel down multiple paths, also referred to as modes. It features a core diameter of 50 to 62.5 microns. Multimode fiber can be used to transmit AV signals in short to intermediate-distance applications, such as within a building.

3. What is singlemode fiber?
Singlemode fiber is optical fiber that allows light to travel down a single path known as the fundamental mode. It features a core diameter of 8 to 9 microns. Singlemode fiber can be used to transmit AV signals over extreme distances up to many miles or kilometers.

4. How is an AV signal transmitted down a fiber?
A fiber optic transmitter converts the AV signal into an optical signal, using a VCSEL or laser diode as a light source. A glass fiber guides the optical AV signal along its path. A photodetector in a fiber optic receiver at the far end of the fiber converts the optical AV signal back into an electrical AV signal.

5. What is a light-emitting diode?
A light-emitting diode — LED is a semiconductor device that emits light when an electrical current passes through it. An LED that emits visible light is used in a variety of applications, including signage, area lighting, numerical displays, and indicator lights on electrical equipment. In fiber optics, an LED is used as a light source for low-speed signals such as, TOSLINK or 100BASE-SX Ethernet, due to its low cost. An LED is not recommended for transmitting high speed video signals over fiber.

6. What is a laser diode?
A laser diode is a semiconductor device that emits a narrow beam of coherent light, such as the beam of light from a laser pointer. In AV fiber optic transmitters, laser diodes are used as the light source for transmitting video, audio, and control signals.

7. What is a VCSEL?
VCSEL stands for Vertical Cavity Surface Emitting Laser. A VCSEL is a special type of laser diode that has lower manufacturing costs than other types of laser diodes. It can be mass-produced with high yield rates and has a smaller PCB footprint, making it ideal for use in fiber optic transmitters to send high resolution video, audio, and control signals.

8. What is a photodetector?
A photodetector is a semiconductor device that converts an optical signal into an electrical signal. A photodetector is used in a fiber optic receiver to convert optical AV signals.

9. What wavelengths are used with multimode fiber?
Multimode fiber is capable of transmitting a wavelength at or around 850 nm, 1300 nm, or 1550 nm. The most common wavelengths are 850 nm and 1300 nm due to the availability of low cost semiconductor light sources and photodetectors.

10. What wavelengths are used with singlemode fiber?
The most common wavelengths are 1310 nm and 1550 nm. At 1310 nm, chromatic dispersion is near zero, and at 1550 nm, attenuation is near its minimum. In OS1 singlemode fiber, wavelengths around 1390 nm should be avoided due to high attenuation caused by absorption. OS2 singlemode fiber is capable of transmitting any wavelength above its cutoff wavelength, which is typically around 1250 nm.

11. What is the cutoff wavelength for singlemode fiber?
The cutoff wavelength for singlemode fiber is the minimum wavelength that supports one mode of propagation. Above the cutoff wavelength, singlemode fiber propagates only one mode. Below the cutoff wavelength, singlemode fiber propagates more than one mode, similar to multimode fiber.

Actually  SPE(synchronous payload envelope)  can start anywhere within the SONET payload, which necessitates the need for a pointer to point to the beginning of the SPE.

Lets consider that  the SPE begins on byte 276 (fourth row, sixth column) of frame i, and ends at byte 275 (fourth row, fifth column) of the next frame + 1. The next SPE starts immediately, on byte 276 of frame + 1, and so on. In general, SONET assumes that the SPE can be floated within the payload of the frame, and it provides a pointer in the overhead section for locating its beginning.

As we know that  the beginning location of frame is given by H1H2 value and also that H1+H2 indicates the offset (in bytes) from H3 to the SPE (i.e. if 0 then J1 POH byte is immediately after H3 in the row). Similarly end can be found because each SPE has a fixed number of bytes.

In H1+H2, 4 MSBs are New Data Flag, 10 LSBs are actual offset value (0 – 782).

So, When offset=522 the STS-1 SPE is in a single STS-1 frame. And In all other cases the SPE straddles two frames When offset is a multiple of 87, the SPE is rectangular. This all happens with ideal synchronization conditions else H3 byte take cares further.
Some fixed start and end locations for various payloads are:-
Pointer Range: 0-103 (VT1.5 type)
Pointer Range: 0-139 (VT2 type)
Pointer Range: 0-211 (VT3 type)
Pointer Range: 0-427 (VT6 type)
Pointer Range: 0-782 (SPE,STS-1 type)
Pointer Range: 0-2339 (STS-3c type)

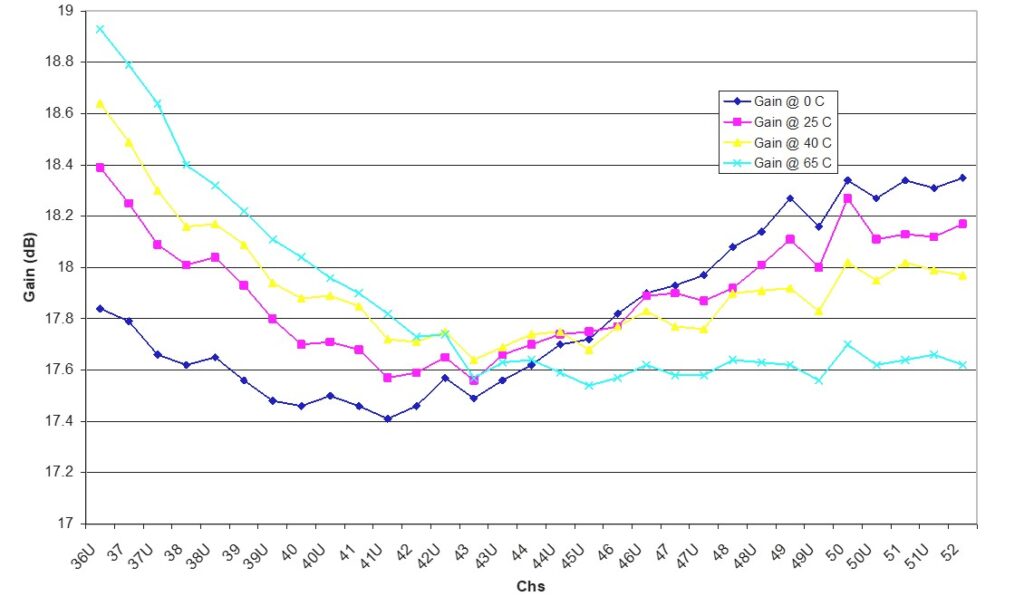
Here the results are after evaluating the effect of a thermal variation on the output tilt. In this particular set-up the amplifier is kept at room temperature (25 °C) and only the active fiber spool undergo a thermal cycle. Temperature of the EDFA is varied from 0 °C to 65 °C and the amplifier gain is measured at four point : 0, 25, 40 and 65 °C.


As can be seen a 65 °C temperature variation implies a 1.8 dB tilt variation. Considering a reduced temperature range (5-45 °C) the output tilt variation is about 1.1 dB.

It was  tried to investigate the origin of the temperature dependency. First  used a different EDFA with a lower erbium concentration (14 dB/m erbium peak absorption); then tried to reduce the saturation of the EDFA using lower power levels, but in both cases the output tilt variation was very similar to that of Figure .

Temperature variation has also effect on the EDFA efficiency: with high temperature the active fiber is less efficient than at low temperature.

With constant pumps power, a 65°C variation implies a 0.25 dB difference on the output power. To compensate this extra tilt we can act in two way: using the VOA ; heating the EDFA to a constant 65 °C.

First solution requires a thermal sensor to measure the EDFA temperature and a compensation table (stored in the firmware) to act on VOA attenuation.

Second solution requires a heater and special mechanics & software to store the EDFA spool and to keep their temperature constant.

Spectral Hole Burning (SHB)

Spectral hole burning (SHB) is a major limitation of amplified WDM systems with high channel count. The main reason lies in the fact that there is no possibility of compensating for this effect.

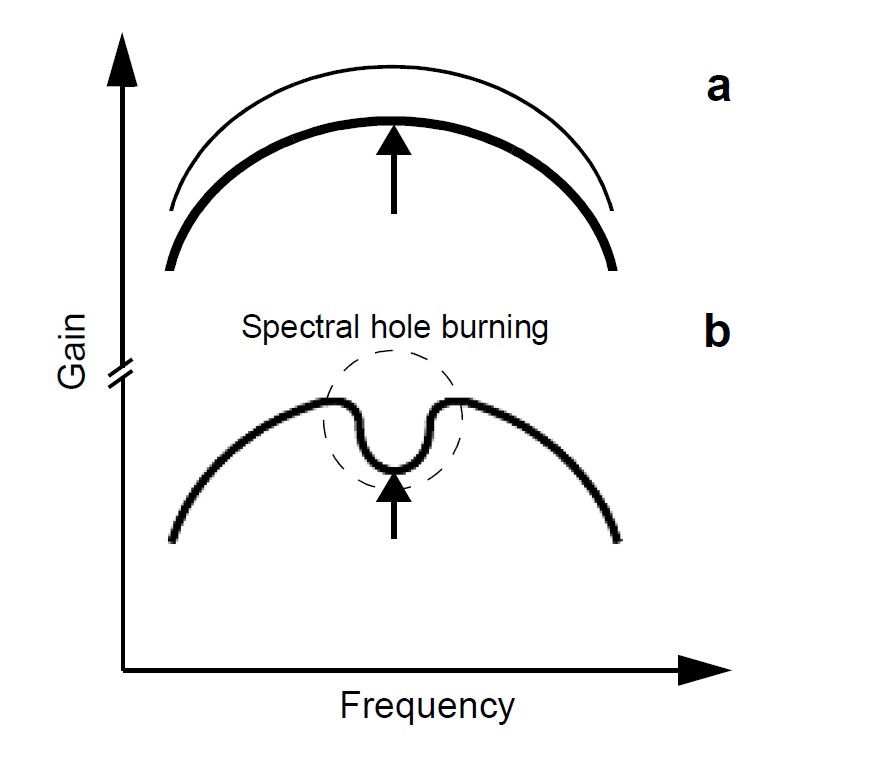
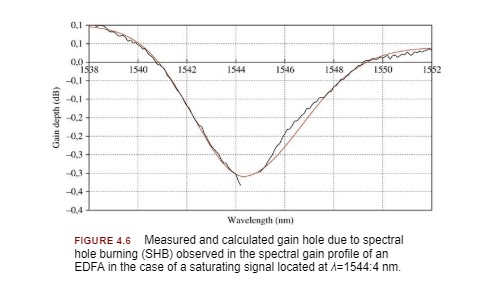
  • Due to the inhomogeneous portion of the linewidth broadening of the dopant ions, the gain spectrum has an inhomogeneous component and gain saturation occurs, to a small extent, in an inhomogeneous manner. This effect is known as spectral hole burning because a high power signal at one wavelength can ‘burn’ a hole in the gain for wavelengths close to that signal by saturation of the inhomogeneously broadened ions. Spectral holes vary in width depending on the characteristics of the optical fiber in question and the power of the burning signal, but are typically less than 1 nm at the short wavelength end of the C-band, and a few nm at the long wavelength end of the C-band. The depth of the holes are very small, though, making it difficult to observe in practice.

shb

    • In addition, accurate predictions are very difficult to carry out. SHB acts as a selective oversaturation of specific erbium ion classes due to a precise matching of the signal wavelength with their corresponding Stark energy sublevels. Gain contributions of a given ion class to the overall amplifier gain spectrum will be dependent on the specific values of energy of the related Stark sublevel (determined by inhomogeneities in the local electric field in the glass as opposed to on the crystal) and of their population density (i.e. of the related induced saturation). Clearly, the overall gain spectrum of the amplifier may be distorted due to this SHB effect. The best-known induced distortion is the hole induced in the gain spectrum in the spectral vicinity of a saturated channel.
    • This gives rise to a hole in the gain profile around the saturating channel wavelength, whose width is determined by temperature. Increasing temperature will increase this homogeneous broadening (and thus the hole width at the expense of its depth) while lower temperatures will reduce and make this hole deeper in the gain profile. . Since it is not possible to operate the amplifier at a lower temperature where the effect of homogeneous broadening vanishes, the system designer should account for the holes induced by each signal channel in the amplifier gain profile at room temperature


    • SHB does not distort the overall gain profile because the sum of the different contributions has a flat transfer function. Problems may be encountered when some channel powers increase compared to other channels
    • SHB could be seen (wrongly) at first glance as a regulating effect because the most favored channels will see a slightly lower gain due to the SHB they induce. This will indeed slightly reduces the power excursion between channels (the correcting effect being, however, much lower than the effect creating this SHB). The detrimental effect actually comes from the distortions induced in the amplifier gain spectrum due to thermal broadening. Other channels, located a few nanometers aside from the most favored ones will also see an induced reduced gain level, while such channels may not be gain favored like the channels that create the SHB effect. This will result in a decrease in the OSNR of such neighboring channels
    • The SHB effect not only stresses the dynamic range of the system by increasing the burst power but it also degrades the OSNR performance. In particular, whilst the power change is limited to the beginning of the burst (during the formation of the hole), the OSNR impairment is observed at the end of burst,where the spectral holeis already completely formed by the burst.

    SHB also has a limiting effect in the implementation of preemphasis of the less-favored channels. This technique consists of increasing the power of the worst channels at the transmitter side, at the expense of the best channels, leading to the same OSNR for all channels at the link output. This can be performed while keeping the EDFA output powers constant and decreasing the transmitted power of the best channels. However, the highest predistortion that can be performed at the link input in order to compensate for a given excursion in output OSNR is limited by SHB.


Quick Optical Converter

Power(mW);
 ↔  Power(dBm);
Coupling ratio (%);
 ↔  Insertion Loss(dB);
Frequency(THz);
 ↔  λ (nm);
Δƒ(GHz)

 ↔  Δλ(nm)

Q-factor;
 ↔  BER;


Composite Power Calculation

Total number of Channels:
Per Channel Power (dBm):
Insertion Loss of Filter (dB):
Composite Power (dBm)

Net Composite Power Change

No. of Channels added/removed:
No. of Channels undisturbed:
Net Power Change (dBm)

IP TO HEX, DECIMAL, BINARY

IP to Hex, Decimal, Binary


Hex to IP Address


Decimal to IP Address


OPTICAL FIBER LINK ATTENUATION CALCULATOR


Fiber Distance
Loss per Km dB/Km
Total Fiber Loss dB
Connector Pair Loss

dB
Number of Connector Pairs

Total Connector Loss dB
Individual Splice Loss

dB
Number of Splices

Total Splice Loss dB
Optical Bypass Switch Loss

dB
Optical Splitter Loss

dB
Other Optical Components Loss dB
Total Other Components Loss dB
Total Fiber System Attenuation dB
(Total Fiber Loss + Total Connector Loss + Total Splice Loss + Total Other Components Loss)


Optical Standards

https://www.itu.int/en/ITU-T/techwatch/Pages/optical-standards.aspx

https://en.wikipedia.org/wiki/ITU-T

ITU-T Handbook

ITU-T Study Group 15 – Networks, Technologies and Infrastructures for Transport, Access and Home

ITU-T Video Tutorial on Optical Fibre Cables and Systems


Recommendations for which ITU-T test specifications are available
ITU-T Recommendations specifying test procedures are available for the following Recommendations:


Optical fibre cables:

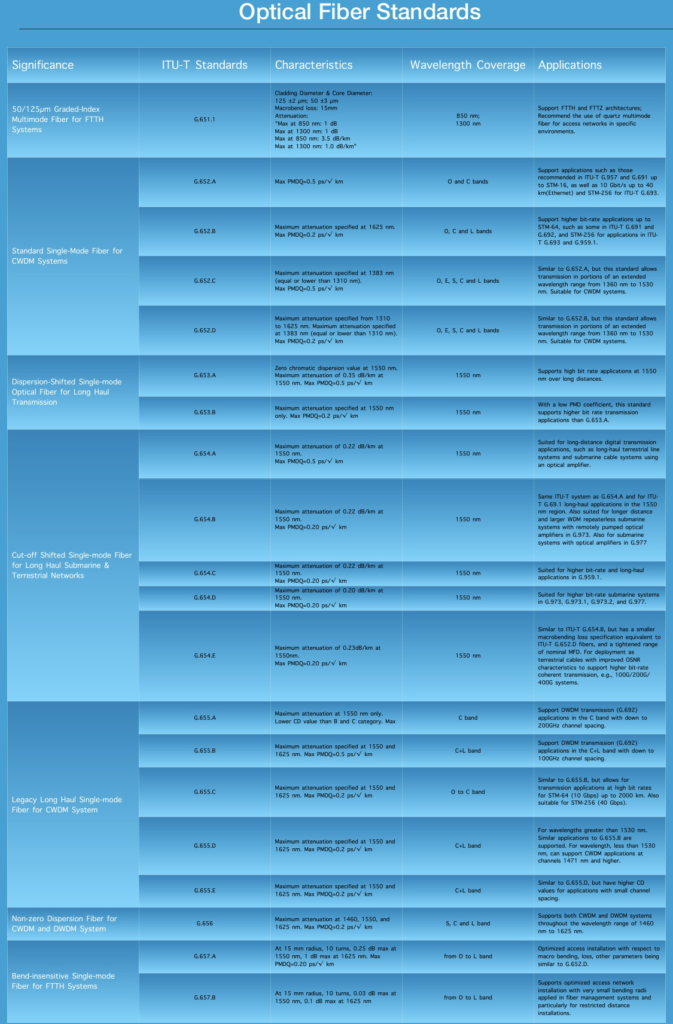
  • G.652 (2009-11) Characteristics of a single-mode optical fibre and cable
  • G.653 (2010-07) Characteristics of a dispertion-shifted, single-mode optical fibre and cable
  • G.654 (2010-07) Characteristics of a cut-off shifted, single-mode optical fibre and cable
  • G.655 (2009-11) Characteristics of a non-zero dispersion-shifted single-mode optical fibre and cable
  • G.656 (2010-07) Characteristics of a fibre and cable with non-zero dispersion for wideband optical transport
  • G.657 (2009-11) Characteristics of a bending-loss insensitive single-mode optical fibre and cable for the access network

Characteristics of optical components and subsystems:

  • G.662 (2005-07) Generic characteristics of optical amplifier devices and subsystems
  • G.663 (2011-04) Application related aspects of optical amplifier devices and subsystems
  • G.664 (2006-03) Optical safety procedures and requirements for optical transport systems
  • G.665 (2005-01) Generic characteristics of Raman amplifiers and Raman amplified systems
  • G.666 (2011-02) Characteristics of PMD compensators and PMD compensating receivers
  • G.667 (2006-12) Characteristics of adaptive chromatic dispersion compensators

Optical fibre submarine cable systems:

  • G.973 (2010-07) Characteristics of repeaterless optical fibre submarine cable systems
  • G.974 (2007-07) Characteristics of regenerative optical fibre submarine cable systems
  • G.975.1 (2004-02) Forward error correction for high bit-rate DWDM submarine systems
  • G.977 (2011-04) Characteristics of optically amplified optical fibre submarine cable systems
  • G.978 (2010-07) Characteristics of optical fibre submarine cables


aws interview

Amazon Web Services (AWS) is a subsidiary of Amazon providing on-demand cloud computing platforms and APIs to individuals, companies, and governments on a metered pay-as-you-go basis. Read more on https://aws.amazon.com/

Amazon keeps on hiring all round the year as they are continuously striving to look for candidates with great leadership and technical skills. The intent of this article to enable candidates to understand the process better and prepare themselves accordingly.

There are multiple ways of finding a job at AWS, and a few of my recommendations are:-

Amazon Job Portal: This job portal is the best way to explore jobs according to your skills. Just search whatever kind of job and at what locations you are looking for, and you can see the multiple posted jobs that you are always free to apply for. Some FAQs

Approach for referral: The second best way is to look for your former colleagues or acquaintance on Linkedin Contacts who can refer you for the correct job. Ask them to refer you, providing them with the Job ID mentioned on the application. This process helps you in getting some insights into the profile and the job nature.

Once your application is reviewed and found successful, somebody from HR will approach you regarding the job and ask you for your interview availability. They may ask few dates which suit your availability. Candidate is free to provide available date as per their choice.

Once the date is finalized, HR will confirm the next step, usually Phone Screen/Phone Interview.

I will explain here about Network Development Professionals. We use NDE(Network Development Engineers) as technical roles term. I will collect most of the information which is available in the public domain. This article is for experienced candidates with experience in relevant roles for some time.

Interviewing Steps :

Phone Screen/Phone Interview:

This will be a 45-60 min interview on the telephone. At scheduled time, candidate needs to join a chime bridge and you probably need to download Amazon Chime, our video-conferencing tool (the step-by-step guide can be found here). If you’re presenting, you will need to download Chime onto your desktop. The meeting ID# will be emailed to you by your recruitment point of contact. For optimal sound quality, use a headset with a microphone or with the details already provided in the email from HR.

Personal Recommendations:
-Visit Amazon Leadership Principles and go through each and recall if you have countered a situation either in your past roles or in your current role that depicts the particular leadership skills. The more the better it will lead you closer to Amazon.

– I will recommend choosing good technical experiences if you are applying for technical roles as it will be easy for both candidate and interviewer to probe more and conclude the skill.

AWS Recommendations:-

Our interviews are based on behavioural questions which ask about past situations or challenges you’ve faced and how you handled them, using the Leadership Principles to guide the discussion. We don’t use brain-teasers (e.g., “How many windows are in Manhattan?”) during the interview process. We’ve researched this approach and have found that those types of questions are unreliable when it comes to predicting a candidate’s success at Amazon. Here are some examples of behavioural questions:

  • Tell me about a time when you were faced with a problem that had a number of possible solutions. What was the problem and how did you determine the course of action? What was the outcome of that choice?
  • When have you ever taken a risk, made a mistake or failed? How did you respond and how did you learn from that experience?
  • Describe a time when you took the lead on a project
  • What did you do when you needed to motivate a group of individuals or encourage collaboration during a particular project?
  • How have you leveraged data to develop a strategy?
  • Keep in mind, Amazon is a data-driven company. When you answer questions, you should focus on the question asked, ensure your answer is well-structured and provide examples using metrics or data if applicable. Refer to recent situations whenever possible.

You should bear in mind that your interviewers won’t be evaluating your ability to memorise all the details of each of these topics. They will be analysing your ability to apply what you know and solve problems efficiently and effectively. Given that you sometimes have only limited time to prepare for a technical interview, I will recommend to go through the basic fundamentals with your technological stuffs .It is always recommended to looks for the lasted and most promising technology that are well proven in the technical community or different forums. This will likely yield the best results in the available time.

Other Tips for a smooth Phone interview:

Some teams at Amazon incorporate role-specific exercises or online assessments into the interview process.

  • You will be notified if you are required to take a test.
  • For your phone interview, find a quiet and comfortable place with no distractions.
  • Use a computer with a reliable connection and access to email.
  • If you’re using a mobile phone, make sure you’re in a place with good signal.
  • Have a copy of your CV on hand.
  • Have paper and a pen readily available.
  • Come prepared with questions that you would like to explore in more detail (e.g. on initiatives/projects, the team culture, the scope of the role).
  • If you need clarification on anything or have any additional follow-up questions, reach out to your recruiting point of contact.
  • If you have any special requirements, questions or concerns, please reach out to us as we are committed to making reasonable provisions for all individuals.

Virtual interviews:

If you’ve been asked to do a virtual interview, you will probably need to download Amazon Chime, our video-conferencing tool (the step-by-step guide can be found here). If you’re presenting, you will need to download Chime onto your desktop. The meeting ID# will be emailed to you by your recruitment point of contact. For optimal sound quality, use a headset with a microphone

What to Expect after Phone Screen/Phone Interview?

-Amazon HR will get back to you within two business days after your phone interview. If you haven’t heard from HR by then, feel free to give them a nudge via email.

Outcome:

Next interview scheduling because you definitely cleared Phone Interview. Expect a call or email from HR.
Next Phone Screen Scheduling as First Phone interview was not sufficient enough to collect data about you or due to short of time(sometimes this happens too). Second Interview Procedure is exactly same as the first Phone Interview. Expect a call or email from HR.
Your application is not successful during this time email from HR. You are free to ask for some feedback and HR can provide some over phone maybe.

Once you are eligible for the next interview which is called On-site interview;HR will reach you again for scheduling your interviews and will send you a questionnaire with few questions . Major is Current salary (include base, bonus and equity) and Expected salary (include base, bonus and equity).Do your research and let them know the answers.

You can take your time and reply to HR with your availability. HR will send confirmation email for the interview along with the interviewers name(most of the time). Seeing current COVID-19 scenarios or sometime based on your geographical location or availability of Amazon office near your location you can opt for Video conference/In person visit to nearly Amazon office.This is generally faster else you need to wait for visa if in different country or travel arrangements.Everything is up to your choice and best available method combined.

Personal recommendation:
If you can manage a good internet speed ,do on video conference from home i.e your most comfort zone is best.

If internet speed is not reliable ,approaching nearest Amazon office is best choice.

Last should be the travel option. If job location is nearer , nothing can beat than sharing human to human interaction live.

Structure of Onsite-Interview:
Mostly Five rounds of interview schedule (45-60min each) called Loop.

Manager’s Interview-1
Members from your Team or cross team Interview -3
Bar raiser interview-1

If you are visiting the interview location there will be a lunch buddy assigned to you who will go on a quick lunch between interview with you .

Tips for the interview.

Exactly same tips as for Phone interview but expect yourself for being more patient here and you may need to sit for long hours.
Sometime it takes multiple days for the interview to complete, specially during global vacation time because of less availability of interviewers. In this case 5 interviews may get fragment to 2-3 interviews/day .

Go through Leadership principles
We use our Leadership Principles every day, whether we’re discussing ideas for new projects or finding the most effective solution to a problem. It’s just one of the things that makes Amazon peculiar. All candidates are evaluated based on our Leadership Principles. The best way to prepare for your interview is to think about how you’ve applied the Leadership Principles in your previous professional experience.

Prepare for Behavioural Interviewing
-Our interviews are based on behavioural questions which ask about past situations or challenges you’ve faced and how you handled them, using the Leadership Principles to guide the discussion. We don’t use brain-teasers (e.g., “How many windows are in Manhattan?”) during the interview process. We’ve researched this approach and have found that those types of questions are unreliable when it comes to predicting a candidate’s success at Amazon.

Here are some examples of behavioural questions:

  • Tell me about a time when you were faced with a problem that had a number of possible solutions. What was the problem and how did you determine the course of action? What was the outcome of that choice?
  • When have you ever taken a risk, made a mistake or failed? How did you respond and how did you learn from that experience?
  • Describe a time when you took the lead on a project
  • What did you do when you needed to motivate a group of individuals or encourage collaboration during a particular project?
  • How have you leveraged data to develop a strategy?

Keep in mind, Amazon is a data-driven company. When you answer questions, you should focus on the question asked, ensure your answer is well-structured and provide examples using metrics or data if applicable. Refer to recent situations whenever possible.

Use best proven STAR answering format:

The STAR method is a structured manner of responding to a behavioural interview question by discussing the specific situation, task, action and result of what you’re describing. Here’s what it looks like:

SITUATION

Describe the situation that you were in or the task that you needed to accomplish. Give enough detail for the interviewer to understand the complexities of the situation. This example can be from a previous job, school project, volunteer activity or any relevant event.

TASK

What goal were you working towards?

ACTION

Describe the actions you took to address the situation with an appropriate amount of detail and keep the focus on you. What specific steps did you take? What was your particular contribution? Be careful that you don’t describe what the team or group did when talking about a project. Let us know what you actually did. Use the word “I,” not “we,” when describing actions.

RESULT

Describe the outcome of your actions and don’t be shy about taking credit for your behaviour. What happened? How did the event end? What did you accomplish? What did you learn? Provide examples using metrics or data if applicable.

Consider your own successes and failures in relation to the leadership principles. Have specific examples that showcase your expertise and demonstrate how you’ve taken risks, succeeded, failed and grown over the course of your career. Bear in mind that some of Amazon’s most successful programmes have risen from the ashes of failed projects. Failure is a necessary part of innovation. It’s not optional. We understand that and believe in failing early and iterating until we get it right.

Tips for great answers
Practise using the STAR method to answer the behavioural interview questions listed above and incorporate the Amazon Leadership Principles

Ensure each answer has a beginning, middle and end. Describe the situation or problem, the actions you took and the outcome

Prepare short descriptions of a handful of different situations and be ready to answer follow-up questions in greater detail. Select examples that highlight your unique skills

Give specific examples that showcase your experience and demonstrate that you’ve taken risks, succeeded, failed and grown over the course of your career

Specifics are key: avoid generalisations. Give a detailed account of one situation for each question you answer and use data or metrics to support your example

Be forthcoming and straightforward. Don’t embellish or omit parts of the story.

Personal recommendation for technical Interviewing:

I will recommend to choose good technical experiences if you are applying for technical roles as it will be easy for both candidate and interviewer to probe more and conclude the skill.

e.g for Optical Engineers

-Prepare and revise DWDM fundamentals.
-Network Architecture and designs.
-How to solve problems through Automation skills.You can read more on my article https://mapyourtech.com/automation-in-optical-networkingif-you-are-reading-this-you-can-do-this/

-Read about latest CFPs/QSFPs/ZR etc working and fundamentals.
-Read about best problem solving techniques for issues in Network.
-Read about key performance metrices/indicators that can help you solve a problem in network.
-Read about how to collaborate with other technologies or cross platforms teams/devices to isolate and fix the problems.
-Recording solutions and creating MOP(Method of Procedure/Process) to fix issue in future.
-Think about innovative solutions that can help manage network smoothly.

Tips before you head in
Be prepared to explain what interests you about the role you’re being interviewed for and the team (or teams) you’ll be meeting with

When answering questions, be concise but detailed. We realise it’s hard to gauge how much information is too much versus not enough. An effective test is pausing after your succinct response to ask if you’ve provided enough detail or if the interviewer would like you to go into more depth

Follow-up if you need clarification. If you’re asked a question, but are not given enough information to provide a solid answer, don’t be shy about asking for more information. If additional context is not available, focus on how you would attempt to solve the problem with only limited information

For some roles, we may ask you to complete a writing sample. Why? At Amazon, we don’t use PowerPoint or any other slide-oriented presentations. Instead we write narratively structured memos and silently read one at the beginning of each meeting. These documents generally range from one to six pages and articulate the project goal(s), approach to addressing it, outcome and next steps. Given this unique aspect of our culture and the impact these papers have on what decisions we make as a company, being able to articulate your thoughts in written form is a necessary skill

We aim to hire intelligent, thoughtful and customer-obsessed people. Reflect on what motivated you to pursue a career with Amazon and be prepared to share your thought process. Although “Why Amazon?” is a standard question, it’s not just a formality for us. We genuinely want to understand what inspired you to explore an opportunity with us so we get a better sense of who you are

We try to leave a few minutes at the end of each interview to answer questions you might have, but if we don’t get to all of them, please don’t hesitate to ask your recruitment point of contact.

Interview day
Check-in: arrive 15 minutes early to check in for your interview. Have your government-issued photo ID ready (e.g. driving licence, passport)

Location: detailed instructions will be sent to you via email. Some of our offices are dog-friendly. Let us know if you have any special requirements or allergies

Dress code: comfortable and casual. While safety clothing – such as closed-toed shoes – is required for some positions in our fulfilment centres, most of our office staff wear everyday clothing. We’re interested in what you have to say, not what you’re wearing

What to expect: interviews will be a mixture of questions and discussions concerning your previous experience and the challenges you’ve encountered. Come armed with detailed examples — concise, structured answers are ideal

Interviewers: depending on the role, you will meet with anywhere from two to seven Amazonians. They will likely be a mix of managers, team members, key stakeholders from related teams and a “Bar Raiser” (usually an objective interviewer from another team). All interviewers will assess potential for growth beyond the position you’re being interviewed for and focus on evaluating how well your background and skills meet core competencies, along with how they relate to Amazon’s Leadership Principles. We recommend approaching each of your interviews the same way rather than trying to tailor answers to the interviewer’s role. Interviewers will often be taking notes on their laptops. It’s important that they have precise notes of their time with you to share with other interviewers

CV: interviewers will have a copy, but feel free to bring one as well

Duration: each interview usually lasts from 45 minutes to an hour

Lunch: We will provide lunch if your interview is scheduled during the lunch hour. Let recruitment or your lunch buddy know if you have any dietary preferences

Amazon Non-Disclosure Agreement: All candidates must sign our standard Non-Disclosure Agreement. If you’re unable to print and sign prior to your arrival, we’ll have a copy available for you

Technical roles: If you’re being interviewed for a technical role, be prepared to use a whiteboard

Virtual interviews: If you’ve been asked to do a virtual interview, you will probably need to download Amazon Chime, our video-conferencing tool (step-by-step guide here). If you’re presenting, you will need to download Chime onto your desktop. The meeting ID# will be emailed to you by your recruitment point of contact. For optimal sound quality, use a headset with a microphone.

Before and after the interview
Some teams at Amazon incorporate role-specific exercises or online assessments into the interview process. You will be notified if you are required to take a test

Confirm or book arrangements if your interview requires travel. Your recruiting point of contact will either set up your travel arrangements or put you in touch with our travel agency to help you coordinate travel details and hotel stay.

An expense report should be submitted after your visit. Your recruitment point of contact will provide details on where and how to submit your report. Fill in your form clearly and ensure scanned receipts are legible – this will help prevent reimbursement delays

If you have any special requirements, questions or concerns, please contact us: we are committed to making reasonable provisions for all individuals

After your interview, be on the lookout for a quick post-interview survey via email. It is important for us to know how we did so we can continually improve our interview process. We really value your input

Expect to hear back from recruitment within five business days following your interview. If you don’t, feel free to give us a nudge.

Outcome:

Successful :
Great you have made it. Lot of Amazonians are looking forward to meet you to learn and share the best with you and from you.

Next Time:

Dont worry, you can still apply for different opportunities and its good that you got the first hand experience of interview and next time you can prepare yourself in a better way. Remember that the decision is taken in consideration with multiple parameters like current available candidates skill sets in same role ,current available racks that meets your skill sets, your future growth aspects etc.

Offer

HR will give call to explain the offer.Based on your experience, job level and skill sets there will be an competitive compensation offered to you.There is always a scope for negotiations if the explanations are convincing and agreed between candidate and the HR.

Offer consists of base salary +RSU stocks+joining bonus and other relocation benefits.It is recommended to know your worth and expectation and for that candidate can refer to online websites/different forums etc.

Recommended sites for more exploration:

https://www.levels.fyi/?compare=Amazon,Google,Facebook,Microsoft&track=Software%20Engineer

https://www.glassdoor.com/Interview/Amazon-Interview-Questions-E6036.htm?countryRedirect=true

https://dev.to/fallenstedt/three-steps-i-took-to-get-a-job-offer-from-amazon-1p23

https://www.zippia.com/advice/amazon-interview-questiond/

https://www.quora.com/How-long-does-it-take-Amazon-to-make-a-job-offer

https://fearlesssalarynegotiation.com/amazon-salary-negotiation/

https://6figr.com/in/salary/amazon

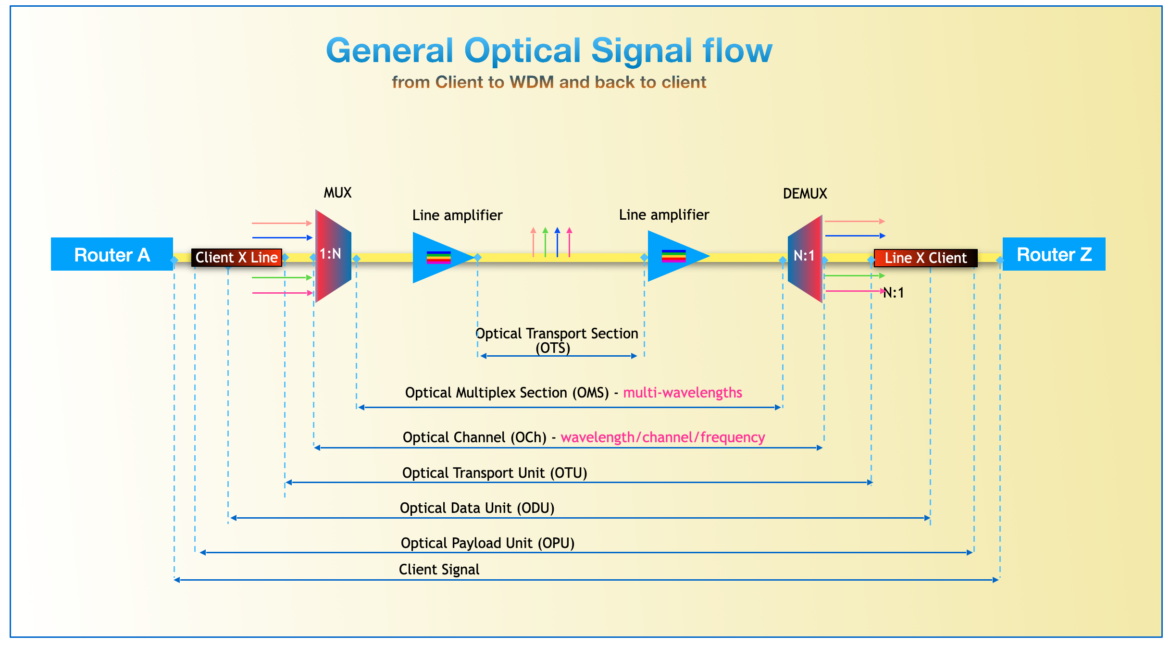
Recently I came across a non-optical background candidate who asked me what are OTU, OCH, ODU, etc in optical. So I came up with this diagram which helped him to understand in the simplest form and hope it will help many others too.

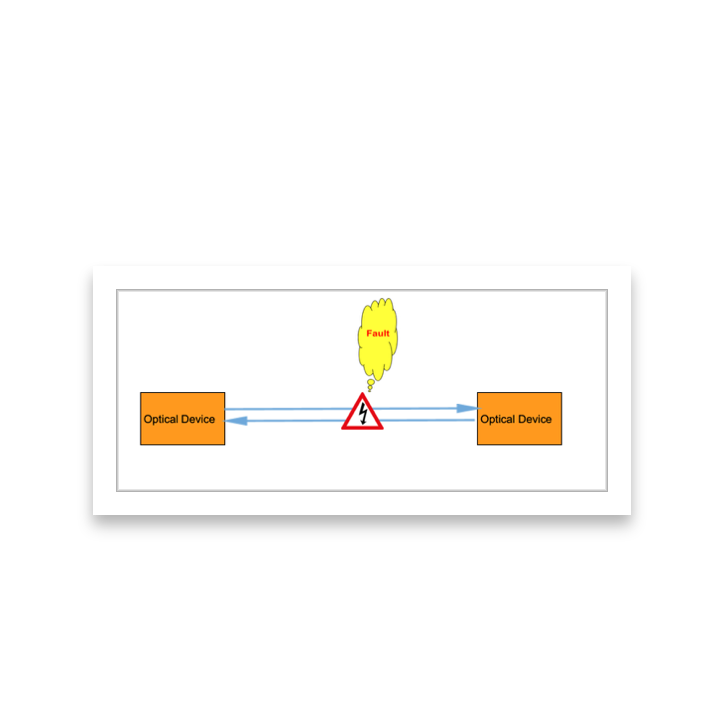
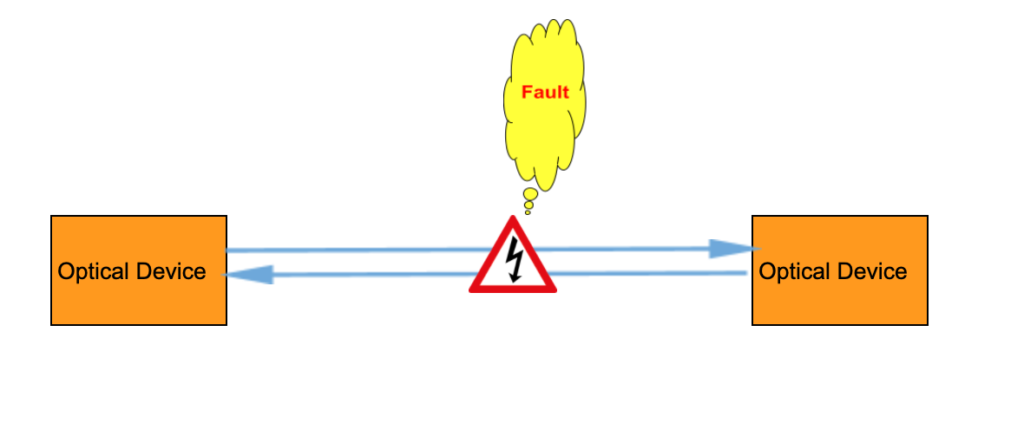
We all know that during troubleshooting we look for detected fault, alarms, or performance parameters on the monitoring points and then correlate with other factors to conclude the root cause. Fault detection is the process of determining that a fault exists. Fault detection capabilities are intended to detect all actual and potential hardware and software troubles so that the impact on service is minimized and consistent with the reliability and service objectives.


Now let’s talk about what we are intended to discuss here.

In accordance with GR-474-CORE,  a time period known as “soak time” is incorporated in the definition of a signal failure to allow for momentary transmission loss e.g from single transient events, and to protect against false alarms.

For transport entities, the soaking interval is entered when a defect event is detected and is exited only if either the defect persists for the soak time interval and a bona fide failure is declared, or normal transmission returns within the soaking time interval.


Also keep in mind that circuits do not use the soak timer, but ports do.

For example, the time period for DS3 signal failure entry/clearing is 2.5 ± 0.5 seconds and 10 ± 0.5 seconds 

(more at  https://mapyourtech.com/entries/general/what-is-the-soak-time-period-to-detect-los-on-a-port-  )

It was always exciting discussing 50ms switching/restoration time perspective for telecom circuits for every engineer who belongs to some part of telecom services including, optical, voice, data, microwave, radio, etc. I was also seeking it since the start of my telecom career, and I believe still somewhere at some point in time, engineers or telecom professionals might be hearing this term and wonder about why (“WHY”) is this? So, I researched over available knowledge pools, and using my experience, I thought of putting it into words to enlighten some of my friends like me.

The 50 ms idea originated from Automatic Protection-based Switching subsystems during early digital transmission systems. It was not actually based on any particular service requirement. The value persists because it is not entirely based on technical considerations which could resolve it, but has roots in historical practices and past capabilities and has been a tool of certain marketing strategies.

Initially, digital transmission systems based on 1:N APS typically required about 20 ms for fault detection10 ms for signaling, and 10 ms for the tail-end transfer relay operationso the specification for APS switching times was reasonably set at 50 ms, allowing a 10 ms margin

For information, early generations of DS1 channel banks (1970s era) also had a Carrier Group Alarm (CGA) threshold of about 230 ms. The CGA is a time threshold for the persistence of any alarm state on the transmission line side (such as loss of signal or frame synch loss) after which all trunk channels would be busied out. But the requirement for 50 ms APS switching stayed in place, mainly because this was still technically quite feasible at no extra cost in the design of APS subsystems. 

The apparent sanctity of 50 ms was further entrenched in the 1990s by vendors who promoted only ring-based transport solutions and found it advantageous to insist on 50 ms as the requirement, effectively precluding distributed mesh restoration alternatives under equal consideration start of the SONET era. 

As a marketing strategy, the 50 ms issue served as the “mesh killer” for the 1990s as more traditional telcos were bought into this as reference.

On the other hand, there was also real urgency in the early 1990s to deploy some kind of fast automated restoration method relatively immediately. This lead to the quick adoption of ring-based solutions which had only incremental development requirements over 1+1 APS transmission systems. However, once rings were deployed, the effect was to only further reinforce the cultural assumption of 50 ms as the standard. Thus, as sometimes happens in engineering, what was initially a performance capability in one specific context (APS switching time) evolved into a perceived requirement in all other contexts.

But the “50 ms requirement” is undergoing serious challenges to its validity as a ubiquitous requirement, even being referred to as the “50 ms myth” by data-centric entrants to the field who see little actual need for such fast restoration from an IP services standpoint. Faster restoration is by itself always desirable as a goal, but restoration goals must be carefully set in light of corresponding costs that may be paid in terms of limiting the available choices of network architecture. In practice, insistence on “50 ms” means 1+1 dedicated APS or UPSR rings (to follow) are almost the only choices left for the operator to consider. But if something more like 200 ms is allowed, the entire scope of efficient shared-mesh architectures becomes available. So it is an issue of real importance as to whether there are any services that truly require 50 ms.

Sosnosky’s original study found no applications that require 50 ms restoration. However, the 50 ms requirement was still being debated in 2001 when Schallenburg, understanding the potential costs involved to his company, undertook a series of experimental trials with varying interruption times and measured various service degradations on voice circuits, SNA, ATM, X.25, SS7, DS1, 56 kb/s data, NTC digital video, SONET OC-12 access services, and OC-48. He tested with controlled-duration outages and found that 200 ms outages would not jeopardize any of these services and that, except for SS7 signaling links, all other services would in fact withstand outages of two to five seconds.

Thus, the supposed requirement for 50 ms restoration seems to be more of a techno-cultural myth than a real requirement—there are quite practical reasons to consider 2 seconds as an alternate goal for network restoration. This avoids the regime of connection and session time-outs and IP/MPLS layer reactions but gives a green light to the full consideration of far more efficient mesh-based survivable architectures.

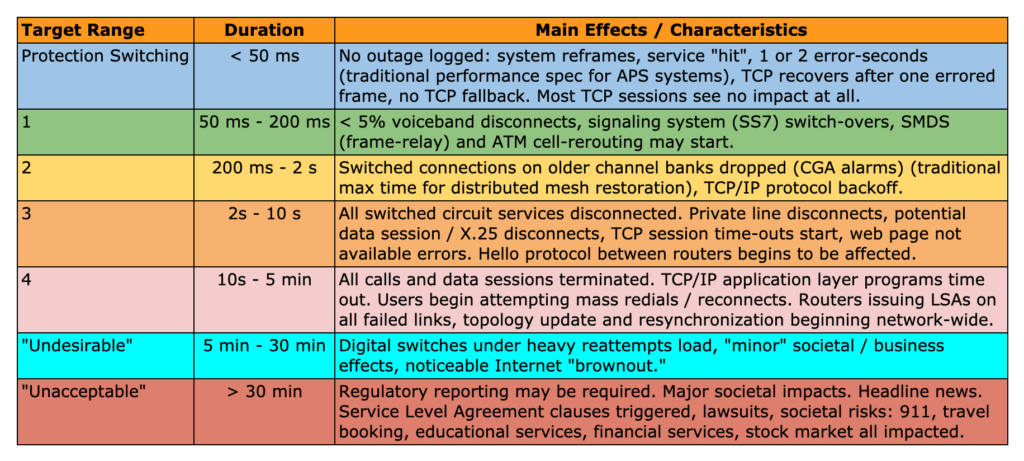
  A study done by Sosnosky provides a summary of effects, based on a detailed technical analysis of various services and signal types. In this study, outages are classified by their duration and it is presented how with the given different outage time, main effects/characteristics change.

50ms


Conclusive Comment


Considering state-of-art technologies evolving overtimes in all aspects of telecommunication fields, switching speed is too fast, even hold-up-timer (HUT) and hold-down-timers or hold-off-timers are playing significant roles that can hold the consequent actions and avoids unavailability of service. Yes, there will definitely be some packet losses in the services which could be visible as some form of errors in the links or may increase latency sometimes but as we know it varies with the nature of services like voice, data, live stream, internet surfing, video buffering, etc. So we can say that in the recent world the networks are quite resistant to brief outages, although it could vary based on the architecture of the network and flow of the services. Even 50ms or 200ms outages would not jeopardize services (data, video, voice) and it will be based on network architecture and routing of services.

Would love to see viewers comment on this and further discussion.

Reference
Mesh-Based Survivable Networks: Options and Strategies for Optical, MPLS, SONET, and ATM Networking By Wayne D. Grover

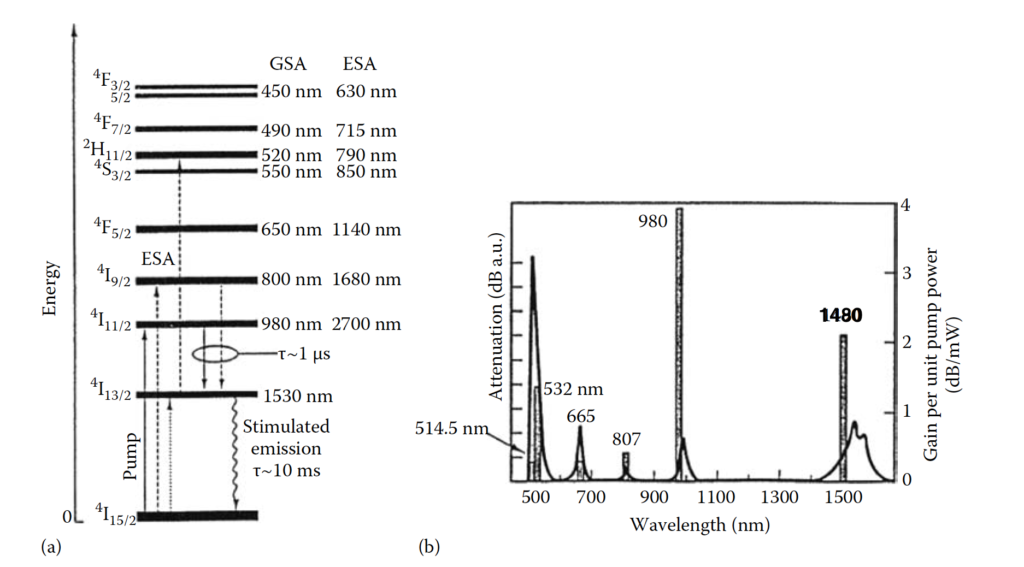
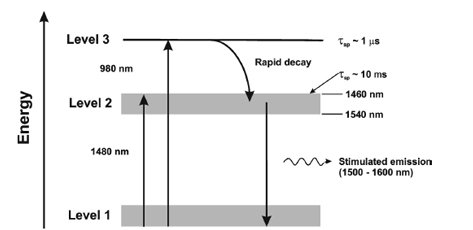
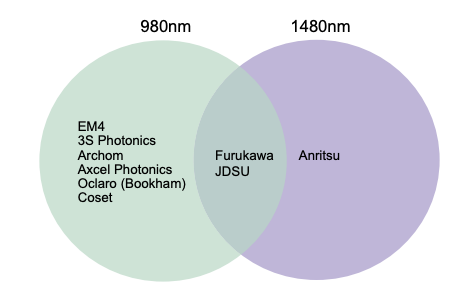
The pump wavelength used is either 980nm or 1480 nm due to the availability of these laser sources.  In the course of the explanation let see the energy level diagrams for the (Erbium) Er3+ ion, the absorption band of Er+, and the pump efficiency.

(a) Energy levels of erbium ions and (b) gain and attenuation spectra.

Excited State Absorption (ESA)

Ground-state absorption (GSA)

There are several states to which the erbium ions can be pumped using sources of different wavelengths, such as those operating at 1480, 980, and 800 nm. However, in practical optical systems, the pump wavelength must provide a high power to achieve a high gain per pump.

The commonly available laser diodes can operate at 800, 980, and 1480 nm, but the pump efficiency can go more than 1 dB/mW with low attenuation depending on the pump frequency.

The only pump wavelength laser sources that can give a high pumping efficiency with lower attenuations are those operating at 980 and 1480 nm.

In practice, the 980 nm pumping source is commonly used due to its high gain coefficient (4 dB/mW). The difference in the effects of these two wavelength sources is mainly caused by the absorption and emission factors.

Bit Error Rate (BER) is a crucial performance metric. DWDM technology enables the transmission of multiple data streams along the same optical fiber by using different wavelengths (or channels) for each data stream, significantly increasing the capacity of the network.

Pre-FEC BER corresponding to Q.

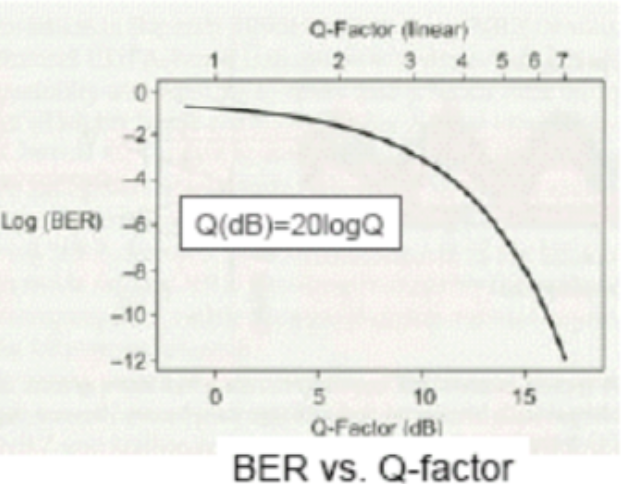
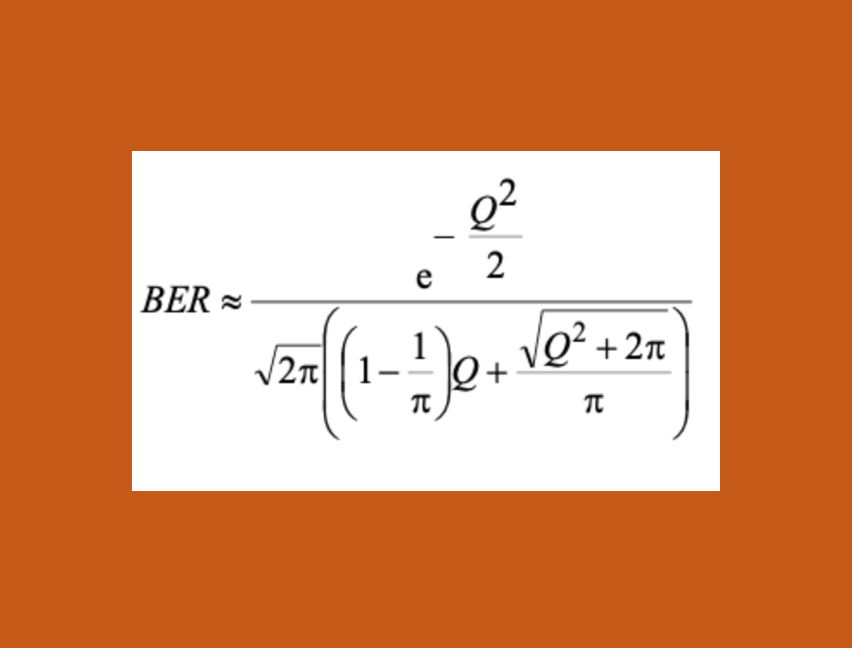
Before applying FEC, which is a method used to detect and correct errors in the transmitted data, the BER can be determined by the Q-factor. The Q-factor, in simple terms, measures the signal strength relative to the noise level in the system, and it’s a dimensionless parameter. The relationship between BER and Q can be mathematically represented and also calculated through the use of functions available in spreadsheet software like Excel. For example, to convert BER to a Q-factor in decibels (dBQ) in Excel, you can use the formula:


dBQ = 20 * LOG10(-NORMSINV(BER))

And to convert the Q-factor to dBQ:


dBQ = 20 * LOG10(Q)

Post-FEC BER/Q

After FEC has been applied, the BER should ideally be reduced to a level where no errors occur, or they are so infrequent that they have virtually no impact on the quality of the communication link. A post-FEC BER of less than 1×10⁻¹⁵ is considered as having no errors, corresponding to a Q-factor of about 18dBQ. This is typically the limit of what can be measured with precision in optical systems.

FEC Limit

FEC limit refers to the threshold below which the FEC can reliably correct errors. If the pre-FEC BER is above this threshold, the FEC will not be able to correct all errors, leading to post-FEC errors. Each FEC scheme has its own limit, defined by the lowest Q-factor it can handle or the highest BER it can correct. For instance:

  • An FEC limit of 8.53dBQ corresponds to a pre-FEC BER of 3.8×10⁻³, which means that the FEC can correct errors down to this level.
  • Similarly, an FEC limit of 5.23dBQ corresponds to a pre-FEC BER of 3.4×10⁻², indicating that the FEC needs at least 97% of the bits to be correct to function effectively.

In designing DWDM systems, understanding these limits is critical to ensure that the link maintains a high level of data integrity and availability. The choice of FEC is a balance between the computational complexity (and therefore power consumption and latency) and the desired link performance in terms of BER. As DWDM systems push towards higher speeds and more closely spaced wavelengths, the FEC becomes increasingly important in maintaining reliable communications.

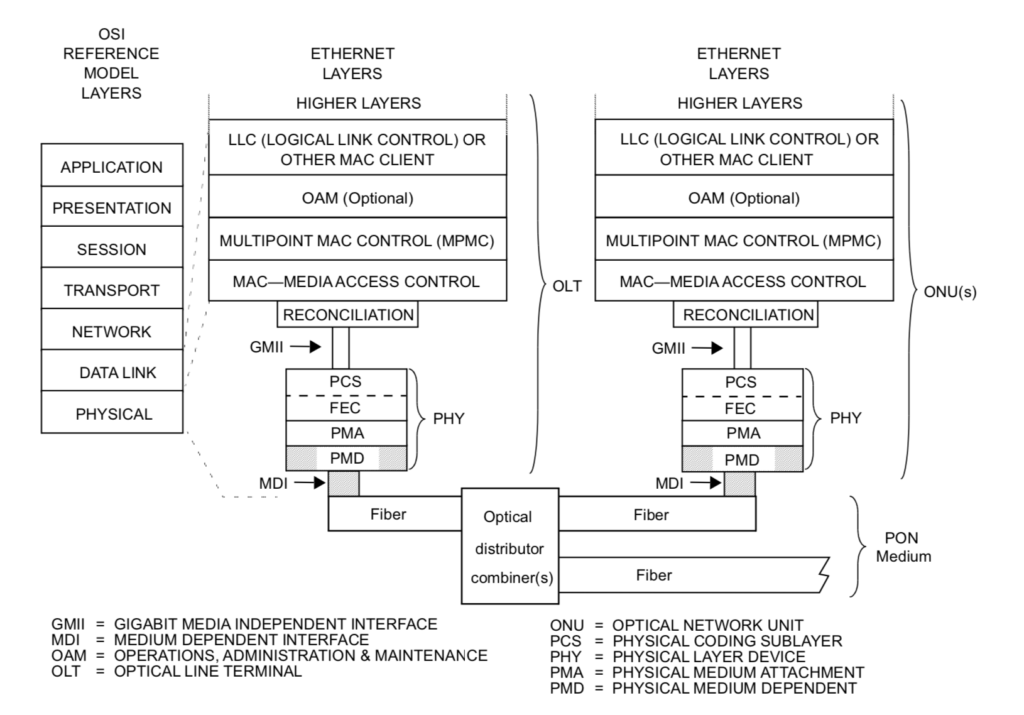
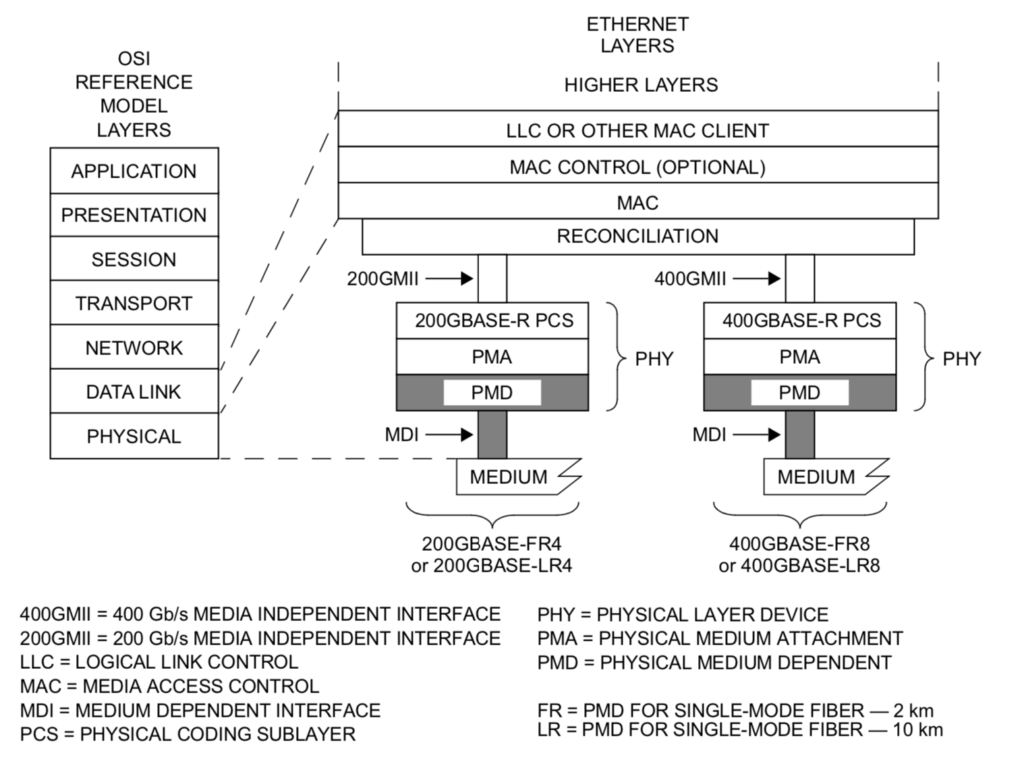
What is PCS ?

The Physical Coding Sublayer (PCS) is a networking protocol sublayer in the  Ethernet standards. This layer resides at the top of the physical layer (PHY) which provides an interface between the Physical Medium Attachment (PMA) sublayer and the media-independent interface (MII). This layer is responsible for coding and decoding data streams flowing to and from the MAC layer , scrambling and descrambling it, block and symbol redistribution, alignment marker insertion and removal, and lane block synchronisation .Currently most of the optical client ports supports PCS lane to enable high data rate .

Where actually PCS layer lies ?


e.g


How to troubleshoot PCS errors issues in Optical Network links?

If you see PCS errors on the interfaces; it may cause the link to flap or you can see errors on the client interfaces of the optical or router ports. PCS block reports signal fail/signal degrade too based on pre-set thresholds.

  • Sometime you may see bit errors or error block in the performance of the interface.Bit errors can also be converted to PCS errors.PCS errors are generally due to physical component degrade or failure  issues like problem in  physical interface mapper, damaged or attenuated fiber, issue on patch panel,ODF or due to faulty or damaged optic pluggables.  The higher rate we go the complexity of the internal mapper/components increases so performance becomes more sensitive to optical path perturberation .
  • PCS errors are also visible on the interfaces if there is some activity involving manual fiber pull ,device reboots ,optics replacement etc.  During link bring-up or bring down or flapping kind of situation, it is expected to see PCS errors increase for a short interval of time; which  is because of the  initial synchronization or skew-deskew process  of the two Ethernet end points. PCS errors are always counted from the incoming direction on the receiving node.
  • The other reasons to see PCS errors could be damaged or bad fiber, faulty optical pluggable (sfp/xfp/cfp etc).
  • Low receive power on the interface can also result in this kind of error so it is always recommended to troubleshoot or investigate on physical fiber as well as physical port on the devices(router/optical client ports).

For PCS lane based modules like SR4,LR4 ,LR10  or multi lane pluggables ,it is recommended to see errors on the lanes of the pluggable. if only few lanes are having issue ,it is better to suspect the connector or the optical XFP/CFP.

Also there is a limit for max difference in receive/transmit power between any two lanes .If the difference is greater than the threshold it may also result in issues.

Max Difference in receive power between any two lanes

100GBASE-LR4  5.5dB
200GBASE-FR4  4.1dB
200GBASE-LR4  4.2dB
400GBASE-FR8  4.1dB
400GBASE-LR8  4.5dB

Max Difference in transmit power between any two lanes

100GBASE-LR4  5dB
200GBASE-FR4  3.6dB
200GBASE-LR4  4 dB
400GBASE-FR8  4dB
400GBASE-LR8  4.5dB

e.g 

Consider the case of using an LR4 CFP for the optical transceiver; each of the 4 wavelengths used on the link will be carrying 5 PCS lanes. In the case of 5 of the PCS lanes being in errors this may indicate the errors being specific to that wavelength and so areas of investigation should include the individual transmitters and receivers within the CFP.

If a 10 lane CFP (SR10 or LR10) is being used then each wavelength (in the case of the LR10) or fibre (in the case of the SR10) would each be carrying two PCS lanes. In this case then if two PCS lanes within the same CAUI lane are found to contain errors or defects then as well as investigating the CAUI the two lanes would also be carried on the same wavelength or fibre. In this case once again  the optical components should be investigated at both ends of the link. In the case of an SR10 based link the multi-fibre cable should also be checked as it may be possible that one of the individual fibres has been damaged within the cable.


CAUI -(Chip to) 100Gb/s Attachment Unit Interface

CFP :Centum Form factor Pluggable

Reference:https://testing100g.net/troubleshooting-100g-links-with-pcs-lanes/


Understanding Optical Return Loss

Optical fiber communication professionals might have heard  about ORL (Optical Return Loss ) during design and operation on an Optical Fiber Network. Intend of this article is to share the information on this topic which could help optical fiber  engineers and professionals understanding the concept and they can utilize this knowledge to understand a network in a better way.

In this article we will discuss

-What is ORL?

-What are the major sources of ORL ?

-What are the implications of ORL?

-How to test and rectify ORL?

-Methods to help improve ORL.

-Standards and references


What is Optical Return Loss (ORL)?

Let me share few definitions so that it will be easy for every stage of engineers ;it could be student, beginner, professional or expert.

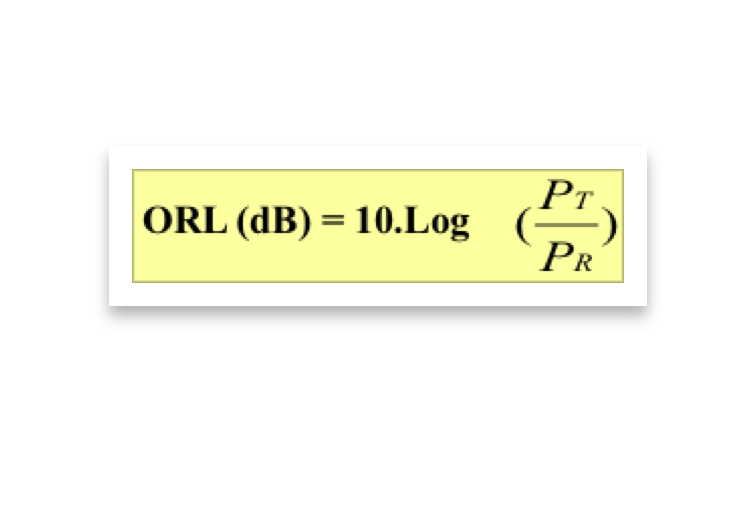
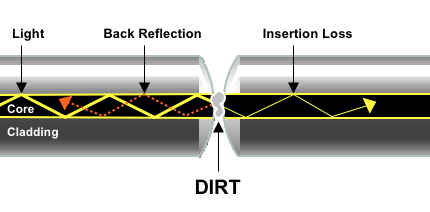
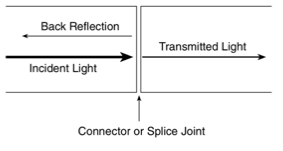
         1).  When light passes through an optical component most of it travels in the intended direction, but some light is reflected or scattered. In many applications these reflections are unwanted, because they can affect the emission characteristics of any laser in the system. In such applications, it is important to measure the reflections for the components of the system. The Return Loss is defined as the light reflected back into the input path. It is caused by scattering and reflection from optical surfaces like mirrors, lenses, and connectors or from defects, such as cracks and scratches. The back-reflection is equal to the return loss with a negative quantity.


          2).  ORL is  defined  as the ratio (in dB) of the optical power (Pinc) traveling downstream at a system interface to the optical power reflected back upstream to the same interface.

This includes the reflected power contributions from all system components downstream from the interface.

 To clarify :

Reflectance (dB) = P reflected (dBm) – P incident(dBm)

A discrete reflection will always be a negative quantity as the reflected power cannot be greater than the incident power.

By convention ORL is defined as:

ORL(dB) = P incident (dBm) – P reflected (dBm)

This means that ORL will always be a positive number.The fact that we want all power to move forward and none to be reflected means that the higher the positive number, the better.

            3).  The reflection factor for a component is a measure of how much light the component reflects. It is a ratio of the power reflected by the device to the power incident on the  device. More normally we talk about the return loss of a component. The return loss has units of dB. Return loss is given by:


Return Loss(dB) = –10log(Reflection Factor) (dB)

ORL(dB) = P incident (dBm) – P reflected (dBm)

               4).  Optical return loss is the ratio of the output power of the light source to the total amount of back-reflected power

(reflections and scattering). It is defined as a positive quantity.


PT: Output power of the light source
PAPC: Back-reflected power of APC connector
PPC: Back-reflected power of PC connector
PBS: Backscattered power of fiber
PR: Total amount of back-reflected power

ORL is measured in dB and is a positive value.Reflectance (dB) is the ratio of reflected power to incident power due to a single interface. It is defined as a negative quantity 

The higher the number, the smaller the reflection – yielding the desired result.

What are the major sources of ORL ?

System components such as

  • connectors,
  • mechanical splices,
  • attenuators,
  • patch cords
  • glass/air terminations

All create a change in index of refraction as seen by an optical signal. The components are reflective in nature and can contribute to system ORL.

The fiber optic cable itself creates backscatter as light propagates through it.  The amount of reflected power due to backscatter cannot be eliminated but is magnitudes smaller than the power from discrete reflections

Sources of loss include reflections and scattering along the fiber network. A typical Return Loss value for an Angled Physical Contact (APC) connector is about -55dB, while the RL from an open flat polish to air is typically about -14dB. High RL is a large concern in high bitrate digital or analog single mode systems and is also an indication of a potential failure point, or compromise, in any optical network.

What are the implications of ORL?

The main effects of back-reflection  due to ORL include the following:

  • Less light is transmitted from the transmitter.
  • Increase in light source interference
  • Increasing the BER in digital transmission systems
  • Multi path distortion can also occur.
  • Reducing the OSNR in  transmission
  • Reflections can distort the optical signal as reflections travel back and forth between reflective components.
  • Strong fluctuations in the laser output power.
  • Increase in transmitter noise.
  • Changes central wavelength and output power.
  • Permanent damage to the laser.

How does reflected power affect laser stability ?

Reflected light can provide unwanted feedback to the laser cavity which will effect:

  • Frequency Modulation Response changes
  • Relative Intensity Noise (RIN)
  • Optical frequency variations
  • Laser line-width variations

Reflection induced degradation increases with system bit-rate !The end result is higher bit error rates (BER)

How to test  ORL?

The measurement of ORL is becoming more important in the characterization of optical networks as the use of wavelength-division multiplexing increases. These systems use lasers that have a lower tolerance for ORL, and introduce elements into the network that are located in close proximity to the laser

The two major test methods:

   Optical Continuous Wave Reflectometry (OCWR)

            A laser source and a power meter, using the same test port, are connected to the fiber under test.

  Optical Time Domain Reflectometry (OTDR)

          The OTDR is able to measure not only the total ORL of the link but also section ORL.

To measure the ORL of a fiber span, an optical continuous wave reflectometer (OCWR) is used. The OCWR is an instrument designed to specifically measure system  and component ORL  reflectance. The OCWR launches a stable, continuous wave signal into the optical fiber and measures the strength of the time-integrated return signal. The ORL meter will return a single negative value which is the total reflectance from all reflective components seen from the point of test.  On fiber spans with multiple reflective components, discrete reflectance values cannot be determined unless component isolation is performed. The measured reflectance value is a directional value so tests should be performed on both ends of a fiber span.

The ORL reference measures background reflection of the fiber under test.  The reference procedure is performed each time a new test setup is required.A mandrel wrap is applied to the fiber test jumper before the point of measurement to isolate and attenuate any reflectance generators. The glass to air interface on the test connector end will be isolated from the OCWR.  The ORL zero function on the OCWR provides storage of the background reflectance level to provide the total optical return loss of the fiber test jumper. Once the mandrel wrap is taken out, the displayed ORL value represents the total ORL of the system from the point of termination.

Typical OTDR report snapshot for reference:-

Methods to help improve ORL are as follows:

  1. Use ultra polish connectors that have low reflectance such as UPC type. APC type connectors have even better reflectance values but are not compatible with other non-APC connectors. Connection to a non-APC connector can damage the APC connector.
  2. Use fusion splices instead of mechanical connectors or mechanical splices where possible.
  3. Re-do fusion splices that are shown to have reflectance. A good fusion splice should have no reflectance.
  4. Install optical isolators at the laser to reduce back reflectance.

Typical Reflectance for few connectors:-

     PC connecters: -30dB to –40 dB

    UPC connectors: -40dB to –50dB

    APC  connectors: -60dB

    Fiber to air interface on a PC connector: -14.7 dB

    Rayleigh backscatter for telecom fiber:  -70 dB/meter

The angle reduces the back-reflection of the connection.

Typical good ORL measurements range from 30-35 dB.


Standards and references

 -Telcordia document GR-1312

R7-79 [361] The discrete reflectance seen from any ONE optical port shall be less than -27 dB.

O7-80 [362] The discrete reflectance seen from any ONE optical port should be less than –40dB.

-Telcordia Document GR-2918

R7-38 [35] The individual channel Optical Return Loss, ORL as defined above, shall be 24dB or more for all wavelengths used in the DWDM system.

All equipment and component manufactures are required to design their systems  to meet reflectance specifications set out by the ITU-T which are adopted by bodies such as Telcordia (formerly Bellcore).Their specifications are intended to minimize system degradation due to reflections and they propose:

1)Enforce reflectance requirements on individual components in a fiber span.

  R7-79 and O7-80 relate to system components.

  Taken from GR-1312, Issue 3, April 1999

  Generic Requirements for OFAs and Proprietary DWDM systems.

2)Ensure system performance to have a tolerance to specified reflection values.

  R7-38[35] relates to system ORL.

  Taken from GR-2918-CORE, Issue 4, December 1999

Note :This article is sourced from multiple informations available on internet and books.

automationAutomation in Optical Networking

If you are reading this you can do this!!!

Google , ChatGPT, Stackoverflow and your little efforts will do it.No worries!!!


This article is not for professional automation engineer but for the enthusiastic professionals who just want to start but  need some guidance to do .


This article is purely  written on the basis of my personal experience through out my career and the intention involved  is to help my friend and folks in understanding the basics and get a glimpse of automation in networking world , so that they can feel motivated and don’t get scared with jargons used for automations.

In my terms:

***Automation is not replacing jobs but enabling you to live life more efficiently and with freedom.It is just an act of kindness by technology to give back to the its users and the creators.***

The scale with which networking communication devices and its usage is  increasing, we need lot of network bandwidth and automation in place to operate, configure, predict  and manage it.Also to have a more robust  ,scalable and reliable network we need agnostic and low latency automations that can help grow the network .

Why automation is needed? Out of 1 million reasons few are as:-

  • It will make your life simpler and cheerful from monotonous and boring pieces of job.
  • It will give you time to think something more creative .
  • It will give you more flexibility as automation can be enabled or operable from remote places.
  • You can spend more time with your loved ones .
  • It can give you sense of security and confidence.
  • It can lead you to be a successful entrepreneurship  .
  • It improves efficiency and reduces errors that can be made by human.

What are the things you can automate? Out of 1 billion reasons few are as:-

  • Everything that you do is sooner or later can be potentially automated.
  • Device logins and configurations can be automated.
  • Metrics polling can be automated to fetch some values from device.
  • Network Management can be customised or scaled.
  • Encryption key rotation can be automated.
  • Capacity monitoring , planning or network design could be automated.
  • Fault Alarming can be automated.
  • Link routing and restoration can be automated.
  • Network self healing and fault remediation could be achieved.
  • Reporting and metrics evaluation could be achieved.
  • Multiple cronjobs could be done and automated.
  • Network discovery could be automated.
  • Regression steps can be automated.
  • On weekends, device/feature runs based testing tasks can be automated.

*This is just an idea that whatever you are doing in your routine job being and network engineer, almost everything can be automated.


Now the most important question:


WHAT YOU NEED TO DO?

*THINK THAT YOU CAN DO IT.


We are blessed to have all the resources that we need to learn and groom ourself at this point of time which are available free of cost. So, even if you don’t know how to start and you have never done or written any automation till now in your career still you can do with just a believe that “YOU CAN DO IT”.


*RECALL THE DAYS WHEN YOU LEARED TO EARNED


WE  all have studied at some point of time from books ,newspapers, magazines ,videos etc and have achieved some benchmark in life.So at this point of time too with just a small efforts you can learn and enhance your skill using few of the greatest tools that are available free of cost which I personally recommend are:-

  • GOOGLE  : The best piece of technology platform  that a human kind have .(will recommend first to search “how to search in google search in a best way”
  • Stackoverflow  : Best spot to shadow programmers and learn new things.
  • w3schools.com  : Online school with playground to play.
  • Booksc  : The heaven for book lovers .free to download.

*ANY LANGUAGE WILL HELP BUT CHOOSE LATEST AND IN DEMAND


Automation  just needs an idea—>Steps to do it ——>ALGORITHM——> and any automation language will do it.


Never think that Automation is something which is so big that you can do it but always look for the simplest thing which you can automate and that’s the best way to start writing any automation.AUTOMATION is collection of SCRIPTS,TOOLS,PACKAGES,LIBRARIES organised in a efficient manner to collaborate and give some user consumable or readable data.

  • AUTOMATION LANGUAGES/TOOLS THAT CAN HELP NETWORK ENGINEERS
  • Python
  • TCL/Perl
  • HTML/JINJA/ANSIBLE
  • JAVA
  • NETCONF/YAML
  • SNMP/TL1/TELEMETRY /CLI
  • LINUX
  • TELNET/SSH
  • FTP/SFTP/WINSCP
  • KIBANA/GRFANA/DATABASE
  • PYCHARM/VISUAL STUDIO/SUBLIME TEXT/NOTEPAD++

Note: Do search in internet the terms if you are not aware so that you can learn more.

Signal to Noise Ration (SNR)  is not an unknown terminology for Engineers and Tech professionals who are dealing with Digital or Analog form of Communication.Here we will  explore the aspect of SNR in Optical Fiber Communication  space known as Optical Signal to Noise Ratio(OSNR).

Warning! Keep patience while scrolling down to read as this article may seem long as this is important topic.Whole content is collected from free available trusted sources and can be downloaded or shared and covers content for everyone from beginner to professional so reader can absorb what he wants.Bingo! Let’s start it.

Some handy definition of OSNR to pick :-

  • OSNR [dB] is the measure of the ratio of signal power to noise power in an optical channel .


  • OSNR is the short form of Optical Signal to Noise Ratio. It is key parameter to estimate performance of Optical Networks. It helps in BER calculation of Optical System.
  • OSNR is important because it suggests a degree of impairment when the optical signal is carried by an optical transmission system that includes optical amplifiers.
  • If we know the OSNR and the bandwidths, we can find Q and the BER
  • It can be seen as the QoS at the physical layer of optical networks. OSNR is directly related to bit-error rate, which will lead to packet losses seen by higher layers.
  • OSNR indirectly reflects BER and can provide a warning of potential BER deterioration.
  • OSNR has long been recognised as a key performance indicator for amplified high-speed transmission networks to ensure network performance and reliability and it is related to many design parameter such as number or repeater/amplifiers ,reach ,available modulation formats etc.
  • OSNR is a metric for the quality assessment of received signals that are corrupted by the  ASE noise of EDFAs  OSNR is defined as the ratio of the average optical signal power to the  average optical noise power  For a single EDFA with the output power Pout and the noise  power NASE, OSNR is computed as

where
NF is the noise figure G is the amplifier gain
hf is the photon energy Δf is the optical measurement bandwidth

When addressing an OSNR value, it is important to define an optical reference bandwidth  for the calculation of OSNR  A bandwidth Δf of 12 5 GHz (or Δλ = 0 1 nm) is the typical  reference bandwidth for calculating OSNR values 

Now let’s explore it in more detail:-

Optical signal-to-noise ratio (OSNR) is used to quantify the degree of optical noise interference on optical signals. It is the ratio of service signal power to noise power within a valid bandwidth.When the signal is amplified by the optical amplifier (OA), like EDFA, its optical signal to noise ratio (OSNR) is reduced, and this is the primary reason to have limited number of OAs in a network.

The OSNR values that matter the most are at the receiver, because a low OSNR value means that the receiver will probably not detect  or recover the signal. The OSNR limit is one of the key parameters that determine how far a wavelength can travel prior to regeneration.

OSNR serves as a benchmark indicator for the assessment of performance of optical transmission systems. DWDM networks need to operate above their OSNR limit to ensure error – free operation. There exists a direct relationship between OSNR and bit error rate (BER), where BER is the ultimate value to measure the quality of a transmission.


The value of OSNRout that is needed to meet the required system BER depends on many factors such as the bit rate, whether and what type of FEC is employed, the magnitude of any crosstalk or non-linear penalties in the DWDM line segments, etc.

Below picture highlights OSNR as one of the important parameter  in a DWDM link.

Optical amplifiers such as erbium-doped fiber amplifiers (EDFAs) are normally employed in optical networks to compensate for the transmission losses over long distances. However, besides providing optical gain, EDFAs also add unwanted amplified spontaneous emission (ASE) noise into the optical signal. Furthermore, the cascading of EDFAs results in accumulation of ASE noise. ASE noise is typically quantified by OSNR and is one of the most important parameters to be monitored in optical networks since the BER is directly related to the signal OSNR Furthermore, it also plays a pivotal role in fault diagnosis and as a measure of general health of links in an optical network.


OSNR may change due to signal power changes or higher repeater noise levels due to aging.

Now lets read the Legacy method to measure it:-


The traditional method to measure OSNR is defined in the IEC 61280-2-9 standard and is known as the interpolation or out-of-band method, as shown in Figure-1 below

OSNR for a Point-to-Point Link

NFstage is the noise figure of the stage, h is Plank’s constant (6.6260 × 10⁻³⁴), ν is the optical frequency 193 THz, and Δf is the bandwidth that measures the NF (it is usually 0.1 nm).


OSNR =158.9+ Pin.dBm −NF−10log(Br )

where

OSNRdB = optical signal to noise ratio of the optical amplifier, dB
Pin.dBm = average amplifier input signal power (DWDM systems use single-channel power), dBm
NF = amplifier noise figure, dB
h = Planck’s constant 6.626069 ◊ 10−34, Js
f = signal center frequency, Hz
Br = optical measurement bandwidth RBW, Hz

If the measurement optical bandwidth can be assumed to be 0.1 nm (12.48 GHz),

OSNR = 58 + Pin.dBm − NF

OSNRF.dB =158.9+Psource.dBm −Γ−NF−10log(Br)−10logN

where

OSNRF.dB = final OSNR seen at the receiver, dB
Psource.dBm = average source signal power into the first span(DWDM systems use single-channel power),dBm NF =amplifier noise figure, the same for all EDFAs, dB

Br = optical measurement bandwidth, Hz
N = number of amplifiers in the fiber link excluding the booster
Γ = span loss, the same for all spans, dB

Above equation provides the actual mathematical calculation of OSNR. This calculation method has quite a few approximations in which we can still find the system OSNR to a great degree of accuracy. In a multichannel WDM system, the design should consider OSNR for the worst channel (the one that has the worst impairment). The worst channel is generally the first or last channel in the spectrum.

we can see that the EDFA gain factor G is not considered. That is because OSNR is a ratio, and the gain acts equally on signal and noise, canceling the gain factor in the numerator and denominator. In other words, although EDFAs alleviate the upper bound on transmission length due to attenuation, by cascading EDFAs in a series, the OSNR is continuously degraded with transmission length and ASE (from EDFAs). This degradation can be lessened somewhat by distributed Raman amplifiers (DRAs).

Addition of Raman and OSNR change:-

As we can see from above equation the factor GRA in the numerator actually enhances the OSNR of the system.(stages) could be considered as EDFA hops here.

OSNR-based design essentially means whether the OSNR at the final stage (at the receiver) is in conformity with the OSNR that is desired to achieve the required BER. This also guarantees the BER requirement that is essential for generating revenue.

Below context is taken from article published by Jean-Sébastien

This method works well for networks up to 10G, without any Reconfigurable Optical Add-Drop Multiplexers (ROADM).

But traditional way of measurement don’t work anymore in High Speed Communications:-

However, IEC 61280-2-9 isn’t feasible for 100G+ signals as well as ROADM networks.

Figure 2 illustrates 100G channels spaced 50GHz apart, which is a common spacing in modern submarine (and terrestrial) networks. Polarization-Multiplexed (Pol-Mux) 100G+ signals are typically wider (require more optical spectrum) than legacy On-Off-Keyed (OOK) 10G signals, meaning they could overlap with neighboring channels. Accordingly, the midpoint between channels no longer consists only of noise, but rather of signal plus noise. Thus, the IEC method applied to 100G+ Pol-Mux signals will therefore lead to an overestimation of noise and inaccurate measurement date leading to incorrect decisions.


Figure 2: IEC 61280-2-9 Method Fails with Dense Pol-Mux 100G+ signals

Figure 3 illustrates a 100G signal that has gone through a ROADM, with the green area showing the channel bandwidth. Given filters inside a ROADM, the noise at the midpoint between channels will be carved (or filtered), leading to an underestimation of the noise level, if the IEC 61280-2-9 method is used, meaning this method is not feasible in ROADM-enabled coherent submarine networks.


Figure 3: IEC 61280-2-9 Method Fails in ROADM 100G+ Pol-Mux Networks

To address the issues described in Figures 2 and 3, in-band OSNR was introduced around 2009 to support OSNR measurements of 10G signals in ROADM networks and 40G OOK signals. However, this method can’t be applied to coherent, Pol-Mux 100G+ signals, because of technical reasons beyond the scope of this blog. Consequently, Pol-Mux OSNR techniques have been introduced to support 100G+ signals, which is the topic of the latest standards.

Appropriate standards for Pol-Mux OSNR measurements?

There are two standards providing relevant guidelines for OSNR measurements of Pol-Mux signals. They are the China Communications Standards Association (CCSA) YD/T 2147-2010 standard and the IEC 61282-12 standards, which was recently introduced in February 2016. Both standards provide a future-proof definition of OSNR, which can be applied to any type of signal, at any data rate, including super-channels and flexible-grid signals. Specifically, the IEC-61282-12 standard specifies that:

where:

  • s(λ) is the time-averaged signal spectral power density, not including ASE, expressed in W/nm
  • ρ(λ) is the ASE spectral power density, independent of polarization, expressed in W/nm
  • Br is the reference bandwidth expressed in nm (usually 0.1nm if not otherwise stated)
  • and the integration range in nm from λ1to λ2is chosen to include the total signal spectrum

The only drawback of these two standards is that a careful application of their formulae requires turning off channels, to access the Amplified Spontaneous Emission (ASE) noise floor, which isn’t possible on an in-service lest we upset end-users! Fortunately, in-service Pol-Mux OSNR methods have been introduced.

below table summarizes the correct OSNR method for each type of signal.


Data Rate ROADM Present? OSNR Method Works on in-service network?
≤10G signals No IEC 61280-2-9 Yes
≤10G signals Yes In-band OSNR Yes
Non-coherent 40G signals Yes or No In-band OSNR Yes
Coherent 100G+ signals Yes or No Pol-Mux OSNR (IEC and CCSA standards) No
Coherent 100G+ Signals Yes or No In-Service Pol-Mux OSNR Yes

Table 1: OSNR Measurement Methods for Various Signal Types

Using the wrong OSNR measurement method for a given signal can have a significant impact on results, as it can lead to errors ranging from a few dBs up to 10dB, potentially leading to future outages. Using the proper method guarantees the right OSNR measurements are achieved leading to accurate network modeling, link simulation, and maintenance of ongoing submarine cable network performance.

Summarizing the importance of OSNR and its proper measurement method?

Some of the benefits of OSNR testing, including avoiding network outages, optimizing troubleshooting times, and ensuring optimal terrestrial and submarine cable performance. OSNR will become even more critical at data rates beyond 100G, because of the more stringent OSNR thresholds that will be required. Several OSNR methods have been introduced over the years, so the key takeaway is that the right OSNR measurement method must be used on a specific signal type to get accurate results.

Introduction to OSNR for high speed communication

The OSNR is the signal-to-noise ratio (SNR) measured in a reference optical bandwidth, where frequently a bandwidth Bref of 12.5 GHz is used corresponding to 0.1 nm wavelength. The OSNR relates to the Es ∕N0 and Eb ∕N0 as

where Bref is the previously introduced reference bandwidth, RS corresponds to the symbol rate of the transmission, r is the mentioned rate of the code with r = k∕n, and q corresponds to the number of bits mapped to each modulation symbol.

The use of high-order modulation formats requires a higher optical signal-to-noise ratio (OSNR), which may result in a significantly reduced achievable transmission distance .Following diagram shows the OSNR estimation stage for High Speed Optical Communication.


Lets talk about OSNR Penalty now:-

OSNR penalty is obtained from the BER curves and determined at a particular BER. A value of the OSNR penalty is obtained by comparing the values of OSNR before and after  the change of the parameters, which are under test, as given by

Gripple = penalty due to DWDM amplifier gain ripples
OSNRpenalties = various transmission penalties due to CD, PMD, PDL, etc. (note these penalties maybe different for 100G vs. 400G)

Calculation of Q-Factor from OSNR

The OSNR is the most important parameter that is associated with a given optical signal. It is a measurable (practical) quantity for a given network, and it can be calculated from the given system parameters. The following sections show you how to calculate OSNR. This section discusses the relationship of OSNR to the Q-factor.

The logarithmic value of Q (in dB) is related to the OSNR

In the equation, B0 is the optical bandwidth of the end device (photodetector) and Bc is the electrical bandwidth of the receiver filter.

Q is somewhat proportional to the OSNR

BER FORMULAS FOR THE MOST COMMON QAM SYSTEMS

Gray coding is assumed for all formats. For PM-BPSK the exact formula is:

For PM-QPSK the exact formula is:

For PM-16QAM and PM-64QAM, respectively, the following formulas are approximate, but their accuracy is better than ±0.05 dB of OSNRNL over the range 10−1 and 10−4:


EDFA Noise – Why Input Power Matters

Optical signal suffers more than only attenuation. In amplitude, spectrally, temporally signal interaction with light- matter, light- light, light-matter-light leads to other signal disturbances

such as :-

  •  Power reduction
  •  Dispersion
  •  Polarization
  • Unbalanced amplification

Thus leading to random noise, which causes misalignments, jitter and other disturbances resulting in erroneous bits, the rate of which is known as bit-error-rate

Because of all possible influences outlined bits transmitted by source and bits arriving at the receiver may not have the same value. In actuality a threshold value is set at the receiver, above the threshold refers to a logic “one” and below threshold refers to a logic “zero”.

In order to measure BER in photonic regime, the optical signal is converted to electrical signal.

Example: Assuming a confidence level of 99%, BER threshold set at 10-10 and a bit rate of 2.5 Gb/s the required number n is 6.64 x 10¹⁰

Given the OSNR, the empirical formula to calculate BER for single fiber is

Log10 (BER) = 10.7-1.45 (OSNR)

Some mathematical aspects of OSNR:-

Assume that OSNR = 14.5 dB
ThenLog10 (BER) = 10.7-1.45 (14.5) = -10.30

Therefore BER = 10(-10.30) BER is approx 10- 10

In an experimental environment where factors such as loss, dispersion, and non-linear effects are excluded, if the OSNR is less than the specified threshold, the pre-FEC BER will be excessively large and uncorrectable bit errors will be generated. The OSNR  threshold in this case is called B2B OSNR tolerance.


Calculating OSNR from OSA:

As can be seen from the definitions above, two quantities must be known to compute OSNR: the Total Signal Power, and the amount of ASE Noise Power present in a 0.1nm bandwidth.

Measuring the ASE power:

When the ASE noise floor is clearly visible left and right of the optical signal, the ASE Noise Power at the signal wavelength can be interpolated from two measurements made left and right of the signal.


Alternately, when the noise floor is not visible left and right, the optical signal needs to be removed temporarily in order to allow the measurement of the ASE Noise Power at the signal wavelength.

▪ This is the case when some filtering devices implemented somewhere in line are removing some of the noise between channels (Example = WSS).

▪ This could also be the case if the modulated signal bandwidth is so large so that the tail of adjacent signals overlaps the open space between them – masking the noise floor.


Note that power values are frequently provided in dBm by the OSA – whether the measurements is made using integrated power function or a user-specified resolution bandwidth.  To convert the values in dBm to mW, the following relation must be used:

Measuring the Total Signal Power:

When making this measurement it is important to use a bandwidth that is large enough to capture the entire signal:

▪ If using an OSA with variable resolution bandwidth, this means that the resolution bandwidth has to be set larger than the width of the signal.

▪ If using a integrated- power function between vertical markers, the markers have to be set to include the entire signal bandwidth.

Note that when measuring a DWDM spectrum, the power of each DWDM signal cannot be measured independent of ASE noise present in the measurement bandwidth.

Ie., the value that is actually measured is: Total Signal Power + ASE Noise Power.

To get the Total Signal Power only, the ASE noise content (measured separately in the previous step) must be subtracted from the measurement. Since the measurement bandwidth used to measure the noise on its own (ASE BW) may be different from the bandwidth used to measure the signal (Signal BW), a factor is added to the equation.  This removes the correct amount of noise from the measurement.

where:
Signal BW is the bandwidth used to measured the signal,
ASE BW is the bandwidth used to measure the ASE Noise Power only (e.g., 0.1nm).

Calculating OSNR from measurements:

Since OSNR must be reported as signal power with respect to 0.1nm worth of ASE noise, the denominator of the OSNR equation also includes a factor.  This adjusts the amount of ASE noise measured to an amount expected inside a 0.1nm bandwidth:

Thus
In a transmission chain, the relative evolution of the optical signal and noise levels is usually characterized by the optical signal-to-noise ratio (OSNR). The OSNR, in a given optical bandwidth, is defined as


The optical signal may be polarized, but the noise is usually not and, depending on the receiver polarization sensitivity, the noise must be considered with a single or two polarizations. Any active (or passive) linear optical device amplifies (or attenuates) simultaneously the incoming signal and the incoming noise

Accordingly with the fluctuation dissipation theorem, it also adds noise, making its output OSNR lower than its input one. This OSNR degradation is expressed in terms of noise factor (NF) defined as:

where G is the optical power gain (or the attenuation coefficient) of the device which is larger (or smaller) than 1. NF is denoted noise figure when it is expressed in dB. Because the relative importance of the added noise strongly depends on the input noise level, NF is only an intrinsic parameter of the optical device (i.e. independent of the input signal and noise) when an input reference noise is defined.

For polarization insensitive devices, input noise and output noise usually do depend on polarization, making noise figure independent of polarization considerations.

Single amplifier noise factor

OSNR at the output of an optical amplifier with an output power Pout and for an optical bandwidth B0 is expressed as:

where m=1 or 2 is the number of polarization modes contributing to noise. It is usual to consider the two polarization modes (m=2) of the noise and to make reference to an optical bandwidth equal to 0.1 nm corresponding to Bo = 12.5GHz at a wavelength of 1550 nm. In this particular situation, the OSNR is expressed in dB as:

NFdB, Noise factor of a cascade of fibers and amplifiers

Let us consider now the cascade of spans displayed in Figure  and including Namp optical fiber spans with an attenuation coefficient A and Namp  lumped linear phase insensitive amplifiers with a gain net G and a noise factor NF. For each span a near compensation of the signal attenuation by the gain is assumed, making its net gain GSPAN 5 GA close to 1. Each fiber reduces the sig- nal level and reduces the noise level nearly in the same way. Since the input noise level is far above the appropriated reference level, the attenuation noise of the fiber is negligible and the OSNR is kept nearly unchanged. Each amplifier output POUT restores the input noise of the link but adds the amplifier noise.

The accumulated noise is Namp times larger than single amplifier and we have:

To bridge transoceanic distances while keeping a high OSNR (optical SNR), it is crucial to limit the noise contribution added by the successive amplifiers. The impact of the added noise on the output OSNR can be calculated with:

This equation can also be expressed in a more physical manner:

where N is the amplifier count, and Δλ the width of the filter where the OSNR is expressed. The number “30” at the end of Equation corresponds to the conversion of signal input power from units in watts into units scaled in milliwatts.

Few Key Concepts to remember

The OSNR values that matter the most are at the receiver, because a low OSNR value means that the receiver will probably not detect or recover the signal.

The OSNR limit is one of the key parameters that determine how far a wavelength can travel prior to regeneration.

OSNR serves as a benchmark indicator for the assessment of performance of optical transmission systems. DWDM networks need to operate above their OSNR limit to ensure error – free operation.

There exists a direct relationship between OSNR and bit error rate (BER), where BER is the ultimate value to measure the quality of a transmission. Given the OSNR, the empirical formula to calculate BER for single fiber is:

Log10 (BER) = 10.7-1.45 (OSNR)

In DWDM links a rule of thumb would be to target an OSNR value greater than 15 dB to 18 dB at the receiver.

OSNR requirements depend on:

  • Location: The required OSNR will be different for different locations in the light path. The OSNR requirement will be higher closer to the transmitter and lower closer to the receiver. This is because optical amplifiers and reconfigurable add/drop modules (ROADMs) add noise, which means that the OSNR value degrades after going through each optical amplifier or ROADM. To ensure that the OSNR value is high enough for proper detection at the receiver, the number of optical amplifiers and ROADMs needs to be considered when designing a network.
  • Type of Network: For a metro network, an OSNR value of >40 dB at the transmitter might be perfectly acceptable, because there are not many amps between the transmitter and the receiver.For a submarine network, the OSNR requirements at the transmitter are much higher.
                • Data Rate: With the increase in the data rate for a specific modulation format, the OSNR requirement also increases.
                • Target BER: A lower target BER calls for a higher OSNR value.

The exact requirements at the receiver will vary from one manufacturer to another. Table  displays a few average OSNR figures to guarantee a BER lower than 10-8 at the receiver

Note: Now try to utilise the above concepts and equations whatever way you want .

The maximum data rate (maximum channel capacity) that can be transmitted error-free over a communications channel with a specified bandwidth and noise can be determined by the Shannon theorem. This is a theoretical maximum data transmission rate for all possible multilevel and multiphase encoding techniques.

As can be seen below that the maximum rate depends only on channel bandwidth and the ratio between signal power to noise power. There is no dependence on modulation method.

Rmax =Bolog2(OSNR+1)

where

    Rmax maximum data rate for the channel (also known as channel capacity), Gbps

    Boptical channel passband, GHz

    OSNR channel optical signal to noise ratio

Example:-

For a 62 GHz channel passband (for standard 200 GHz DWDM channel spacing) and an OSNR of 126 (21 dB) the maximum possible channel capacity is 433 Gbps.

As channel bandwidth decreases so does maximum transmission rate. For a 30 GHz channel passband (100 GHz DWDM channel spacing) and OSNR of 126 (21 dB) the maximum possible channel capacity is 216 Gbps.

The Bit Error Rate (BER) of a digital optical receiver indicates the probability of an incorrect bit identification. In other words, the BER is the ratio of bits received in error to the total number of bits received. Below lists different values for BER and their corresponding errors per bits and over time.
As we know that, the photocurrent is converted to a voltage then measured. The measurement procedure involves a decision as to whether the bit received is a 1 or a 0. The BER is a not only a function of the noise in the receiver and distortion in the system, but also on the decision level voltage,VD that is the threshold level above which the signal is classified as a 1 and below which the signal is classified as a 0. Even an ideal signal with no noise nor distortions has a non-zero BER if the decision level is set too high or too low. For example, if VD is set above the voltage of the 1 bit, the BER is 0.5, assuming equal probability of receiving a one and a zero.


BER

Error per 10E-15 bits

@ 10Gbps, One error in

1×10⁻⁶

10,00,00,000

0.1 msec

1×10⁻⁹

1,00,000

0.1 sec

1×10-12

100

1.7 min

1×10-15

1

1.2 days

Mathematically, the Bit Error Rate is expressed as

BER = p(1)P(0 ⁄ 1) + p(0)P(1 ⁄ 0)

where p(1) and p(0) are the probabilities of receiving a 1 and a 0, respectively. P(0/1) is the probability of deciding a 0 when the bit is actually a 1, and P(1/0) is the probability of deciding a 1 when the bit is a 0.

The mathematical relations to BER for non-FEC operation when the threshold is set to the optimum value are:

where:

A commonly used approximation for this function is:­­­

An alternative expression that gives accurate answers over the whole range of Q is expressed as:


Minimum BER as a function of Q  where both formulas are compared.

BER to Q relation


e.g:  BER of 10–12, is Q » 7.03.

Transponder bandwidth is the product of Modulation , Baud Rate and the Polarisation.

BW=Modulation x Baud x Polarisation

Following table will give an idea for various bit rates:-

Ex:

Modulation = 2 (bits/s/Hz)

Baud Rate = 32G

Polarisation= 2

BW= 2 x 32 x 2 =128Gbps

The 980nm pump needs three energy level for radiation while 1480nm pumps can excite the ions directly to the metastable level .


(a) Energy level scheme of ground and first two excited states of Er ions in a silica matrix. The sublevel splitting and the lengths of arrows representing absorption and emission transitions are not drawn to scale. In the case of the 4 I11/2 state, s is the lifetime for nonradiative decay to the I13/2 first excited state and ssp is the spontaneous lifetime of the 4 I13/2 first excited state. (b) Absorption coefficient, a, and emission coefficient, g*, spectra for a typical aluminum co-doped EDF.

.The most important feature of the level scheme is that the transition energy between the I15/2 ground state and the I13/2 first excited state corresponds to photon wavelengths (approximately 1530 to 1560 nm) for which the attenuation in silica fibers is lowest. Amplification is achieved by creating an inversion by pumping atoms into the first excited state, typically using either 980 nm or 1480 nm diode lasers. Because of the superior noise figure they provide and their superior wall plug efficiency, most EDFAs are built using 980 nm pump diodes. 1480 nm pump diodes are still often used in L-band EDFAs although here, too, 980 nm pumps are becoming more widely used.

Though pumping with 1480 nm is used and has an optical power conversion efficiency which is higher than that for 980 nm pumping, the latter is preferred because of the following advantages it has over 1480 nm pumping.

  • It provides a wider separation between the laser wavelength and pump wavelength.
  • 980 nm pumping gives less noise than 1480nm.
  • Unlike 1480 nm pumping, 980 nm pumping cannot stimulate back transition to the ground state.
  • 980 nm pumping also gives a higher signal gain, the maximum gain coefficient being 11 dB/mW against 6.3 dB/mW for the 1.48
  • The reason for better performance of 980 nm pumping over the 1.48 m pumping is related to the fact that the former has a narrower absorption spectrum.
  • The inversion factor almost becomes 1 in case of 980 nm pumping whereas for 1480 nm pumping the best one gets is about 1.6.
  • Quantum mechanics puts a lower limit of 3 dB to the optical noise figure at high optical gain. 980 nm pimping provides a value of 3.1 dB, close to the quantum limit whereas 1.48  pumping gives a value of 4.2 dB.
  • 1480nm pump needs more electrical power compare to 980nm.

Application

The 980 nm pumps EDFA’s are widely used in terrestrial systems while 1480nm pumps are used as Remote Optically Pumped Amplifiers (ROPA) in subsea links where it is difficult to put amplifiers.For submarine systems, remote pumping can be used in order not to have to electrically feed the amplifiers and remove electronic parts.Nowadays ,this is used in pumping up to 200km.

The erbium-doped fiber can be activated by a pump wavelength of 980 or 1480 nm but only the second one is used in repeaterless systems due to the lower fiber loss at 1.48 mm with respect to the loss at 0.98 mm. This allows the distance between the terminal and the remote amplifier to be increased.

In a typical configuration, the ROPA is comprised of a simple short length of erbium doped fiber in the transmission line placed a few tens of kilometers before a shore terminal or a conventional in-line EDFA. The remote EDF is backward pumped by a 1480 nm laser, from the terminal or in-line EDFA, thus providing signal gain

Vendors

Following are the vendors that manufactures 980nm and 1480nm EDFAs

Compared with requirements for EDFAs for terrestrial applications and for Submarine applications, there are major important differences making the two types of amplifiers definitely two different components.


Terrestrial(Land) system Submarine System
•Reliability of land-based equipment is somewhat relaxed, corresponding to a 15-year required lifetime. • Submarine systems are designed for a 25-year lifetime and a minimum of ship repair that imply reliability and redundancy of all the critical components.
• Terrestrial equipment should enable operation over a wide temperature range of −5, +70°C (and −40, +85°C in storage conditions).


This wide temperature range makes it necessary to implement cooling means for the           highest temperatures and compensation means for temperature-sensitive devices.

• In submarine amplifiers, heat is dissipated from the outer side of the repeater container into the sea. Such a container is designed in order to make the heat go through the box from the pump device to the outer side, ensuring moderate temperature in all points. Temperature of the deep sea is indeed around +5°C. Specific care is taken for repeaters located at the coast or in shallow water, in order to guarantee no pump failure while avoiding Peltier cooling.

For reliability reasons, no glue is used on the optical path. The constant temperature of the devices and the doped fiber incorporated in the amplifier makes it possible to perfectly tailor the gain spectrum of the submerged EDFAs, owing to very accurate equalizing filters and to concatenating hundreds of amplifiers.

This would not be possible for land-based amplifiers whose gain cannot be guaranteed below 1 dB for a 30-nm bandwidth partly due to such temperature changes (while a few tenths of dB of gain excursion is reached for submarine amplifiers).

• The infrastructure itself of terrestrial systems determines the actual characteristics of the amplifier that needs to cope with important variations of the span loss between two amplifier sites. In addition, for economical reasons, the amplifiers cannot be tailored to cope with this nonuniform link. • In submarine systems, the link is manufactured at the same time as the amplifiers and much attention is paid to guarantee constant attenuation loss between amplifier values, while the amplifier has been designed to perfectly adapt to the link characteristics.


• There are high gain range (20 to 35 dB) of the amplifiers incorporated in land-based systems and allowed by the margins given on the OSNR due to the reduced total link length.

Gain equalizers therefore compensate for much larger gain excursion values than in submarine amplifiers and should therefore be located at amplifier midstage in order not to impact their equalizing loss on the amplifier output power.

• On the contrary, such filters can be placed after the single section of doped fiber that composes the amplifier in the case of submarine applications.


Background Information

  1. The Raman amplifier is typically much more costly and has less gain than an Erbium Doped Fiber Amplifier (EDFA) amplifier. Therefore it is used only for speciality applications.
  2. The main advantage that this amplifier has over the EDFA is that it generates very less noise and hence does not degrade span Optical to Signal Noise Ratio (OSNR) as much as the EDFA.
  3. Its typical application is in EDFA spans where additional gain is required but the OSNR limit has been reached.
  4. Adding a Raman amplifier might not significantly affect OSNR, but can provide up to a 20dB signal gain.
  5. Another key attribute is the potential to amplify any fiber band, not just the C band as is the case for the EDFA. This allows for Raman amplifiers to boost signals in O, E, and S bands (for Coarse Wavelength Division Multiplexing (CWDM) amplification application).
  6. The amplifier works on the principle of Stimulated Raman Scattering (SRS), which is a nonlinear effect.
  7. It consists of a high-power pump laser and fiber coupler (optical circulator).
  8. The amplification medium is the span fiber in a Distributed Type Raman Amplifier (DRA).
  9. Distributed Feedback (DFB) laser is a narrow spectral bandwidth which is used as a safety mechanism for Raman Card. DFB sends pulse to check any back reflection that exists in the length of fiber. If no High Back Reflection (HBR) is found, Raman starts to transmit.
  10. Generally HBR is checked in initial few kilometers of fibers to first 20 Km. If HBR is detected, Raman will not work. Some fiber activity is needed after you find the problem area via OTDR.

Common Types of Raman Amplifiers

  • The lumped or discrete type Raman amplifier internally contains a sufficiently long spool of fiber where the signal amplification occurs.
  • The DRA pump laser is connected to the fiber span in either a counter pump (reverse pump) or a co-pump (forward pump) or configuration.
  • The counter pump configuration is typically preferred since it does not result in excessively high signal powers at the start of the fiber span, which can result in nonlinear distortions as shown in the image.

The advantage of the co-pump configurations is that it produces less noise.

Principle

As the pump laser photons propagate in the fiber, they collide and are absorbed by fiber molecules or atoms. This excites the molecules or atoms to higher energy levels. The higher energy levels are not stable states so they quickly decay to lower intermediate energy levels that release energy as photons in any direction at lower frequencies. This is known as spontaneous Raman scattering or Stokes scattering and contributes to noise in the fiber.

Since the molecules decay to an intermediate energy vibration level, the change in energy is less than the initial received energy at the time of molecule excitation. This change in energy from excited level to intermediate level determines the photon frequency since Δ f = Δ E / h. This is referred to as the Stokes frequency shift and determines the Raman gain versus frequency curve shape and location. The energy that remains from the intermediate level to ground level is dissipated as molecular vibrations (phonons) in the fiber. Since there exists a wide range of higher energy levels, the gain curve has a broad spectral width of approximately 30 THz.

At the time of the stimulated Raman scattering, signal photons co-propagate frequency gains curve spectrum, and acquires energy from the Stokes wave, that results in signal amplification.

Theory of Raman Gain

The Raman gain curve’s FWHM width is about 6THz (48 nm) with a peak at about 13.2THz under the pump frequency. This is the useful signal amplification spectrum. Therefore, in order to amplify a signal in the 1550 nm range the pump laser frequency is required to be 13.2THz below the signal frequency at about 1452 nm.


Multiple pump lasers with side-by-side gain curves are used to widen the total Raman gain curve.

Where fp = pump frequency, THz  fs = signal frequency, THz Δ f v = Raman Stokes frequency shift, THz.

Raman gain is the net signal gain distributed over the fiber’s effective length. It is a function of pump laser power, fiber effective length, and fiber area.

For fibers with a small effective area, such as in dispersion compensation fiber, Raman gain is higher. Gain is also dependent on the signal separation from the laser pump wavelength, Raman signal gain is also specified and field measured as on/off gain. This is defined as the ratio of the output signal power with the pump laser on and off. In most cases the Raman ASE noise has little effect on the measured signal value with the pump laser on. However, if there is considerable noise, which can be experienced when the measurement spectral width is large, then the noise power measured with the signal off  is subtracted from the pump on signal power in order to obtain an accurate on/off gain value. The Raman on/off gain is often referred to as the Raman gain.

Noise Sources

Noise created in a DRA span consists:

  • Amplified Spontaneous Emissions (ASE)
  • Double Rayleigh Scattering (DRS)
  • Pump Laser Noise

ASE noise is due to photon generation by spontaneous Raman scattering.

DRS noise occurs when twice reflected signal power due to Rayleigh scattering is amplified and interferes with the original signal as crosstalk noise.

The strongest reflections occur from connectors and bad splices.

Typically DRS noise is less than ASE noise, but for multiple Raman spans it can add up. In order to reduce this interference, Ultra Polish Connectors (UPC) or Angle Polish Connectors (APC) can be used. Optical isolators can be installed after the laser diodes in orer to reduce reflections into the laser. Also, span OTDR traces can help locate high-reflective events for repair.

Counter pump DRA configuration results in better OSNR performance for signal gains of 15 dB and greater. Pump laser noise is less of a concern because it usually is quite low with RIN of better than 160 dB/Hz.

Nonlinear Kerr effects can also contribute to noise due to the high laser pump power. For fibers with low DRS noise, the Raman noise figure due to ASE is much better than the EDFA noise figure. Typically, the Raman noise figure is –2 to 0 dB, which is about 6 dB better than the EDFA noise figure.

Raman amplifier noise factor is defined as the OSNR at the input of the amplifier to the OSNR at the output of the amplifier.

Noise figure is the dB version of noise factor.

The DRA noise and signal gain is distributed over the span fiber’s effective length.

Counter pump distributed Raman amplifiers are often combined with EDFA pre-amps to extend span distances. This hybrid configuration can provide 6dB improvement in the OSNR, which can significantly extend span lengths or increase span loss budget. Counter pump DRA can also help reduce nonlinear effects and allows for channel launch power reduction.

  Functional Block Diagram for CoPropagating and Counter Propagating Raman Amplifier

Field Deployment architecture of EDFA and RAMAN Amplifiers:

Interesting to know:

Related Information

Optical Fiber Link Design requirements

The optical link design essentially is putting the various optical components, so that information can be transmitted satisfactorily. The satisfactoriness of the transmission can be defined in terms of some characteristic parameters.The user generally specifies the distance over which the information is to be sent and the data rate to be transmitted. The Designer then has to find the specification of the system components.

The designer generally has to define some additional criteria either as per the standards or as per the user specifications.

The Design criteria are given in the following.

Primary Design Criteria

  • Data Rate
  • Link length

Additional Design Parameters

  • Modulation format eg Analog/digital
                • Depends upon the type of signals user want to transmit. For example if it is a TV signal, then may be analog transmission is more suited as it requires less bandwidth and better linearity. On the other hand if data or sampled voice is to be transmitted, digital format may be more appropriate.
                • The digital signals have to be further coded to suite the transmission medium and for error correction.
  • System fidelity: BER, SNR
                • The system fidelity defines the correctness of the data received at the receiver.
                •  For digital transmission it is measured by the Bit Error Ratio (BER) . The BER is defined as:-
                • In optical system, the BER has to be less than 10E-9
                • For analog system, the quality parameter is the Signal-to-noise (SNR) ratio. In addition, there is a parameter called the inter-modulation distortion, which describes the linearity of the system.
  • Cost : Components, installation, maintenance   
              • Cost is one of the important issues of the link design.
              • The cost has three components, components, installation and maintenance.
              • The component and the installations cost are the initial costs. Generally, the installation cost is much higher than the component cost for long links. This is especially true for laying the optical cable. It is therefore appropriate to lay the cables keeping in view the future needs.
              • The optical link is suppose is supposed to work for at least 25years. The maintenance costs are as important as the initial cost. An initial cheaper system might end up into higher expenses in maintenance and therefore turn out to be more expensive as a whole.
  •   Upgradeability
              • The optical fiber technology is changing very rapidly and the data rates are increasing steadily.
              • The system should be able to adopt new technology, as well should be able to accommodate higher data rates with least possible changes.
  •   Commercial availability          
            • Depending upon which part of the world one is, the availability of the components and the systems may be an issue.

ref:http://nptel.ac.in/courses/117101054/16

The first thing to note is that for each frame there are two sets of 20 parity bits. One set is associated with the end to end post FEC BER. The other is used to measure the span by span raw BER. The points at which these parity bits are terminated are illustrated below.

postfec


Processing point

Process description

A

Calculate and insert the post FEC parity bits (those over which FEC is calculated) over the frame up to and including the MS OH.

B

Encode FEC over the frame up to and including the MS OH.

C

Calculate and insert the pre FEC parity bits (those over which FEC is not calculated) over the frame up to and including the RS OH.

D

Terminate the raw BER based on the pre FEC parity bits.

E

Re-calculate the pre FEC parity bits over the frame up to, and including, the RS OH.

F

Decode FEC to produce the final data.

G

Terminate the post FEC BER based on the post FEC parity bits.


We can use the raw BER extracted at each RS terminating point (regens and LTEs) to estimate the post FEC BER. Note that this estimate is based on an assumption of a Poisson distribution of errors. In contrast the real post FEC BER can only be extracted at the MS terminating equipment (LTEs), and this is used to feed into the PM error counts.

Following are the terminologies you will come across when referring FEC Performance parameters:

PRE-FEC BER are the bit errors caused by attenuation, ageing, temperature changes of the optical fiber. PRE-FEC indicates that the signal on the optical fiber is FEC
encoded. The FEC decoder will recover the original signal, but depending on the PRE_FEC BER it will succeed to recover the original signal completely without errors.
Or, if the BER on the fiber is too high, the recovered signal will  contain bit errors.

If the signal was FEC encoded the remaining bit errors after the decoder are called POST_FEC BER. 

The NO_FEC BER are the bit errors detected when no FEC coding is used on the optical fiber.

Uncorrected words are the word that FEC is not able to corrects.It shows that the current FEC is not able to correct anymore and we need to look for more advance FEC.