
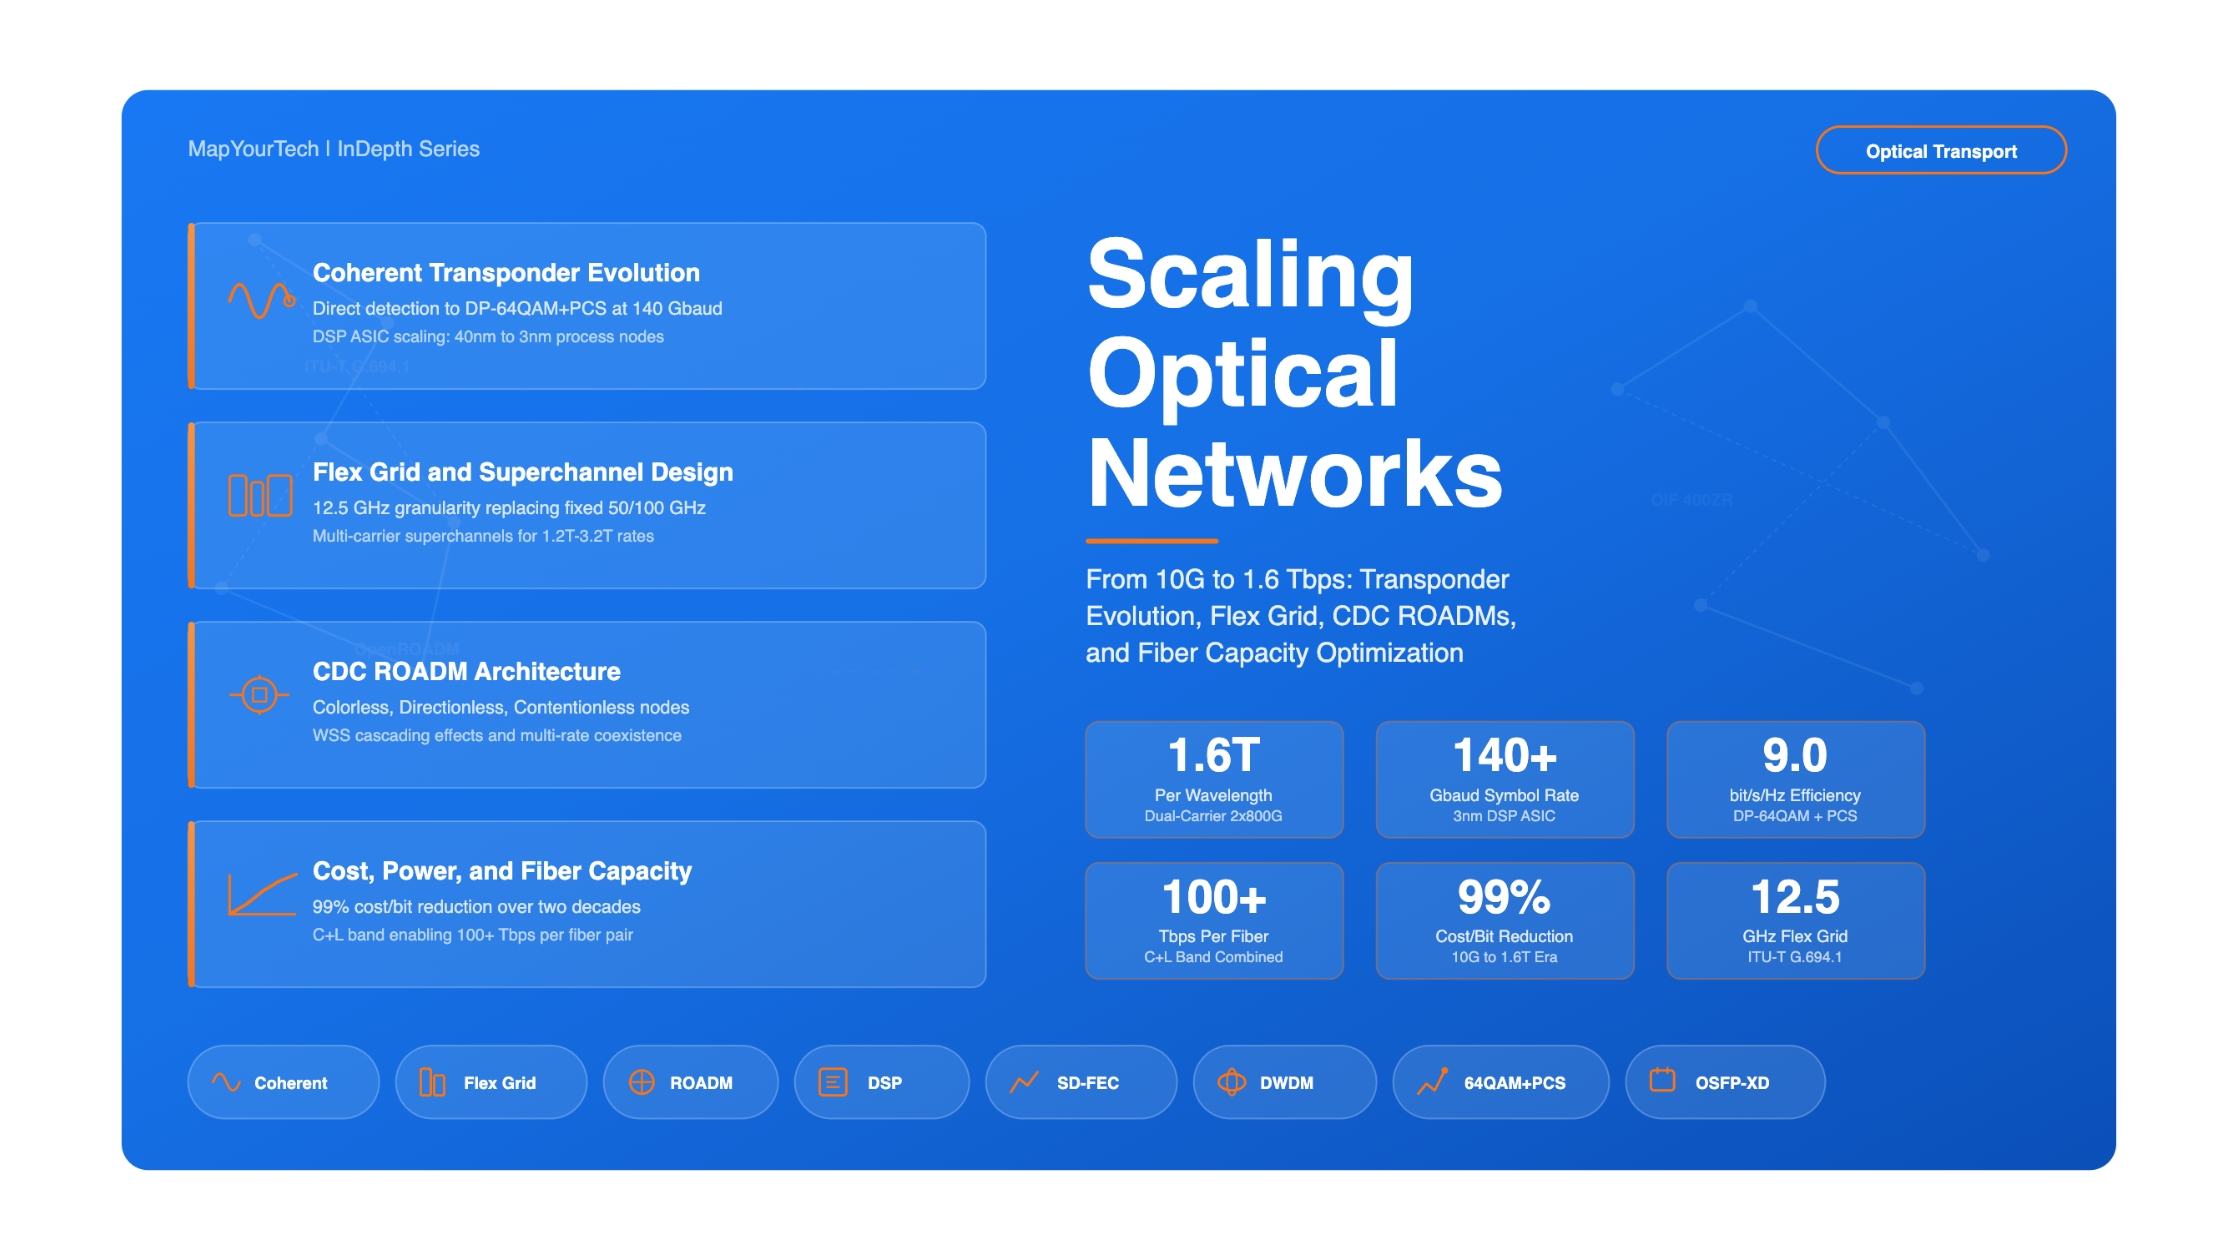

Scaling Optical Networks: From 10G to 1.6 Tbps
A Comprehensive Engineering Guide to Transponder Evolution, Spectral Grid Architecture, Cost and Power Optimization, and Fiber Capacity Planning for Next-Generation DWDM Networks
Table of Contents
- Introduction
- Historical Evolution: The Speed Scaling Timeline
- Transponder Architecture: From Direct Detection to Coherent
- Modulation Formats and Spectral Efficiency
- Grid Architecture: Fixed Grid to Flex Grid
- ROADM Evolution: Enabling the Multi-Rate Network
- Cost Per Bit and Power Per Bit Analysis
- Fiber Pair Capacity and Utilization
- The 800G Era: Current Deployments and Challenges
- The Road to 1.6 Tbps and Beyond
- Practical Design Considerations
- Future Directions
- Conclusion
1 Introduction
The optical networking industry has experienced one of the most remarkable technology scaling stories in modern engineering. Over roughly two decades, the per-wavelength data rate carried across a single optical fiber has increased by more than two orders of magnitude, from 10 Gbps to 1.6 Tbps. This progression, driven by advances in Digital Signal Processing (DSP), coherent detection, advanced modulation formats, and photonic integration, has fundamentally reshaped how network operators design, deploy, and manage their optical infrastructure.
Each generation of speed increase has demanded corresponding evolution across the entire optical transport ecosystem: transponders, multiplexers, demultiplexers, Reconfigurable Optical Add-Drop Multiplexers (ROADMs), amplifiers, and the spectral grid itself. Moving from 10G to 40G introduced the first taste of complexity with differential phase-shift keying. The jump to 100G marked the industry's transition to coherent detection with Polarization-Division Multiplexed Quadrature Phase-Shift Keying (PDM-QPSK). At 400G and 800G, higher-order modulation formats such as 16-QAM and 64-QAM became standard, while Probabilistic Constellation Shaping (PCS) pushed transmission efficiency closer to the Shannon limit. And as of 2025-2026, 1.6 Tbps per wavelength is transitioning from laboratory demonstrations to early commercial deployment.
This article provides a comprehensive engineering analysis of the complete scaling journey. It covers the practical challenges at each speed generation, including transponder architecture changes, multiplexing and grid evolution (from fixed 100 GHz to flex-grid with 12.5 GHz granularity), cost-per-bit and power-per-bit trends, spectral efficiency improvements, fiber pair capacity utilization across C-band and C+L band systems, and the ROADM architecture requirements needed to support mixed-rate traffic. The analysis draws from industry standards (ITU-T G.694.1, OIF 400ZR, OpenROADM), real-world product specifications, and the latest research through 2026 to deliver a reference-grade resource for optical network professionals.
2 Historical Evolution: The Speed Scaling Timeline
The scaling of per-wavelength data rates in optical networks follows a progression that reflects both the push from bandwidth demand and the pull of enabling technology innovations. Each generation introduced new challenges that required fundamental changes to the underlying optical transport architecture.
The workhorse of early DWDM networks. 10G systems used On-Off Keying (OOK) with Non-Return-to-Zero (NRZ) modulation and direct detection. Operating on a 50 GHz or 100 GHz fixed grid, these systems could pack 80-96 wavelengths across the C-band, delivering 0.8-0.96 Tbps per fiber pair. The technology was simple, cost-effective, and widely deployed. Chromatic dispersion was managed with Dispersion Compensating Fiber (DCF) modules placed at amplifier sites, and Polarization Mode Dispersion (PMD) limited reach on older fiber plants.
40G represented the first major scaling challenge. Direct detection at 40G required Differential Quadrature Phase-Shift Keying (DQPSK) to keep the signal bandwidth manageable within a 50 GHz channel. The short-lived 40G era revealed critical lessons: the jump from 10G to 40G increased OSNR requirements by roughly 6 dB while reducing dispersion tolerance by 16 times. Many operators found that upgrading amplifiers, managing tighter dispersion budgets, and replacing legacy fiber with high PMD coefficients made 40G uneconomical on many routes. This generation's difficulties accelerated the development of coherent detection.
100G coherent with PDM-QPSK at 28-32 Gbaud transformed optical networking. Coherent detection with DSP eliminated the need for external DCF modules, dramatically simplified network design, and improved spectral efficiency to approximately 2 bit/s/Hz. A single 100G wavelength replaced ten 10G wavelengths while consuming roughly the same spectral bandwidth. The CFP and CFP2 form factors housed these early coherent transponders. Soft-Decision Forward Error Correction (SD-FEC) with 11-13 dB net coding gain (NCG) enabled reaches of 2,000+ km with QPSK modulation.
400G systems used DP-16QAM at 64 Gbaud or dual-carrier DP-QPSK at 64 Gbaud, depending on reach requirements. The introduction of flex-grid ROADMs with 12.5 GHz slot granularity became essential to accommodate the wider spectral footprint of 400G signals. The 400ZR standard from the Optical Internetworking Forum (OIF) brought coherent optics into pluggable QSFP-DD and OSFP form factors, enabling IP-over-DWDM architectures. Cost per bit dropped by roughly 40-50% compared to 100G, while power per bit improved by approximately 60%.
800G coherent systems use DP-64QAM with PCS at baud rates of 90-140 Gbaud, enabled by 5nm and 3nm DSP ASIC technology. The 800ZR specification targets 80 km DCI applications, while 800ZR+ supports reaches beyond 1,000 km with adaptive modulation. As of late 2025, industry analysts forecast 800G coherent module shipments exceeding 200,000 units in 2026, with revenues surpassing $1 billion. Silicon photonics integration has been a key enabler for reducing both cost and power consumption.
1.6 Tbps per wavelength is achieved through dual-carrier architectures, each carrier operating at 800 Gbps with baud rates of 130-200 Gbaud. State-of-the-art transponders in 2024-2025 support one or two carriers per module with maximum line rates reaching 1.2-1.6 Tbps. The OIF launched standardization efforts for 1600ZR and 1600ZR+ in 2024, targeting commercial availability around 2027-2028. For the data center interconnect segment, 1.6T datacom optics using 8x200G lanes (DR8) have entered early volume production for NVIDIA and hyperscale applications.
| Parameter | 10G | 40G | 100G | 400G | 800G | 1.6T |
|---|---|---|---|---|---|---|
| Modulation | OOK/NRZ | DQPSK/DP-QPSK | PDM-QPSK | DP-16QAM | DP-64QAM + PCS | DP-64/128QAM + PCS |
| Detection | Direct | Direct/Coherent | Coherent | Coherent | Coherent | Coherent |
| Baud Rate | 10 Gbaud | 10-12 Gbaud | 28-32 Gbaud | 60-72 Gbaud | 90-140 Gbaud | 130-200 Gbaud |
| Spectral Efficiency | 0.2-0.4 b/s/Hz | 0.8-1.0 b/s/Hz | 2.0 b/s/Hz | 4.0-5.3 b/s/Hz | 5.5-7.0 b/s/Hz | 7.0-9.0 b/s/Hz |
| Channel Spacing | 100 GHz | 50-100 GHz | 50 GHz | 50-75 GHz | 75-100 GHz | 100-150 GHz |
| Typical Reach (Long-Haul) | 2,500+ km | 1,200 km | 2,000+ km | 600-1,500 km | 400-1,000 km | 200-800 km |
| Form Factor | SFP+, XFP | CFP, QSFP+ | CFP, CFP2 | QSFP-DD, OSFP, CFP2 | QSFP-DD, OSFP | OSFP-XD, CFP2 |
| Power (W) | 1-2 | 3-5 | 6-20 | 15-25 | 20-30 | 25-40 |
| Cost Per 100G | $$$$$ | $$$$ | $$$ | $$ | $ | $ |
| DSP Technology Node | N/A | 65-40 nm | 28-16 nm | 16-7 nm | 7-5 nm | 5-3 nm |
Read the Full Analysis with Premium
The remaining 88% of this article — the design numbers, trade-offs and field guidance — is part of MapYourTech Premium, along with the full premium library, courses and professional tools.

Course Title
Course description and key highlights