
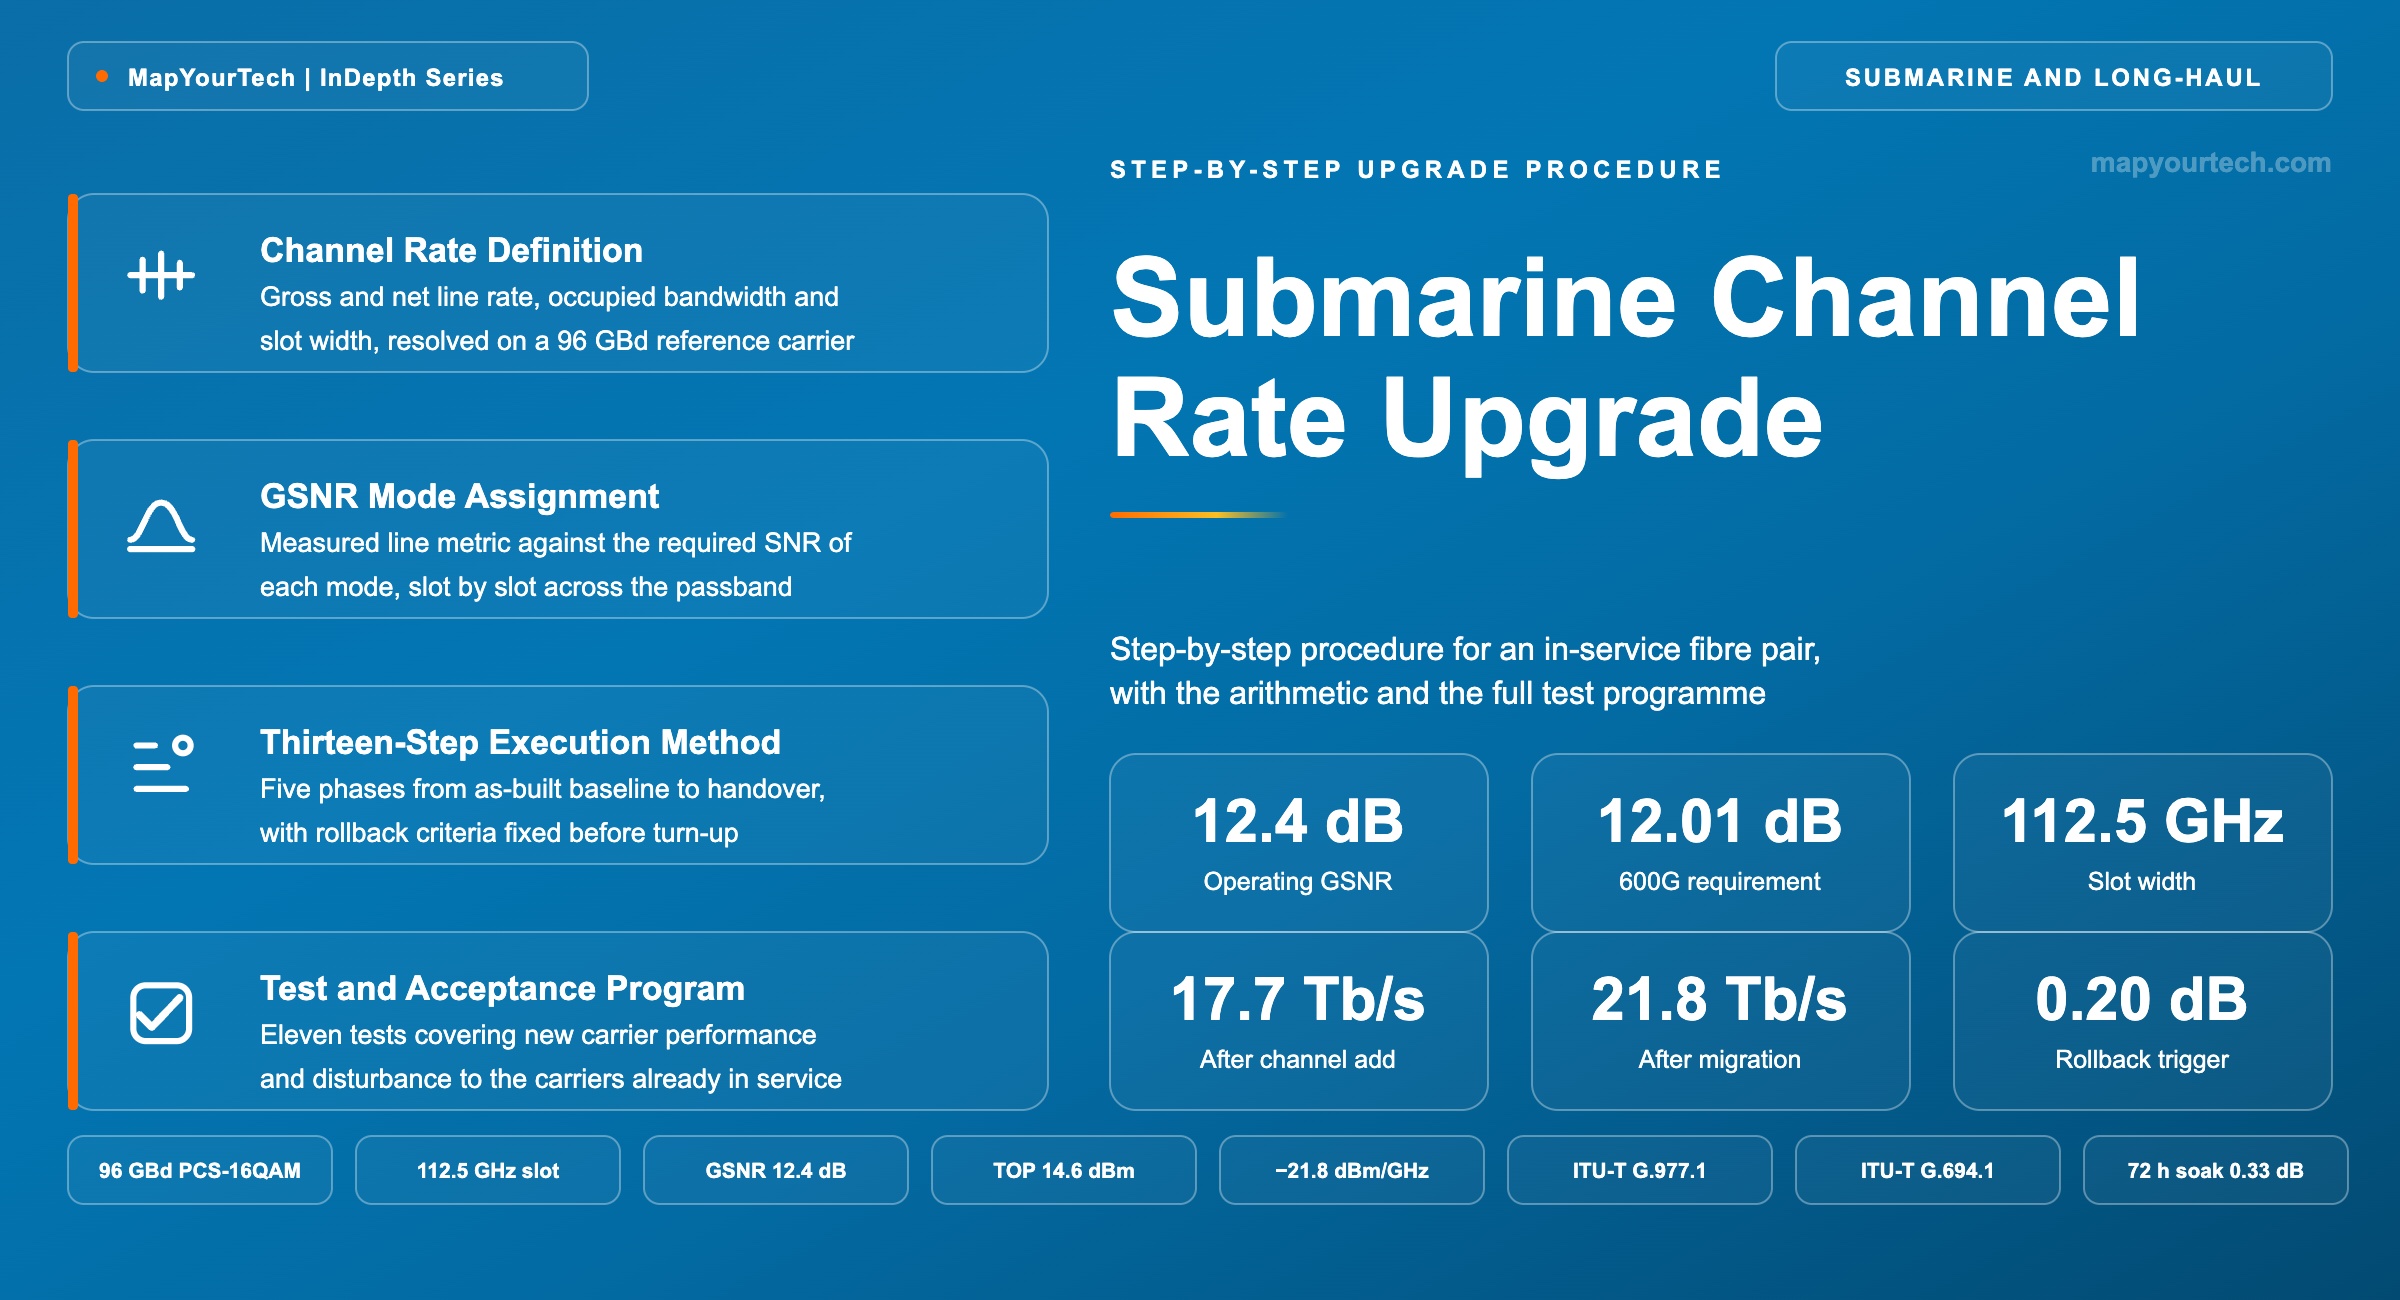
Submarine Channel Rate Upgrade: Step-by-Step Procedure
Raising a live submarine fibre pair from 200 Gb/s QPSK to 600 Gb/s carriers without disturbing the traffic already on it: the measurements, the arithmetic, the thirteen execution steps and the test programme a terminal supplier signs against.
Every decibel of margin is paid for once and spent many times.
What You Will Learn
- Define channel rate from first principles and separate gross line rate, net line rate, occupied bandwidth and slot width using Figure 1 and the 96 GBd, 112.5 GHz reference case.
- Convert a measured GSNR of 12.4 dB into the total SNR a receiver actually sees, and back out the 12.01 dB the 600 Gb/s mode requires, using the reciprocal chain of Section 4.
- Place the upgrade coupler, the ASE idler source and the two power controllers correctly in the line system of Figure 4, and state which supplier owns each of them.
- Build a frequency-resolved channel plan from a measured GSNR sweep, assigning 600 Gb/s and 500 Gb/s modes per Table 3 to reach 17.7 Tb/s on a pair that carries 4.8 Tb/s today.
- Hold power spectral density constant through a slot-width change with the conversion P = S + 10 log₁₀(B), turning −21.8 dBm/GHz into −3.0 dBm and −1.2 dBm channel powers.
- Execute the thirteen-step method of Table 4 and Figure 6, including the 0.20 dB rollback trigger that governs every idler-to-carrier substitution in Phase D.
- Run the eleven-test acceptance programme of Table 5, including the 72-hour soak whose five-sigma spread of 0.33 dB decides whether the channel plan survives to end of life.
- Select between a channel add, a parallel line system and a full migration using the decision tree of Figure 12 and the 17.7 versus 21.8 Tb/s outcome in Table 7.
1. Introduction
A submarine fibre pair carrying twenty-four 200 Gb/s QPSK channels is not a busy fibre pair. It holds 4.8 Tb/s of revenue traffic and roughly 2,600 GHz of spectrum filled with amplified spontaneous emission whose only function is to keep the repeater chain loaded to its design total output power. The wet plant underneath delivers the same generalized signal-to-noise ratio it delivered on the day of provisional acceptance, less the allowance consumed by repairs and component ageing. Nothing about the cable has become less capable. The terminal equipment on each end has become far more capable, and the gap between what the glass can support and what the installed transponders extract is the entire commercial case for a channel rate upgrade.
That gap is large and it widens on a predictable cadence. Coherent transponder generations turn over every eighteen to twenty-four months, and each turn brings some combination of higher symbol rate, better forward error correction, and finer control over spectral efficiency. A cable designed around 100 Gb/s QPSK line cards and accepted on a Q-factor budget will, ten years later, face modems running above 100 GBd with probabilistically shaped constellations and soft-decision codes. Ciena states that its WaveLogic 6 Extreme optics reached 800 Gb/s on a single carrier across an unregenerated 16,608 km transpacific path on the Bifrost system, delivering 18 Tb/s of fibre pair capacity in a ten rack-unit terminal footprint (vendor claim). A wet plant specified before that hardware existed can still carry it, because the wet plant was never specified in bits per second.
The separation that makes this possible is the open cable model. Optical amplification first decoupled the submerged infrastructure from the transmission bit rate, and coherent detection completed the separation by moving chromatic dispersion management into the receiver's digital signal processing, which removed the fibre-map dependency that had forced terminal and cable to come from the same supplier. What remains at the boundary is an optical interface with agreed parameters, and an acceptance metric — generalized signal-to-noise ratio — that characterizes the line without reference to any particular modem. A reader coming to this cold will find the boundary conditions set out in the submarine cable stack from open cables through generalized OSNR to power-constrained transmission, and the ownership split between submerged and terminal domains in wet plant versus dry plant equipment in submarine networks.
An upgrade executed on a fibre pair that is already earning revenue is a different engineering problem from a first turn-up. Every action changes the optical power landing on a chain of erbium-doped fibre amplifiers that are running in total-output-power control, and every one of those amplifiers redistributes any change across the whole spectrum. Adding a carrier at 194.0 THz alters the gain seen at 191.7 THz. Removing 100 GHz of idler power raises the power delivered to every surviving channel. The traffic already in service has customers, service level agreements, and a margin budget that was set years ago and has been slowly consumed since. The operating rule that governs the entire procedure follows from that: the total power presented to the wet plant, and the power spectral density across the occupied spectrum, are held constant while the content of the spectrum is exchanged.
This article sets out the procedure for that exchange end to end — the measurements that establish what the cable can support today, the arithmetic that converts a measured line metric into a defensible channel plan, the thirteen execution steps and their acceptance criteria, and the test programme a terminal supplier runs and signs against. It covers repeatered, dispersion-unmanaged systems in the C-band, which is where the open cable model and the generalized signal-to-noise ratio metric both apply; legacy dispersion-managed cables are treated only where their behaviour under power change differs enough to change the method.
The reference case used throughout
One worked design case threads every section, so that a number quoted in the channel plan section is the same number that appears in the acceptance criteria. The case is a repeatered C-band fibre pair with 4,400 GHz of usable passband and a repeater total output power of 14.6 dBm per fibre, delivering an average GSNR of 12.4 dB after repair and ageing allowances are subtracted. Twenty-four 200 Gb/s DP-QPSK channels at 60 GBd occupy the lower 1,800 GHz in 75 GHz slots. The remaining 2,600 GHz is held by amplified spontaneous emission idlers at the design power spectral density. The upgrade target is a bank of 500 Gb/s and 600 Gb/s probabilistically shaped 16QAM carriers at 96 GBd in 112.5 GHz slots. Every value in that description is a worked design case computed for this article rather than a measurement from a named system, and each is derived from published standard parameters and industry-typical values in the sections that follow.
Takeaway: The upgrade opportunity exists because a wet plant is specified in optical parameters and a terminal is specified in bits per second, and those two specifications drift apart at the rate of modem innovation. The constraint that makes the upgrade difficult is that a fibre pair under total-output-power control has no local changes — every adjustment in one part of the spectrum propagates across all of it.
2. Channel Rate Definition and Component Terms
Channel rate is the information rate carried by one optical carrier on one fibre pair, measured in bits per second at a stated reference point. Channel rate is set by three transponder choices — symbol rate, bits carried per symbol per polarization, and forward error correction overhead — and is delivered inside a reserved block of spectrum called a frequency slot.
Three of those quantities are transponder properties and one is a network property, and the distinction matters because an upgrade changes them at different times and with different consequences. Symbol rate, modulation entropy and coding overhead live inside the line card and can be reprogrammed. Slot width lives in the network plan, is written into the spectrum allocation, and cannot be changed without renegotiating what sits on either side of it.
Read the Full Analysis with Premium
The remaining 88% of this article — the design numbers, trade-offs and field guidance — is part of MapYourTech Premium, along with the full premium library, courses and professional tools.
You May Also Like
-
Free
-
August 22, 2026
-
Premium
-
August 22, 2026
-
Premium
-
August 22, 2026