Our most popular path. Structured modules from fiber basics to 400G coherent.
In-depth coverage of DWDM, OTN, coherent optics, network design, and more — written by field engineers.
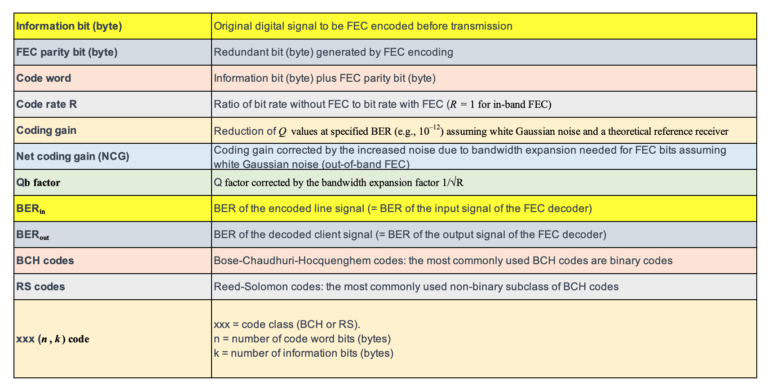
Glossaries, troubleshooting guides, optical formulas, 80+ infographics, and ITU-T standards references.
Follow MapYourTech on LinkedIn for exclusive updates — new technical articles, course launches, member discounts, tool releases, and industry insights straight to your feed.
Course description and key highlights
Enter the destination URL
Or link to existing content