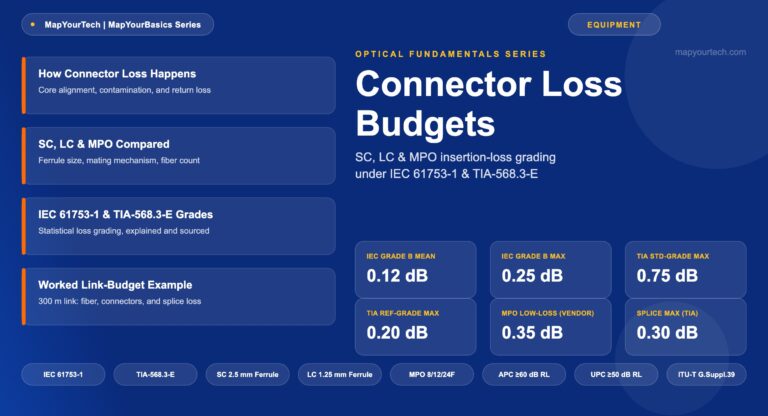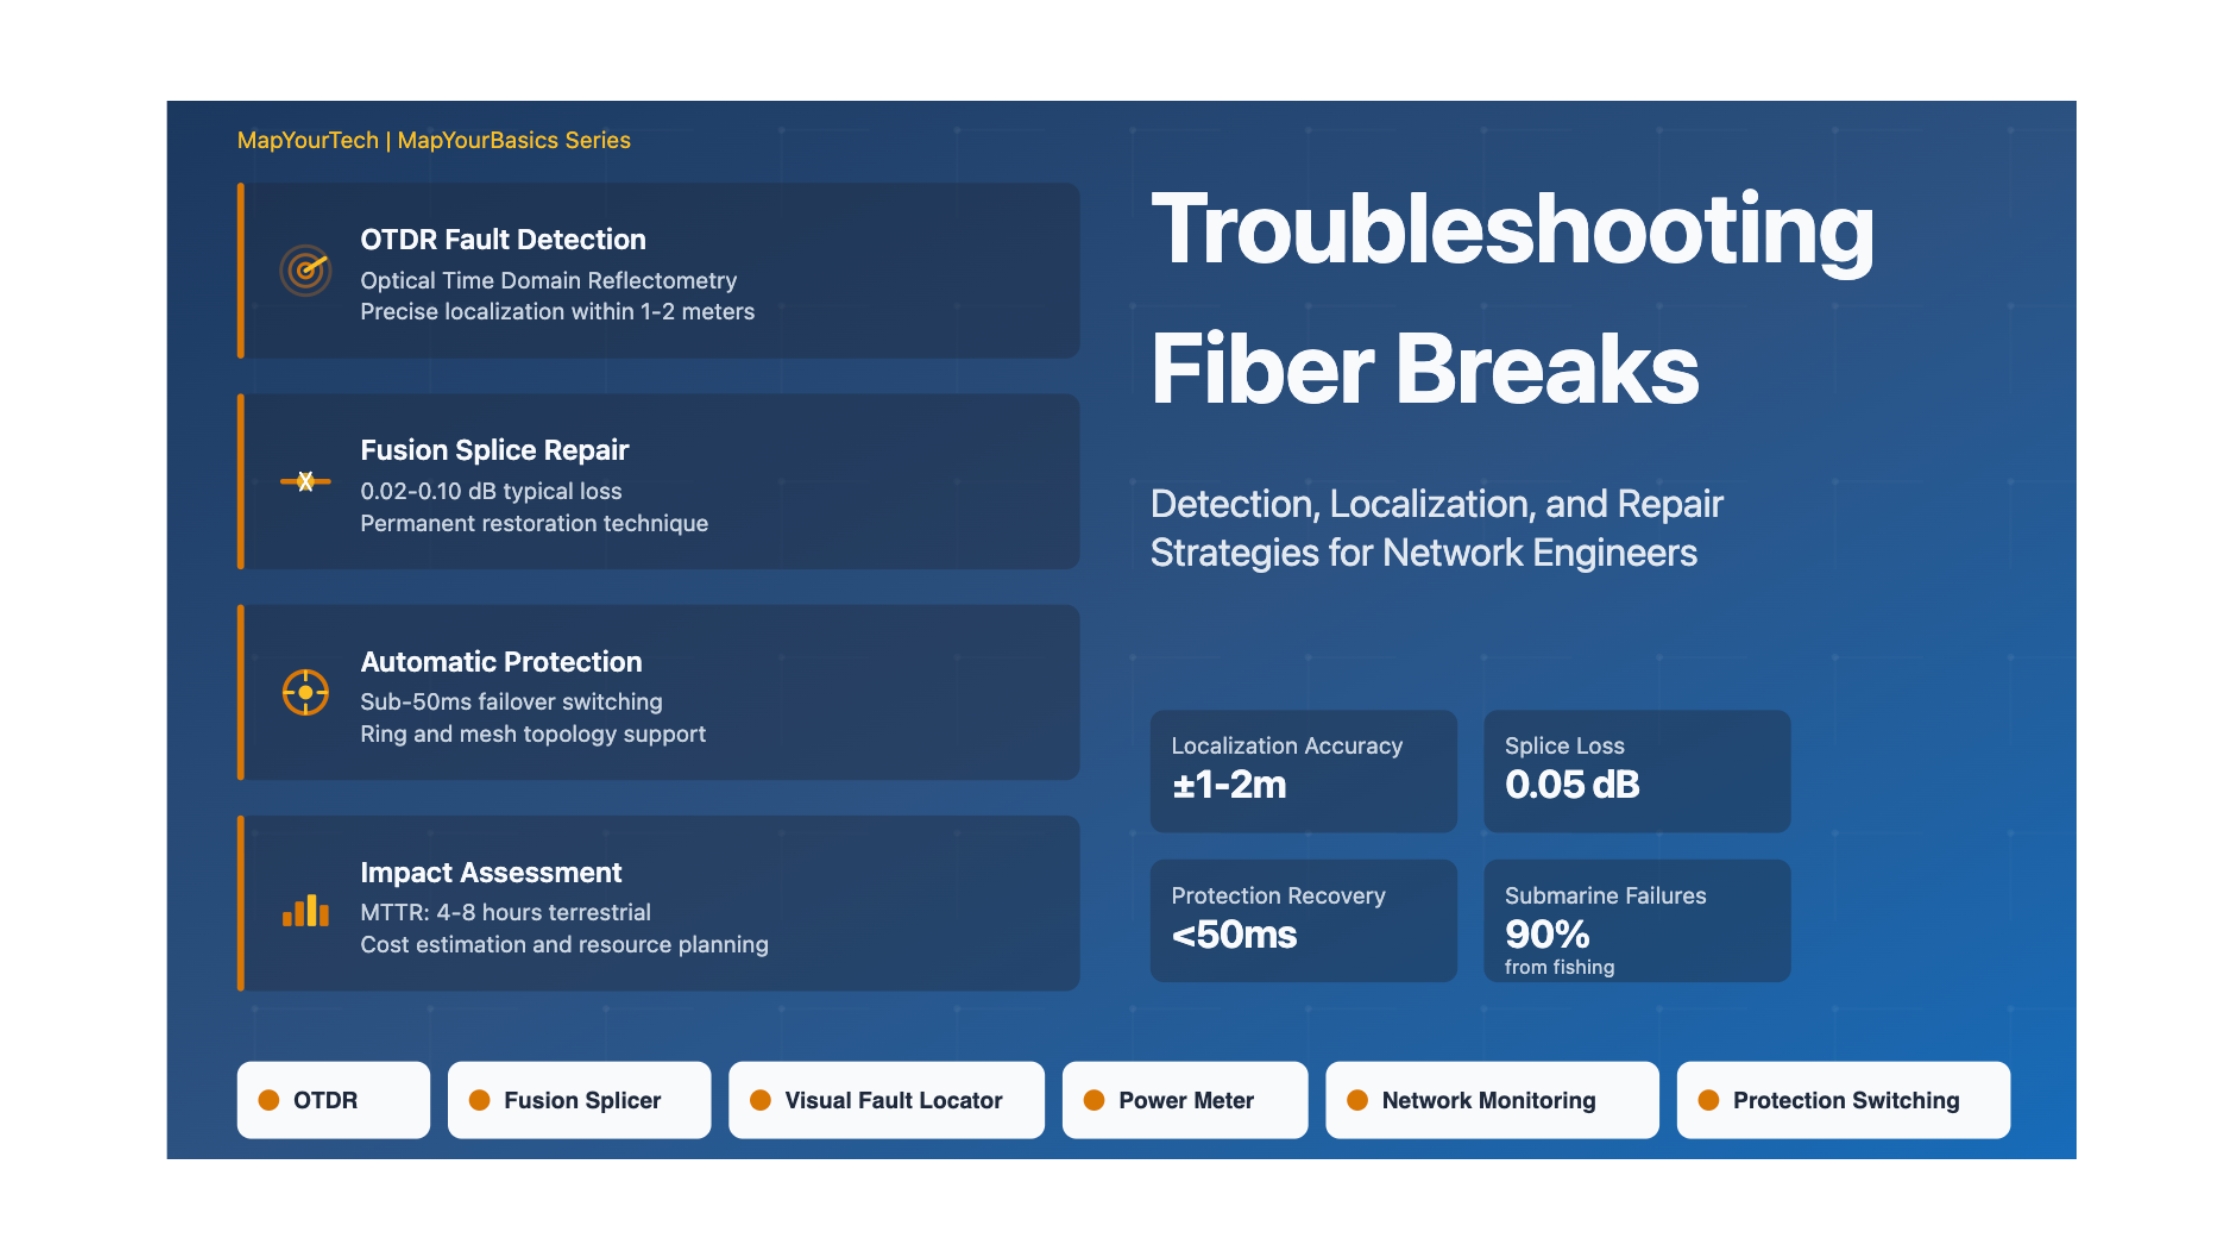

Troubleshooting Fiber Breaks
Comprehensive Guide to Detection, Localization, and Repair
Professional Methods & Interactive Tools for Network Engineers
Fundamentals & Core Concepts
What is Troubleshooting Fiber Breaks?
Troubleshooting fiber breaks is the systematic process of detecting, localizing, and repairing physical discontinuities or damage in optical fiber cables that disrupt signal transmission. A fiber break represents a complete or partial interruption in the glass core that prevents light from propagating through the fiber, resulting in loss of service.
Why Does It Occur?
Fiber breaks occur due to various physical and environmental factors:
- Mechanical Damage: Construction activities, digging, drilling, or anchor dragging in submarine environments
- Extreme Bending: Fiber bent beyond minimum bend radius specifications causing core fracture
- Tensile Stress: Excessive pulling force during installation or maintenance operations
- Impact Damage: External force causing crush or shear stress on the cable
- Temperature Cycling: Expansion and contraction leading to stress fractures over time
- Water Ingress: Moisture causing corrosion and fiber degradation
- Geological Events: Earthquakes, landslides, or seabed movements in submarine installations
- Fishing Activities: Nearly 90% of submarine cable failures caused by trawlers and anchors
When Does It Matter?
Fiber breaks are critical in scenarios where network availability and service continuity are paramount:
| Scenario | Impact Level | Recovery Time | Critical Actions |
|---|---|---|---|
| Financial Networks | CRITICAL | < 50ms (auto-reroute) | Automatic protection switching, redundant paths |
| Long-Haul Networks | CRITICAL | 4-8 hours | OTDR localization, field repair dispatch |
| Submarine Cables | CRITICAL | 1-3 weeks | Ship mobilization, cable recovery and splice |
| Enterprise Networks | HIGH | 2-4 hours | Visual fault location, connector inspection |
| Data Center Links | HIGH | 1-2 hours | Immediate failover, rapid fiber replacement |
Why Is It Important?
The importance of effective fiber break troubleshooting extends across technical, operational, and business dimensions:
Mathematical Framework
OTDR Distance Calculation
Fault Distance Formula
Distance = (Time × Speed of Light) / (2 × Refractive Index)
Where:
- Time: Round-trip time for optical pulse (seconds)
- Speed of Light: 3 × 10⁸ m/s
- Refractive Index: Typically 1.4685 for standard fiber
- Factor of 2: Accounts for round-trip propagation
If OTDR measures a reflection at 400 nanoseconds:
Distance = (400 × 10⁻⁹ × 3 × 10⁸) / (2 × 1.4685) = 40.8 km
Splice Loss Calculation
Fusion Splice Loss
Loss (dB) = 10 × log₁₀(P₁/P₂)
Where:
- P₁: Power before splice (mW)
- P₂: Power after splice (mW)
- Typical Values: 0.05-0.1 dB for fusion splicing, 0.3-0.5 dB for mechanical splicing
1. Input power before splice: 1.0 mW
2. Output power after splice: 0.90 mW
3. Loss = 10 × log₁₀(1.0/0.90) = 0.46 dB
4. Assessment: Acceptable for mechanical splice, high for fusion splice
Link Budget Impact
Total Link Loss After Repair
Total Loss = (Fiber Attenuation × Length) + Splice Losses + Connector Losses + Repair Margin
Total Loss = (α × L) + ΣSplice + ΣConnector + Mrepair
Where:
- α: Fiber attenuation coefficient (dB/km) - typically 0.18-0.20 dB/km @ 1550nm
- L: Total fiber length (km)
- ΣSplice: Sum of all splice losses (dB)
- ΣConnector: Sum of connector losses (dB) - typically 0.3-0.5 dB each
- Mrepair: Repair operation margin (1.5-3.0 dB for deep water repairs)
For a 100 km repaired segment:
• Fiber loss: 0.20 dB/km × 100 km = 20.0 dB
• Original splices (10): 10 × 0.08 dB = 0.8 dB
• Repair splice (2 new): 2 × 0.10 dB = 0.2 dB
• Deep water repair margin: 3.0 dB
• Additional cable (2.5x depth @ 2000m = 5km): 0.20 × 5 = 1.0 dB
Total Impact: 25.0 dB (vs 20.8 dB pre-repair)
Repair Time Estimation
Mean Time To Repair (MTTR)
MTTR = Tdetect + Tlocate + Tmobilize + Taccess + Trepair + Ttest
| Phase | Terrestrial | Shallow Water | Deep Water |
|---|---|---|---|
| Detection | 5-15 minutes | 5-15 minutes | 5-15 minutes |
| Localization (OTDR) | 15-30 minutes | 30-60 minutes | 30-60 minutes |
| Mobilization | 1-2 hours | 4-12 hours | 3-7 days |
| Site Access | 0.5-2 hours | 2-6 hours | 1-5 days |
| Repair/Splice | 1-3 hours | 3-8 hours | 6-12 hours |
| Testing | 0.5-1 hour | 1-2 hours | 2-4 hours |
| Total MTTR | 4-8 hours | 12-30 hours | 1-3 weeks |
Types & Components
Classification of Fiber Breaks
Complete Fiber Break
Characteristics: Total physical separation of fiber core and cladding resulting in 100% signal loss.
- OTDR shows strong reflection event followed by no signal
- Loss of Service (LOS) alarm triggered immediately
- Requires physical splice repair
- Typical causes: Construction damage, severe cable crush, cutting
Partial Fiber Break (Crack)
Characteristics: Micro-crack or partial fracture causing severe attenuation (15-40 dB) but not complete signal loss.
- OTDR shows high loss event but signal continues beyond
- Intermittent connectivity or high error rates
- May worsen over time due to stress concentration
- Typical causes: Excessive bending, temperature stress, aging
Connector Break
Characteristics: Failure at connector interface due to contamination, damage, or improper mating.
- OTDR shows high reflection and loss at known connector location
- Often recoverable through cleaning or re-termination
- Typical loss: 0.5-3.0 dB (vs normal 0.3-0.5 dB)
- Typical causes: Dust, scratches, misalignment
Splice Failure
Characteristics: Failure at splice point due to poor alignment, contamination, or mechanical stress.
- OTDR shows increased loss at splice location (>0.3 dB)
- May be fusion or mechanical splice failure
- Requires re-splicing for permanent repair
- Typical causes: Installation defects, thermal cycling, mechanical stress
Diagnostic Equipment Components
| Tool | Function | Measurement Range | Accuracy | Application |
|---|---|---|---|---|
| OTDR | Fault localization, loss measurement | 0-200+ km | ±1 meter | Primary break detection and distance measurement |
| Visual Fault Locator (VFL) | Visual break identification | 0-5 km | Visual inspection | Short distance breaks, connector issues |
| Optical Power Meter | Power level measurement | -70 to +10 dBm | ±0.05 dB | Link budget verification, splice loss |
| Fiber Microscope | End-face inspection | 200-400x magnification | Visual | Connector contamination, fiber damage |
| Fusion Splicer | Permanent fiber joining | - | 0.02-0.10 dB | Break repair, network installation |
| Tone Generator | Fiber identification | Variable | - | Multi-fiber cable tracing |
Break Location Environments
| Environment | Common Causes | Detection Method | Repair Complexity |
|---|---|---|---|
| Terrestrial Buried | Construction, digging, rodents | OTDR, GIS mapping | Medium |
| Aerial/Overhead | Weather, vehicle strikes, vandalism | Visual inspection, OTDR | Low |
| Building/Riser | Installation damage, door closures | VFL, OTDR | Low |
| Submarine Shallow | Fishing, anchors, seabed movement | OTDR, underwater surveys | High |
| Submarine Deep | Equipment failure, geological events | Remote monitoring, OTDR | Very High |
Effects & Impacts
System-Level Effects
Network-Wide Cascading Effects
- Traffic Rerouting Overhead: Automatic protection switching redirects traffic to backup paths, potentially overloading alternate routes
- Capacity Reduction: Available network capacity decreases by the bandwidth of the broken fiber (up to 10+ Tbps for modern systems)
- Increased Latency: Backup paths may be longer, adding 5-50ms of additional latency
- Single Point of Failure: If redundant path also fails, complete network partition occurs
Performance Implications
| Impact Category | Immediate Effect | Duration | Mitigation |
|---|---|---|---|
| Signal Loss | 100% loss on affected fiber | Until repair complete | Automatic protection switching (<50ms) |
| Service Availability | 99.999% → variable | MTTR dependent | Diverse routing, ring topology |
| BER Performance | Unmeasurable (no signal) | Until restoration | Traffic diversion to working paths |
| OSNR | Infinite degradation | Until repair | Monitor alternate paths for capacity |
| Network Capacity | 10-50% reduction typical | Hours to weeks | Dynamic bandwidth allocation |
Quantitative Assessments
Availability Impact Calculation
Availability = (Total Time - Downtime) / Total Time × 100%
Annual operating time: 8,760 hours
Fiber break MTTR: 6 hours
Breaks per year: 0.1 (one every 10 years)
Expected downtime: 6 × 0.1 = 0.6 hours/year
Availability = (8760 - 0.6) / 8760 × 100% = 99.993%
Impact: Drops from "five nines" (99.999%) to 99.993%
Tolerance Levels and Thresholds
| Severity Level | Loss Range | Service Impact | Action Required | Priority |
|---|---|---|---|---|
| CRITICAL | >40 dB | Complete outage | Immediate dispatch, 24/7 response | P1 |
| MAJOR | 20-40 dB | Severe degradation | Urgent repair within 4 hours | P2 |
| MINOR | 10-20 dB | Performance impact | Scheduled repair within 24 hours | P3 |
| WARNING | 3-10 dB | Reduced margin | Planned maintenance | P4 |
Impact Severity Classifications
Financial Impact
- Revenue Loss: $5,000-$50,000 per hour for enterprise services
- SLA Penalties: Credit payments for availability breaches (typically 10-25% of monthly charges)
- Repair Costs: $2,000-$10,000 terrestrial, $500,000-$5M submarine
- Customer Churn: Increased customer attrition after outages
Operational Impact
- Emergency Resource Allocation: Diversion of staff from planned activities
- Equipment Mobilization: Test equipment, splice trucks, marine vessels
- Traffic Management: Manual intervention for capacity rebalancing
- Customer Communications: Notification and status updates
Mitigation Strategies Overview
| Strategy | Protection Level | Cost Factor | Recovery Time | Best Application |
|---|---|---|---|---|
| 1+1 Protection | 100% redundancy | High (2x fiber) | <50ms | Critical services |
| Ring Topology | Full protection | Medium | 50-150ms | Metro networks |
| Mesh Restoration | Multiple paths | Medium-High | <200ms | Core networks |
| Diverse Routing | Route diversity | High | Automatic | All mission-critical |
| Proactive Monitoring | Early detection | Low | Reduces MTTR | All networks |
Techniques & Solutions
Detection Methods
1. OTDR Testing (Primary Method)
Implementation: Optical Time Domain Reflectometry uses backscatter analysis to detect and locate fiber faults.
Technique Steps:- Pulse Injection: Launch optical pulse (850nm, 1310nm, or 1550nm) into fiber
- Backscatter Analysis: Measure Rayleigh scattering returning from each point along fiber
- Reflection Detection: Identify Fresnel reflections at breaks, connectors, and splices
- Distance Calculation: Convert time-of-flight to physical distance using refractive index
- Precise location accuracy (±1-2 meters)
- Non-destructive testing from one end
- Identifies multiple faults in single scan
- Quantifies loss magnitude at each event
- Dead zones near launch (2-10 meters)
- Requires fiber access point
- Cannot test through complete breaks from far end
- Initial investment cost $10,000-$50,000
2. Visual Fault Location (VFL)
Implementation: Inject visible red light (650nm) and visually identify escape points.
Best For:- Short distance faults (0-5 km)
- Connector inspection
- Patch panel verification
- Bend detection in accessible areas
- Low cost ($100-$500)
- Immediate visual feedback
- Simple operation
- Battery powered, portable
3. Continuous Monitoring Systems
Implementation: Permanent OTDR or optical power monitoring at key network points.
Capabilities:- Real-time fault detection (sub-second)
- Automated alarm generation
- Historical trend analysis
- Predictive maintenance alerts
- AI-powered anomaly detection
Repair Techniques
| Method | Process | Typical Loss | Time Required | Durability |
|---|---|---|---|---|
| Fusion Splicing | Arc melts fiber ends together | 0.02-0.10 dB | 5-10 minutes | Permanent |
| Mechanical Splice | Precision alignment fixture | 0.1-0.5 dB | 2-5 minutes | Long-term |
| Emergency Patch | Temporary connector installation | 0.5-3.0 dB | 10-20 minutes | Temporary |
| Cable Replacement | Install new cable section | Per specifications | 4-8 hours | Permanent |
Fusion Splicing Best Practices
Step-by-Step Fusion Splice Procedure
1. Fiber Preparation (Critical Phase)- Strip fiber coating using mechanical stripper (16mm length)
- Clean bare fiber with isopropyl alcohol and lint-free wipes
- Inspect under microscope for coating residue or contamination
- Use precision cleaver for perfectly flat, perpendicular end face
- Cleave angle must be <0.5° from perpendicular
- Inspect cleave quality under splicer microscope
- Re-cleave if defects detected (chips, angle, lip)
- Load fibers into splicer alignment grooves
- Automated splicer aligns cores using image processing
- X-Y-Z alignment typically accurate to 0.1 μm
- Verify alignment on splicer display before arc
- Pre-arc cleaning: Brief arc pulse removes surface contaminants
- Main arc: Melts fiber ends together (typically 1-2 seconds)
- Arc current and duration optimized for fiber type
- Splicer estimates splice loss based on alignment and arc parameters
- Install heat-shrink splice protector immediately
- Heat to shrink and activate adhesive (60-90 seconds)
- Store in splice tray with proper bend radius management
- Document splice location and test results
Comparison of Techniques
| Technique | Cost per Splice | Equipment Cost | Skill Required | Weather Sensitive | Typical Application |
|---|---|---|---|---|---|
| Fusion Splice | $2-5 | $15K-$50K | High | Moderate | All permanent installations |
| Mechanical Splice | $25-50 | $500-$2K | Moderate | Low | Emergency repairs, FTTH |
| Connector Install | $10-30 | $200-$1K | Moderate | Low | Temporary, testing |
| Cable Replacement | $50-200/meter | Varies | High | High | Extensive damage |
Real-World Application Scenarios
Detection: Network monitoring system alerts on LOS within 30 seconds
Localization: OTDR from both ends identifies break at 8.7 km from central office
Response: Field technician dispatched with splice truck and OTDR
Repair: Excavate, expose damage, install 2 new splice points with fusion splicer
Verification: OTDR confirms 0.08 dB loss per splice, link restored
Total Time: 4.5 hours from detection to service restoration
Detection: Continuous monitoring detects fault immediately
Localization: OTDR from both shore stations triangulates break position
Response: Cable ship mobilized (3-5 days to arrive on site)
Repair: Cable recovered using grappling hooks, cut, new section spliced in
Additional Cable: 2.5× water depth added (5 km for 2000m depth)
Total Time: 12-21 days from fault to restoration
Design Guidelines & Methodology
Step-by-Step Design Process
Phase 1: Network Assessment & Requirements
1. Availability Requirements- Define target availability (99.9%, 99.99%, 99.999%)
- Calculate maximum acceptable downtime per year
- Identify mission-critical vs. best-effort services
- Document SLA commitments and penalty structures
- Analyze historical break data for region/route
- Identify high-risk zones (construction areas, seismic regions)
- Evaluate environmental factors (temperature, moisture, seabed conditions)
- Calculate expected break rate (typically 0.05-0.2 breaks/100km/year)
- Map technician locations and response times
- Inventory repair equipment and spare cables
- Define escalation procedures for after-hours
- Estimate MTTR for different break scenarios
Phase 2: Protection Architecture Design
Methodology for Selection:| Requirement | Recommended Architecture | Rationale |
|---|---|---|
| Availability > 99.999% | 1+1 Protection + Diverse Routing | Zero traffic loss, sub-50ms recovery |
| Availability 99.9-99.99% | Ring or Mesh Restoration | Balance cost vs. recovery time |
| Cost-optimized | Shared Protection (1:N) | Minimize fiber usage, acceptable risk |
| Multi-site connectivity | Ring Topology | Bidirectional protection, scalable |
Decision Framework
IF: Service revenue loss > $10K/hour
THEN: Implement 1+1 dedicated protection
REASONING: Protection cost justified by business impact
IF: Geographic diversity available
THEN: Route working and protection paths separately
REASONING: Eliminates single point of failure
IF: Multiple breaks unlikely to be simultaneous
THEN: Consider shared protection (1:N)
REASONING: Reduces fiber requirements by 50-80%
IF: Submarine or remote installation
THEN: Design for extended MTTR (weeks)
REASONING: Repair logistics require significant time
Practical Design Example
Case Study: Metropolitan Ring Network
Requirements:- Connect 4 data centers in 80 km ring
- Target availability: 99.99% (52 minutes downtime/year)
- Capacity: 10 Gbps per site
- Budget: $500K for protection infrastructure
- Topology: Bidirectional ring with automatic protection switching
- Fiber: 12-fiber cable, 6 fibers clockwise, 6 counter-clockwise
- Recovery: <50ms automatic switching on fiber break detection
- Monitoring: Continuous OTDR at each site
Expected breaks: 80 km × 0.1 breaks/100km/year = 0.08 breaks/year
MTTR: 6 hours average
Annual downtime: 0.08 × 6 = 0.48 hours = 28.8 minutes
Achieved availability: 99.995% ✓ (exceeds target)
Design Checklist
| Design Element | Consideration | Best Practice | Verification Method |
|---|---|---|---|
| Route Planning | Physical separation of paths | >100m separation minimum | GIS mapping, site surveys |
| Cable Selection | Environment appropriate | Armored for high-risk areas | Manufacturer specifications |
| Splice Points | Accessibility for repair | Document GPS coordinates | GIS database, as-built drawings |
| Monitoring | 24/7 fault detection | Automated OTDR or power monitoring | Alarm system testing |
| Spare Inventory | Repair readiness | 10% of route length as spares | Inventory management system |
| Documentation | Complete as-built records | Digital maps, splice logs, test results | Annual audit |
Common Pitfalls to Avoid
Working and protection paths share common duct or pole line. Single backhoe event takes out both paths.
✓ Solution: Ensure minimum 100m physical separation, use different rights-of-way, cross streets at different locations.
Outdoor splice enclosures not properly sealed, leading to water ingress and corrosion.
✓ Solution: Use IP68-rated enclosures, heat-shrink splice protectors, and proper cable strain relief.
Fiber routes not accurately mapped, leading to prolonged MTTR during breaks.
✓ Solution: GPS-tag all splice points, maintain digital as-built drawings, update after every change.
Relying on customer reports for fault detection, increasing downtime.
✓ Solution: Implement continuous monitoring with automated alarming for LOS, high attenuation, and optical power degradation.
Assuming rapid repair without considering after-hours, weather, or access issues.
✓ Solution: Use realistic MTTR based on historical data, include worst-case scenarios in availability calculations.
Interactive Simulators
Practical Applications & Case Studies
Case Study 1: Urban Fiber Cut During Construction
Challenge Description
Scenario: Major telecommunications provider experiences complete service outage on primary fiber route serving downtown business district. Construction crew accidentally severed 144-fiber cable while excavating for new building foundation.
Impact:
- 3,500 business customers affected
- Estimated revenue loss: $45,000 per hour
- SLA penalty exposure: $125,000
- Break location: 8.7 km from central office in congested urban area
Solution Approach
Immediate Actions (0-15 minutes):
- Network monitoring system detected LOS alarms on 48 affected circuits
- Automated protection switching activated, rerouting 30% of traffic to backup ring
- NOC dispatched OTDR technician to CO for fault localization
- Customer communication system activated with status updates
Localization Phase (15-45 minutes):
- OTDR from both ends triangulated break at 8.734 km
- GIS system identified location as active construction zone
- Field supervisor coordinated with construction company for site access
- Splice truck with crew of 3 technicians dispatched
Repair Execution (2-5 hours):
- Excavation revealed complete cable severance with 2-meter section damaged
- Decision: Install cable slack loop with two splice enclosures
- 144 fibers re-spliced using two 6-ribbon fusion splicers (parallel operation)
- Each splice tested with OTDR for quality verification
- Average splice loss: 0.08 dB (within specification)
Implementation Details
| Activity | Duration | Resources | Cost |
|---|---|---|---|
| Detection & Localization | 45 minutes | 1 OTDR technician | $150 |
| Mobilization & Site Access | 75 minutes | Splice truck, 3 technicians | $800 |
| Cable Preparation | 60 minutes | Hand tools, cleaning supplies | $200 |
| Fusion Splicing | 120 minutes | 2 fusion splicers, supplies | $1,500 |
| Testing & Verification | 45 minutes | OTDR, power meter | $250 |
| Total | 5.75 hours | - | $2,900 |
Results and Benefits
- Service Restoration: All circuits restored within 6 hours of initial outage
- Customer Impact: 70% of traffic maintained via protection switching during repair
- Quality: Post-repair link budget within 0.5 dB of original specifications
- SLA Compliance: Met 8-hour restoration SLA, avoided penalties
- Process Improvement: Worked with construction company to implement fiber locate procedures
- Total Revenue Loss: $270,000 (6 hours $\times$ $45,000$), offset by protection switching
Case Study 2: Submarine Cable Break - Transatlantic Route
Challenge Description
Scenario: Fishing trawler anchor damages submarine cable 450 km from shore in 2,400-meter water depth on critical transatlantic route carrying 8 Tbps of international traffic.
Impact:
- Complete loss of 4 fiber pairs (50% system capacity)
- Affects financial transactions, cloud services, video streaming
- Estimated economic impact: $2M per day
- Required maritime repair operation
Solution Approach
Phase 1: Detection & Rerouting (0-5 minutes):
- Shore-based monitoring detected immediate LOS on affected fiber pairs
- Automated Fast Reroute (FRR) diverted traffic to parallel cable system
- 99.8% of traffic successfully rerouted with <100ms interruption
- OTDR from both shore stations confirmed break location
Phase 2: Logistics & Mobilization (Days 1-5):
- Cable ship contracted and mobilized from European port
- Weather window analyzed - 7-day clear period identified
- Spare cable sections loaded (15 km of spare required for deep water repair)
- Repair crew assembled: 25 marine technicians and deck crew
- Permits obtained for marine operations
Phase 3: Cable Recovery (Days 6-10):
- Ship positioned using GPS coordinates from OTDR data
- Grappling hook deployed to locate and retrieve damaged cable section
- Cable cut on both sides of damage point and brought aboard
- 18-hour operation to recover cable in challenging deep-water conditions
Phase 4: Splicing & Re-lay (Days 11-14):
- 15 km new cable section spliced to existing ends
- All 4 fiber pairs spliced using shipboard fusion equipment
- Cable paid out and re-laid on seabed
- Burial plow used in shallow approach areas
Results and Benefits
- Total Repair Time: 16 days from fault to full restoration
- Service Continuity: Zero customer-visible impact due to diverse routing
- Repair Quality: All splices within 0.10 dB specification
- Total Cost: $3.2M (ship mobilization, crew, materials)
- Long-term Fix: Cable burial reduced future fishing gear risk by 90%
- Lessons Learned: Enhanced seabed survey and route planning for new builds
Case Study 3: Data Center Interconnect Fiber Damage
Challenge
Hyperscale cloud provider discovered micro-cracks in fiber interconnecting two data centers due to improper bend radius in cable tray installation. Links showed intermittent errors and gradual performance degradation over 3 weeks.
Solution
Proactive OTDR monitoring detected 12 dB loss increase at 2.3 km point. Visual inspection revealed tight bend (8mm radius vs. 30mm minimum spec). Re-routed cable with proper bend management, replaced 5-meter section. Preventive inspection of all data center fiber runs prevented additional failures.
Results
- Proactive repair prevented complete outage
- Zero customer impact during maintenance window
- Network-wide audit found and corrected 23 similar issues
- New installation standards implemented
Troubleshooting Quick Reference
| Symptom | Likely Cause | Diagnostic Tool | Typical Resolution | Time Required |
|---|---|---|---|---|
| Complete LOS | Fiber break | OTDR from both ends | Fusion splice repair | 4-8 hours |
| High attenuation (10-20 dB) | Tight bend or crack | OTDR, visual inspection | Re-route or splice | 2-4 hours |
| Intermittent errors | Poor splice or connector | OTDR, fiber microscope | Re-splice or clean | 1-2 hours |
| High reflection | Dirty connector | ORL meter, microscope | Clean and inspect | 15-30 minutes |
| Gradual degradation | Water ingress, aging | Trend analysis, OTDR | Preventive replacement | 4-6 hours |
| No visible light (VFL) | Break in first 3 km | VFL, physical trace | Locate and splice | 2-3 hours |
Professional Recommendations
- Implement continuous monitoring with automated alarming
- Maintain accurate GIS documentation of all fiber routes
- Use diverse routing for mission-critical services
- Regular preventive maintenance and inspection programs
- Coordinate with utility locating services before excavation
- Install adequate fiber slack at splice points for future repair
- Use armored cable in high-risk areas
- Train field staff on proper installation techniques
- Maintain 24/7 on-call technician rotation
- Pre-stage repair equipment in strategic locations
- Stock 10-15% of route length as spare cable
- Establish relationships with excavation contractors
- Pre-plan access routes to all splice points
- Conduct regular emergency response drills
- Maintain vendor relationships for specialized equipment

Optical Communications & Network Automation Expert | Author of 3 Books for Optical Engineers | Founder, MapYourTech
Optical networking engineer with nearly two decades of experience across DWDM, OTN, coherent optics, submarine systems, and cloud infrastructure. Founder of MapYourTech. Read full bio →
Follow on LinkedIn