
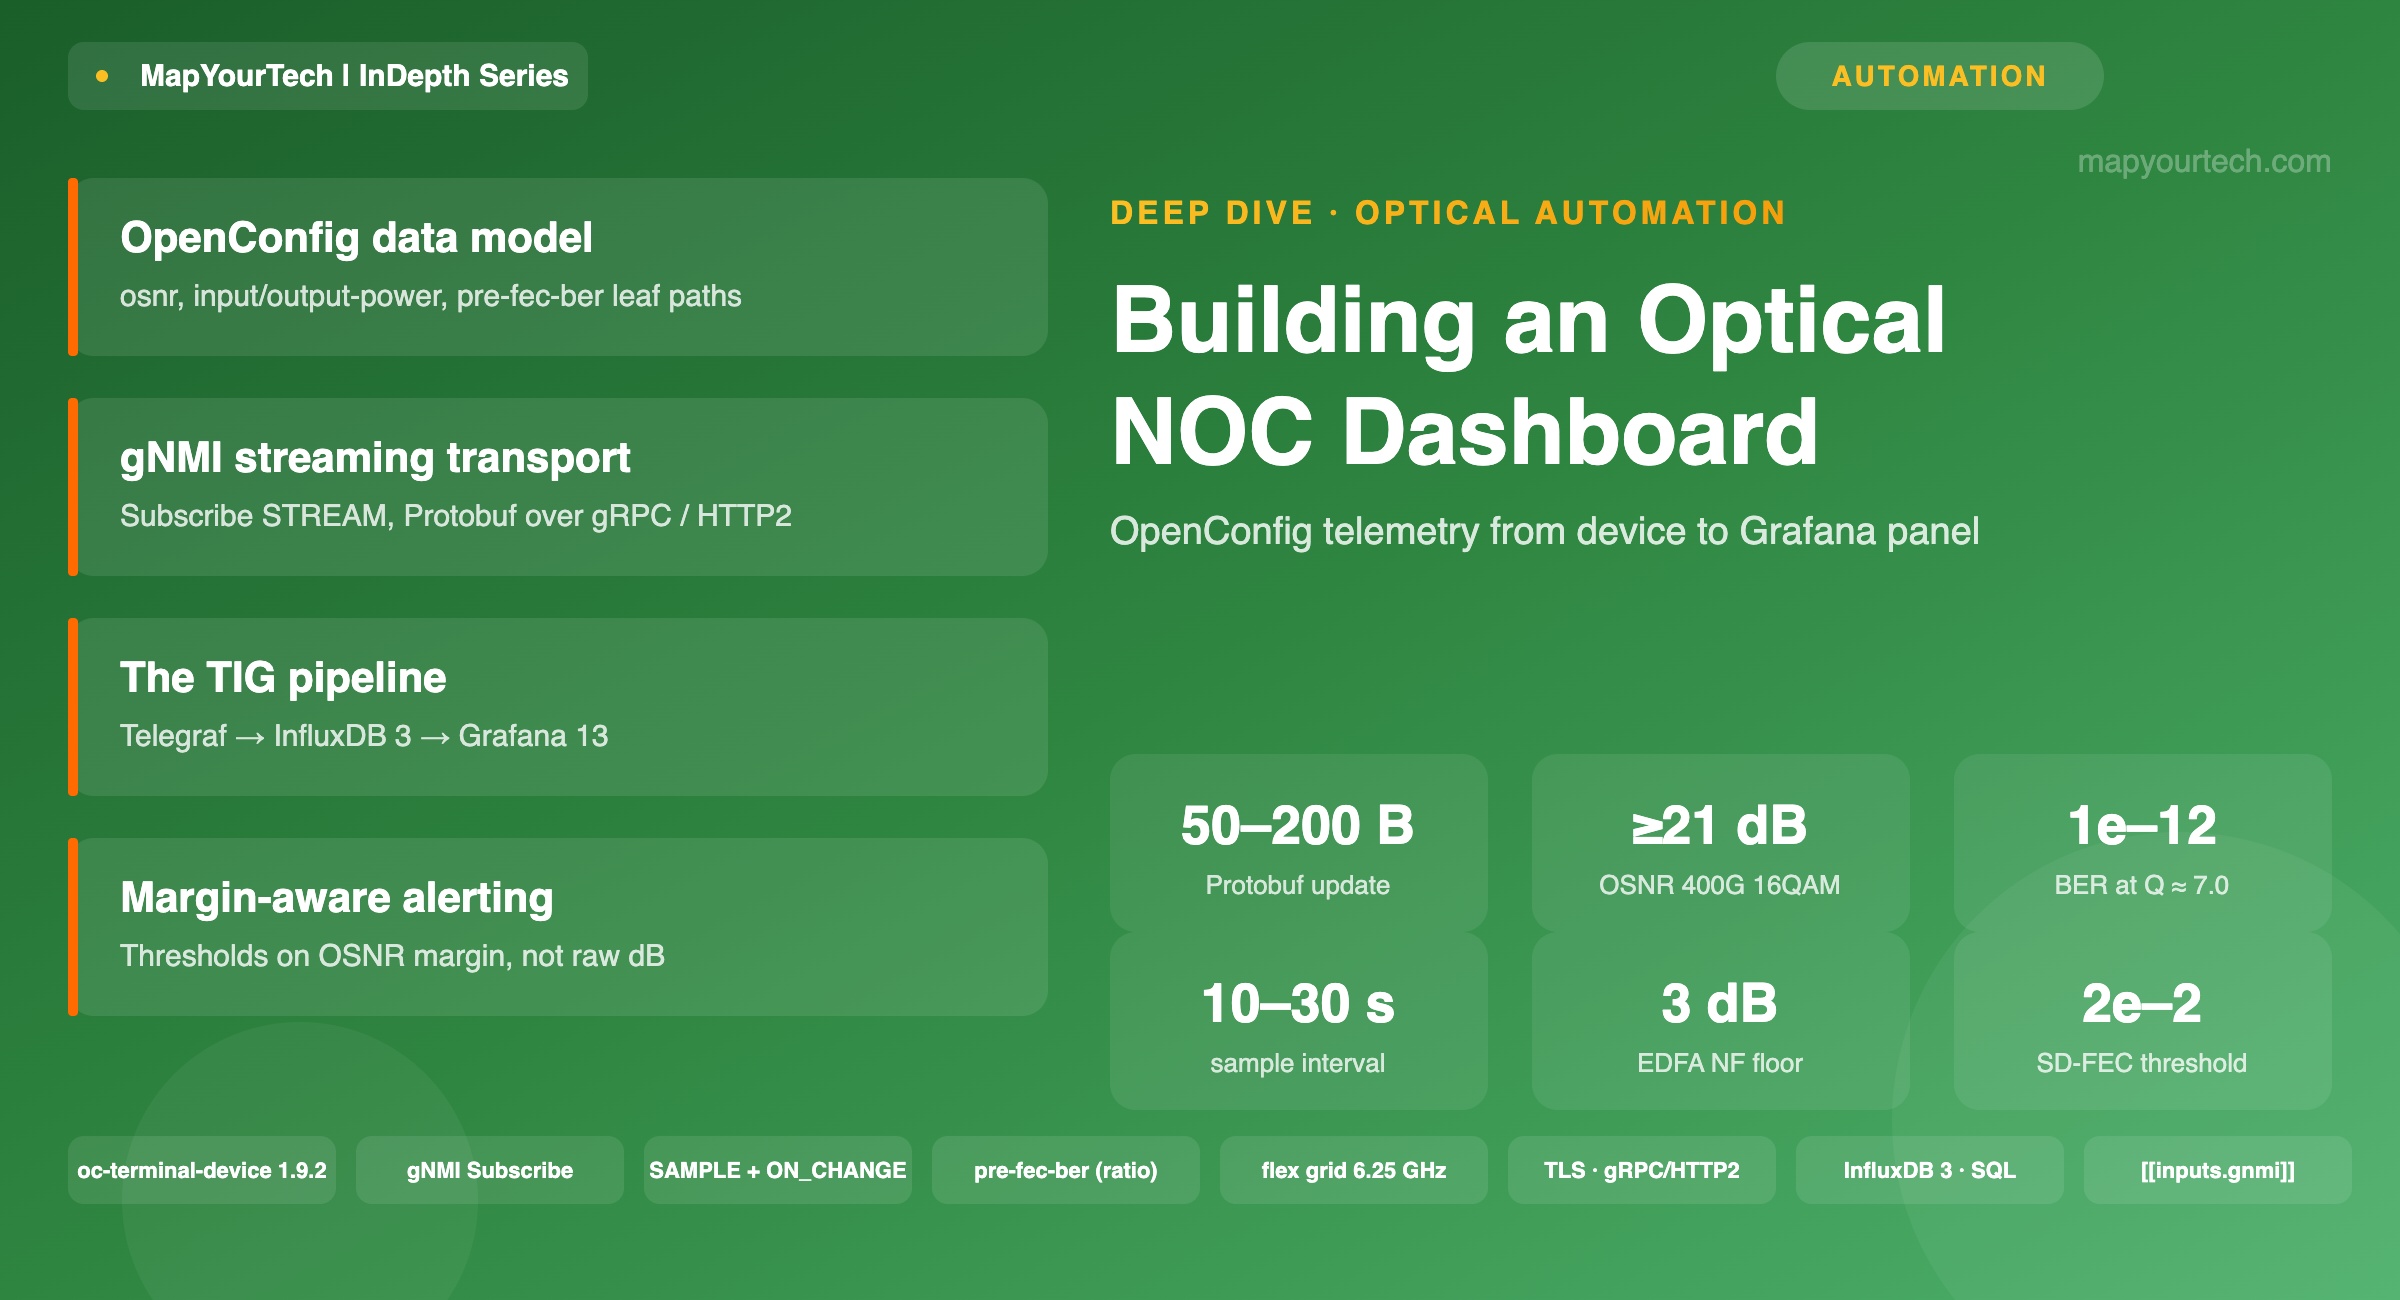
Building an Optical NOC Dashboard with OpenConfig Telemetry
A full build path from a coherent transponder's optical-channel state to a live operations dashboard: gNMI subscriptions against OpenConfig models, a Telegraf collector, an InfluxDB 3 time-series store, and Grafana panels that show OSNR, optical power, and pre-FEC BER trends against margin-aware thresholds.
1. Introduction
A coherent transponder on a modern line system reports its own health continuously. A single 400G or 800G line card exposes received optical power, launch power, chromatic dispersion, differential group delay, laser bias current, polarization-dependent loss, optical signal-to-noise ratio, and pre-forward-error-correction bit error rate, and it can produce well over a hundred distinct readings per second when asked. The question a network operations center faces is not whether the data exists. It is how to get that data off the device at the rate the physics changes, land it in a store that can hold months of per-channel history without collapsing, and put it in front of an engineer as a trend they can act on before a wavelength drops.
The legacy answer was the Simple Network Management Protocol. An SNMP manager polls each agent on a timer, walks an OID tree, and pulls a snapshot. That model was built for interface counters that change slowly, and it breaks on two fronts for optical assurance. Polling introduces a fixed floor on how often you can observe a value, so a fast pre-FEC BER excursion between polls is simply invisible. And the manager, not the device, decides the schedule, which means the moment a signal starts to degrade is exactly the moment the manager has no way to know it should look sooner. The industry response is streaming telemetry: the device pushes values on a subscription, either at a fixed sample interval or on change, over a modern transport, using a vendor-neutral data model. In practice that means OpenConfig YANG models carried by the gRPC Network Management Interface (gNMI).
This article builds the receiving end. The target is a working optical NOC dashboard on the open-source TIG stack, named for its three components: Telegraf as the collector, InfluxDB as the time-series database, and Grafana as the visualization and alerting layer. The path runs device to gNMI subscription to Telegraf to InfluxDB to Grafana panel, and the article covers each hop at the level of detail you need to reproduce it: the exact OpenConfig paths for OSNR, power, and BER; the Telegraf subscription configuration and how it maps a gNMI update into a database row; the InfluxDB schema decisions that keep cardinality bounded; and the Grafana panel and threshold design that turns three numbers into an operational signal. It closes with the physics those thresholds encode, the scaling limits that decide your sample interval, and the failure modes that bite in production.
The intended reader spans the range from an engineer standing up their first telemetry collector to an architect sizing a fleet-wide assurance platform. Foundations are explained where they appear, and the depth is set for someone who already knows what a dB is and wants the specific paths, the specific config, and the specific numbers.
Takeaway: Streaming telemetry moves the observation schedule from the manager to the device. That single change is what lets an OSNR or pre-FEC BER trend be captured at the rate it actually moves, which is the precondition for acting before a channel fails rather than after.
2. The OpenConfig optical data model
Before any transport or dashboard, there has to be an agreed structure for the data. OpenConfig provides it. The models are vendor-neutral YANG trees that carry configuration and operational state in one structure, so a controller or collector addresses the same path on a Cisco, Ciena, Nokia, Juniper, or Infinera device and gets the same leaf back. For the optical layer the relevant modules are openconfig-platform and its transceiver submodule, openconfig-terminal-device for the client and line side of a transponder, openconfig-optical-amplifier for line-system gain stages, and openconfig-transport-types for the shared identities. As reference points on maturity: openconfig-terminal-device sits at version 1.9.2, openconfig-transport-types at 1.1.0, and openconfig-platform-transceiver at 0.17.0 — all standard-specified model versions published by the OpenConfig operator group. The point of the version numbers is not the numbers; it is that these models are stable enough that major vendors ship them in production rather than as previews.
The optical channel component
A wavelength in OpenConfig is a component. The device inventory under /components/component holds an entry whose state/type is OPTICAL_CHANNEL, and openconfig-terminal-device augments that component with an optical-channel subtree. That subtree is where the physical-layer performance monitors live. The leaves you build a dashboard on are, by their model paths:
- OSNR —
/components/component/optical-channel/state/osnr, a container reporting instant, average, minimum, and maximum values in dB. Standard-specified as a decimal value with two fraction digits. - Received (input) optical power —
/components/component/optical-channel/state/input-power, in dBm with two fraction digits, again as instant/avg/min/max. - Launched (output) optical power —
/components/component/optical-channel/state/output-power, in dBm. - Chromatic dispersion —
/components/component/optical-channel/state/chromatic-dispersion, in ps/nm, useful for spotting a path change. - Laser bias current —
/components/component/optical-channel/state/laser-bias-current, in mA, a leading indicator of transmitter aging.
Read the Full Analysis with Premium
The remaining 89% of this article — the design numbers, trade-offs and field guidance — is part of MapYourTech Premium, along with the full premium library, courses and professional tools.
You May Also Like

-
Free
-
September 4, 2026

-
Premium
-
September 4, 2026

-
Premium
-
September 4, 2026