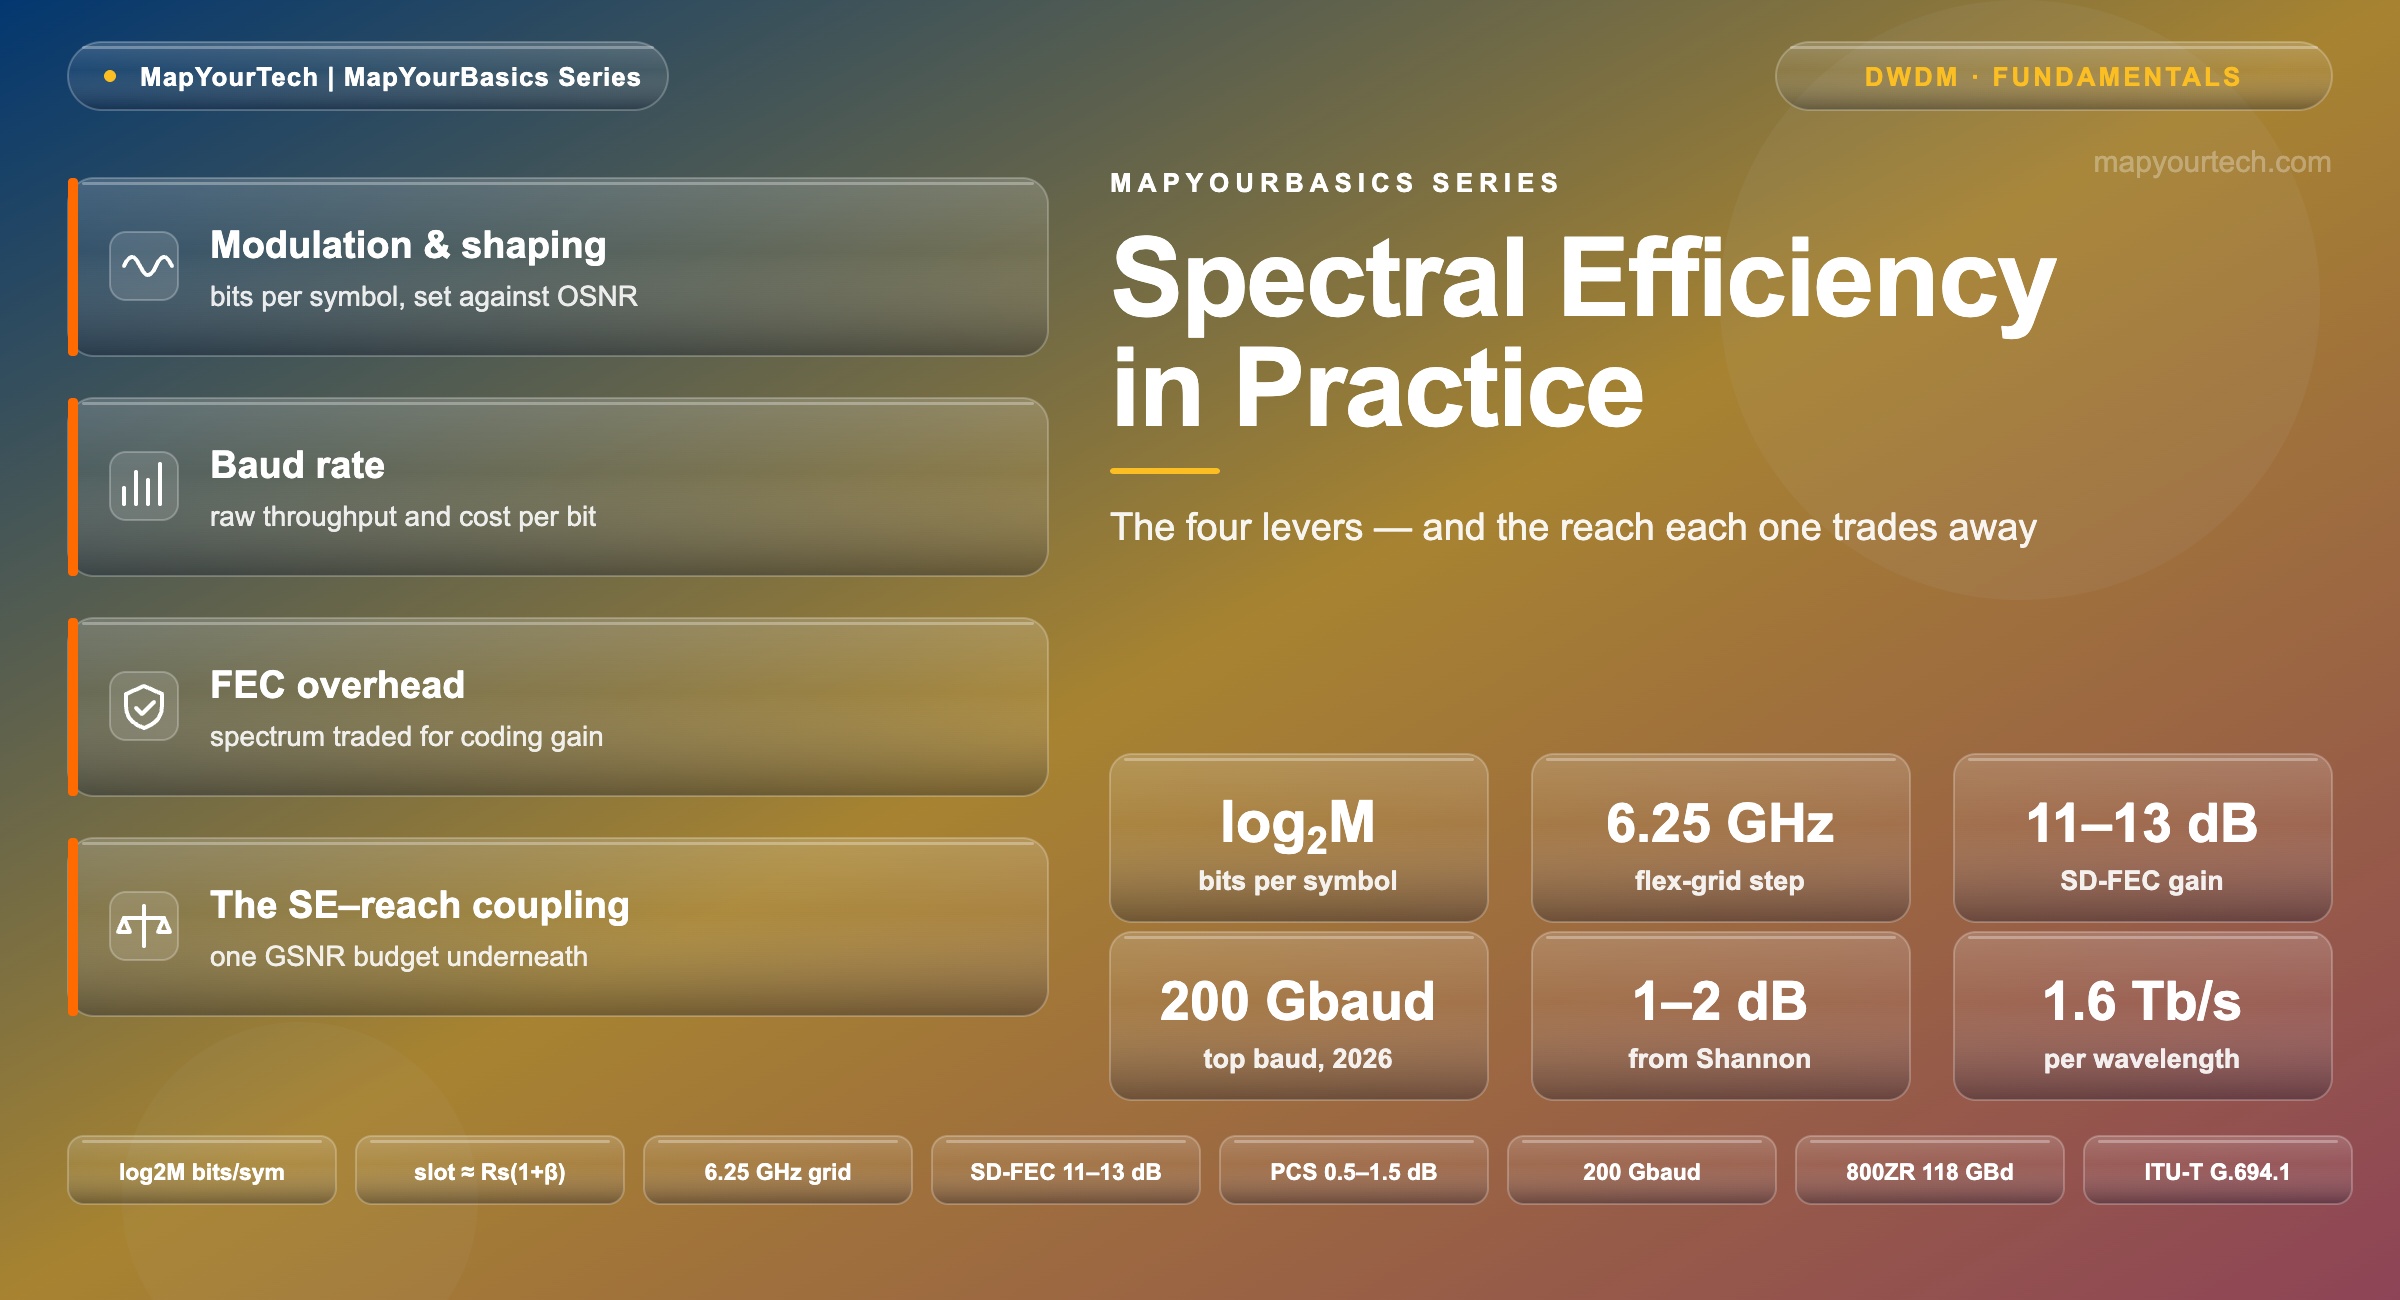
Spectral Efficiency in Practice: The Four Levers
Modulation order, baud rate, constellation shaping, and FEC overhead each add bits per second per hertz — and each one spends reach. Here is what each lever buys, what it costs, and where 2026 hardware sits against the Shannon bound.
1. Introduction
A fiber pair carries exactly two things multiplied together: how much spectrum you light, and how many bits each hertz of that spectrum moves. The second number is spectral efficiency, measured in bits per second per hertz (bits/s/Hz), and it is the multiplier every capacity plan turns on. Double the spectral efficiency and you double per-fiber capacity without laying a strand or adding an amplifier — which is why the metric drives cost per bit far more directly than raw line rate.
Four settings on a coherent transponder decide that number, and an engineer sizing a link touches all four: the modulation order (how many bits each symbol carries), the baud rate (how many symbols per second), the constellation shaping applied on top of the modulation, and the forward-error-correction (FEC) overhead wrapped around the payload. Each lever raises bits per hertz. Each one also raises the signal-to-noise ratio the receiver needs to close the link, and that requirement is what shortens reach. Spectral efficiency and reach are not independent dials; they are two readings off the same underlying quantity.
That coupling runs through one bound. The Shannon capacity of an additive-noise channel caps bits per hertz at a function of signal-to-noise ratio, and modern coherent systems already sit within a couple of decibels of it. Once a link is that close to the ceiling, turning any lever harder no longer adds meaningful efficiency — it only shifts the trade between capacity and distance. The useful skill is knowing which lever to turn for a given route, and when the honest answer is to stop turning levers and add spectrum instead.
This article defines spectral efficiency precisely, works each of the four levers with the reach it trades away, shows how they combine through required optical signal-to-noise ratio (OSNR), and closes on where the 2026 generation of coherent hardware — 200 Gbaud modems, 1.6 Tb/s single-carrier wavelengths, and the emerging 1600ZR pluggables — actually lands on the efficiency-versus-reach map.
2. What Spectral Efficiency Measures
Spectral efficiency is net information rate divided by the optical bandwidth the signal occupies. The net rate is what leaves the FEC decoder as usable client bits, not the raw line rate on the fiber; the occupied bandwidth is the spectral slot the channel consumes on the grid, not the theoretical Nyquist minimum. Keeping both in their honest form — net bits over occupied hertz — is what separates a real efficiency figure from a marketing one.
Occupied bandwidth follows the symbol rate directly. A root-raised-cosine pulse at symbol rate Rs occupies roughly Rs(1 + β), where β is the roll-off factor. Modern DSPs run low roll-off, typically 0.05 to 0.1, so the occupied slot sits just above the baud rate in gigahertz — a 130 Gbaud carrier needs on the order of 137 to 143 GHz of clean spectrum. That near-equality of gigabaud and gigahertz is worth holding onto; it is the reason raising baud does not, by itself, raise efficiency.
The ceiling on bits per hertz is the Shannon limit for the fiber channel. For an additive white Gaussian noise channel the capacity per unit bandwidth is a function of signal-to-noise ratio, and it is a theoretical bound no code can beat.
C is channel capacity (bit/s), B is bandwidth (Hz), SNR is the linear signal-to-noise ratio. In coherent fiber the relevant SNR is the generalized signal-to-noise ratio (GSNR), which folds amplifier noise and nonlinear interference into one quantity. No modulation, shaping, or FEC choice moves this bound — they only decide how close the system gets to it.
In real fiber the SNR that matters is the generalized signal-to-noise ratio. Coherent detection moved dispersion compensation out of the line and into the receiver DSP, so the impairments left standing are amplified-spontaneous-emission (ASE) noise from the optical amplifiers and nonlinear interference (NLI) generated by the signal itself at high launch power. The Gaussian Noise model treats that nonlinear interference as an extra Gaussian noise term, which lets the design collapse to a single GSNR figure per channel.
That model holds once chromatic dispersion has decorrelated the signal phases, which happens within the first couple of spans of an uncompensated coherent link, and it weakens for very low-baud carriers and for fiber with low dispersion. Inside its range it is accurate enough that GSNR-based planning is how flexible-rate links are dimensioned in practice.
PASE accumulates with span count and amplifier noise figure; PNLI grows with launch power. Every lever that raises spectral efficiency raises the GSNR the receiver needs to hit its pre-FEC error threshold — that is the mechanism by which efficiency costs reach.
Two standards frame the spectrum side. ITU-T G.694.1 fixes the DWDM grid: fixed spacings of 12.5, 25, 50, and 100 GHz anchored at 193.1 THz, plus a flexible grid with a nominal central-frequency granularity of 6.25 GHz and a slot-width granularity of 12.5 GHz (both standard-specified). The flexible grid is what lets a wide carrier take exactly the slot it needs instead of rounding up to a fixed 50 or 100 GHz lane — the mechanism that keeps high-baud channels from wasting guard band. The C-band spans roughly 191.5 to 196.2 THz and the L-band roughly 186.0 to 191.5 THz (standard-referenced), and lighting the L-band is the capacity lever operators reach for once the DSP has no efficiency left to give.
Takeaway: Spectral efficiency is net client bits over occupied slot width, bounded by log2(1 + GSNR). Occupied width tracks the baud rate, so the only way any lever adds efficiency is by extracting more bits per hertz at a fixed GSNR — and every one of them raises the GSNR the receiver demands in exchange.
3. The Four Levers, One at a Time
The signal chain below shows where each lever sits between client bits and the optical carrier. Reading left to right, FEC wraps the payload, the distribution matcher applies constellation shaping, the mapper picks the modulation order, and pulse shaping plus the digital-to-analog converter set the baud rate before the dual-polarization modulator launches the carrier. Polarization multiplexing doubles the count at the end for free — a fixed factor of two rather than a lever you tune.
3.1 Modulation order — the raw bit count
Modulation order M sets bits per symbol as log2M: QPSK carries 2, 8QAM carries 3, 16QAM carries 4, 32QAM carries 5, and 64QAM carries 6. Doubling the constellation adds one bit per symbol, and the geometry of the constellation diagram is exactly why that bit is expensive. Packing more points into the same in-phase/quadrature plane shrinks the minimum Euclidean distance between them, so a smaller noise excursion is enough to land a symbol in the wrong decision region. The cost shows up as required OSNR: as a working rule of thumb, each step up in modulation order asks for roughly 3 dB more OSNR (measured, and it varies with baud rate and FEC choice).
Three decibels of extra OSNR is a large fraction of a link budget. On a long amplified chain, ASE accumulates span by span, and buying back 3 dB can mean dropping several spans of reach or adding a regeneration site. That is the whole reason long-haul routes default to QPSK while data-center interconnect (DCI) links, where the whole path is a few tens of kilometers and OSNR is abundant, run 16QAM or 64QAM.
Practical Example — A metro operator has a 240 km regional span with about 20 dB of OSNR margin at the receiver. QPSK would waste that margin, and 64QAM would run out of it. 16QAM sits in the middle: 4 bits per symbol, a required OSNR the span can supply, and enough headroom left for aging and filter penalties. The same transponder pushed to 64QAM on this route would fail not because the DSP cannot generate the constellation, but because the span cannot deliver the roughly 7 dB of additional OSNR the denser constellation needs.
3.2 Baud rate — throughput without efficiency
Baud rate is the symbol rate Rs, and raising it is the most direct way to move more bits: a 200 Gbaud carrier moves roughly 1.5 times the raw rate of a 130 Gbaud one at the same modulation. What it does not do is raise spectral efficiency, because the occupied slot widens in step. With low roll-off the slot is about Rs(1 + β), so gigabaud and gigahertz track each other and the bits-per-hertz ratio barely moves. Nokia's own framing of this is blunt: higher baud rates are slightly negative for spectral efficiency, because the spectrum grows in proportion to the rate (vendor position).
What baud actually buys is cost per bit and reach at a fixed data rate. Fewer, faster carriers mean fewer transponders, fewer amplifier ports, and fewer add/drop ports per terabit — and because a high-baud carrier can hit a target bit rate at a lower modulation order, it can reach farther than a low-baud carrier forced into a denser constellation for the same rate. Ciena states that its WaveLogic 6 Extreme reaches 200 Gbaud on a 3 nm CMOS DSP (vendor claim), roughly a year after 1.2 Tb/s single-carrier modems arrived at about 140 Gbaud from several vendors (industry-published).
Practical Example — Filling a 4.8 THz C-band shows the geometry. At 30-plus gigabaud in 50 GHz slots, the band holds about 96 wavelengths; with 250 Gbaud 1.6 Tb/s carriers in 300 GHz slots, the same band holds only about 16 (illustrative figures, Nokia). Total capacity per fiber can still rise because each carrier moves far more, but the count of wavelengths collapses — which is why high-baud designs pair naturally with direct-attach and colorless-directionless-contentionless nodes that no longer need hundreds of add/drop ports.
3.3 Constellation shaping — the fractional bit
Uniform QAM forces bits per symbol to integers, so moving from 16QAM to 64QAM jumps two whole bits and a large chunk of required OSNR at once. Probabilistic constellation shaping (PCS) removes that quantization. A distribution matcher makes low-amplitude constellation points more frequent than high-amplitude ones, which lowers the average transmit power for a given information rate and lets the entropy — the effective bits per symbol — land anywhere between orders. The same 64QAM hardware can be shaped to behave like anything from near-QPSK to full 64QAM with fine steps, adjusted in software against the measured OSNR of the route.
The payoff is both flexibility and a shaping gain. By spending power on the symbols that survive noise best, PCS moves the system 0.5 to 1.5 dB closer to the Shannon bound at a given rate (industry-published), which converts directly into reach or into a slightly higher rate at the same reach. It is now a standard block in shipping DSPs: Nokia describes third-generation PCS in its PSE-6s engine, jointly optimized with the FEC (vendor claim). Shaping is the lever that turns the coarse staircase of Levers 1 into a continuous spectral-efficiency-versus-reach curve.
Practical Example — A single 800G transponder serves two routes from one line card. On a 400 km regional hop it runs lightly shaped 64QAM for high efficiency; on a 1,500 km long-haul hop the operator dials the shaping toward a lower entropy, trading bits per symbol for the extra decibel or two of margin the longer path needs — no hardware change, no format swap, just a shaping parameter set against the link's live OSNR.
3.4 FEC overhead — paying spectrum to buy margin
FEC wraps the payload in redundancy so the decoder can correct errors, and the overhead ratio is the redundant fraction. A code of rate k/n spends (n−k)/n of the line rate on parity, which lowers net spectral efficiency — but it buys a large net coding gain that lets the whole link run at a lower OSNR. Soft-decision FEC in modern coherent transponders delivers a net coding gain of 11 to 13 dB, against roughly 6 to 9 dB for the hard-decision codes used in most direct-detect systems (industry-published). That gap is the reason coherent links reach so much farther than intensity-modulated ones at the same rate.
The overhead is not free efficiency lost — it is efficiency converted into distance. Because SD-FEC lets the receiver operate at a pre-FEC bit error ratio around 1 to 2 × 10⁻² and still deliver a post-FEC error floor below 10−15 (industry-published), the working OSNR target drops by more than a decibel, which usually recovers more reach than the parity overhead cost in efficiency. Standardized FEC anchors this: the OTN line code specified as RS(544,514) in the ITU-T G.709 family provides the framed baseline (standard-specified), while the open FEC used across 400G and 800G pluggables carries the 11-to-13 dB class of gain into the interoperable ecosystem.
Practical Example — Two 800G configurations reach the same client rate. One runs a lighter FEC overhead and a denser modulation for maximum efficiency on a short DCI link; the other runs a heavier open-FEC overhead with the same modulation on a regional link, accepting a few percent lower net efficiency to gain the coding margin that carries the signal past the extra spans. The client sees identical 800GbE; the line side made opposite bets on the efficiency-versus-reach trade.
Takeaway: Modulation order and shaping raise bits per symbol and cost OSNR; baud raises raw throughput and cost per bit but is nearly efficiency-neutral; FEC overhead lowers net efficiency but returns it as reach through coding gain. Three of the four levers push against the same OSNR budget, which is why they can only be set together.
4. How the Levers Combine
Net spectral efficiency is what falls out when all four levers are set at once, on both polarizations, divided by the slot the carrier occupies. Writing it out makes the couplings explicit.
The factor of 2 is dual polarization. log2M is Lever 1 (modulation order). RFEC is the code rate, so a heavier Lever 4 overhead lowers it. Hshape is the shaping factor from Lever 3 (1 for uniform QAM, below 1 for shaped constellations that trade rate for gain). β is the roll-off tied to Lever 2 — note the baud rate itself cancels, which is the algebra behind its efficiency-neutrality. Units are bits/s/Hz.
The chart below shows the two coupled readings across formats: net efficiency climbs with modulation order, and the OSNR the receiver needs climbs alongside it. Read together, they are the trade — there is no operating point that raises the blue bars without raising the orange line.
| Format | Bits/symbol | Net SE (bits/s/Hz) | Req. OSNR (dB, approx.) | Typical application |
|---|---|---|---|---|
| QPSK | 2 | 3.0 | 13 | Long-haul, subsea |
| 8QAM | 3 | 4.5 | 16.5 | Long-haul, regional |
| 16QAM | 4 | 6.0 | 20 | Metro, regional |
| 32QAM | 5 | 7.5 | 23.5 | Metro, short DCI |
| 64QAM | 6 | 9.0 | 27 | DCI, short reach |
Efficiency figures are computed from the net-SE formula; OSNR figures are representative and shift with baud rate, shaping, and FEC. The spread across a real mixed-rate line system is wide — a QPSK long-haul channel and a shaped-64QAM metro channel can differ by well over a decibel-decade in required OSNR while sharing the same amplifier chain, which is the central tension in mixed-rate design.
Placing the formats on a reach axis turns the trade into a map. The efficiency-rich formats live short and left; the reach-rich formats live long and right; the four levers move a design along the band between them.
Once a design is pressed against that dashed bound — and modern coherent systems already run within 1 to 2 dB of the linear Shannon limit (industry-published) — the levers stop paying out. Squeezing another fraction of a bit per hertz costs more OSNR than the link can spare. At that point the honest move is to change what is being divided: light more spectrum. Turning on the L-band alongside the C-band roughly doubles the lit bandwidth, and it is the reason C+L and Super-C line systems have become the default answer to capacity growth rather than ever-denser modulation.
Takeaway: The four levers trace one band on an efficiency-versus-reach map, and the Shannon bound caps it. When a route already runs near the bound, adding spectrum (L-band, Super-C, more fiber pairs) returns more capacity than any further turn of the modulation, shaping, or FEC lever.
5. Where the 2026 Hardware Sits
The current generation of coherent modems pushed all four levers at once, and the headline is baud rate. Ciena's WaveLogic 6 Extreme runs the industry's first 200 Gbaud electro-optics on a 3 nm CMOS DSP, delivering up to 1.6 Tb/s on a single carrier with a stated 15% improvement in spectral efficiency and about a 50% cut in power per bit versus the prior generation (vendor claims). The efficiency gain came from shaping and FEC refinements, not from the higher baud — consistent with the algebra, the extra baud went to capacity and reach, not to bits per hertz.
The rest of the field runs a similar recipe on different silicon. Nokia's PSE-6s operates at 130 Gbaud on a 5 nm DSP with third-generation PCS across shaped 16QAM and 64QAM and continuously tunable baud and FEC (vendor claims), and the ICE7 engine from the combined Nokia-Infinera portfolio reaches up to 1.2 Tb/s per wavelength at up to about 140 to 148 Gbaud (vendor and industry-published). An earlier data point sets the efficiency scale: Nokia's ICE6 quotes about 8.833 bits/s/Hz with 800G wavelengths, filling roughly 42.4 Tb/s in the C-band and more than 80 Tb/s across C+L (vendor claim) — a concrete reminder that per-fiber capacity is spectral efficiency times lit bandwidth. Ribbon has entered the high-baud tier with its Apollo 9408 transponder (5 nm, 140 Gbaud, 400 Gb/s to 1.2 Tb/s per wavelength — vendor claim) and reported a 20 Tb/s-per-fiber-pair trial over roughly 10,000 km on a trans-Pacific cable (field trial).
Interoperable pluggables are following the embedded modems up the curve. The OIF 800ZR Implementation Agreement runs 118 Gbaud and is shipping in volume, and the next step is defined: the 1600ZR digital baseline (open FEC, 236 Gbaud) was approved in late 2025 with its implementation agreement due in 2026, and 1600ZR+ adds shaping and dual subcarriers at 252 Gbaud (OIF, in progress). First 1.6 Tb/s pluggables are expected around 2027, at roughly 32 to 40 W depending on the variant (industry-published). The lineage from 400ZR through 800ZR to 1600ZR is the same four levers wrapped in a multi-vendor spec so a pluggable from one supplier lands in another's router.
Field trials mark the frontier. A single-carrier 1.6 Tb/s wavelength has run over 736 km on a live terrestrial route, and a 1.2 Tb/s-per-wavelength transatlantic transmission has been demonstrated on a subsea cable using the WaveLogic 6 Extreme optics (field trials, vendor). These are the same physics worked in this article, pressed to the edge of the GSNR the routes can supply. Which supplier's DSP does the pressing is itself now a design choice, as the split between in-house and merchant coherent DSP architectures reshapes which companies build the modems.
Takeaway: The 2026 step to 200 Gbaud and 1.6 Tb/s single carriers moved raw capacity and cost per bit far more than spectral efficiency — efficiency gains now arrive in single-digit percentages from shaping and FEC, because the systems already run close to the Shannon bound.
6. Practical Deployment
Setting the four levers on a real route follows the GSNR budget in order. Estimate the GSNR the path can deliver from span loss, amplifier noise figure, span count, and the launch power that keeps nonlinear interference in check. Pick the modulation order and shaping that the GSNR supports with margin for aging and filter penalties. Choose the FEC overhead so the receiver sits comfortably below its pre-FEC error threshold. Set the baud rate to fill the flexible-grid slot the network plan allocated, not higher than the spectrum can hold cleanly. The order matters because every step but the last spends the same GSNR.
Mixed-rate line systems add a constraint the single-link view misses. When a QPSK long-haul channel and a shaped-64QAM metro channel share one amplifier chain, they share total output power, and the OSNR each needs differs by more than a decibel-decade. Per-channel power has to be balanced so the demanding channel gets its OSNR without starving the others — the practical reason mixed-rate planning leans on per-channel OSNR monitoring and pre-FEC BER telemetry rather than a single global power setting.
A few field patterns recur. Efficiency lower than the design predicted usually traces to guard band and filter roll-off eating into the occupied slot, or to a GSNR margin thinner than planned — check the actual roll-off and the cascaded filter penalty before blaming the modem. Reach shorter than expected on a high-power link often points to nonlinear interference: backing off launch power a decibel can raise GSNR when the link is past its nonlinear optimum. Wide high-baud carriers can also strand spectrum, leaving gaps too narrow for another wide slot, which is why defragmentation tooling matters more as carriers widen.
The vendor set for this is the publicly known field: Ciena, Nokia (with Infinera), Cisco and Acacia, Ribbon, Adtran, SmartOptics, PacketLight, ZTE, and Huawei among them. Most now expose the same levers — tunable baud, PCS entropy, and FEC gain — through their management interfaces, so the design work is choosing the operating point rather than negotiating with the hardware.
Takeaway: Set the levers against the route's GSNR budget in order — modulation and shaping first, then FEC, then baud to fill the slot — and in mixed-rate systems balance per-channel power so the highest-OSNR channel does not starve the rest of the amplifier chain.
7. Future Outlook
Baud rate has a public roadmap: the industry expects roughly 250 Gbaud around 2027 to 2028, 500 Gbaud near 2035, and 1,000 Gbaud after 2040 (industry projection). Each step lowers cost per bit and can extend reach at a fixed rate, but it keeps trading against efficiency because the slot widens with it. Spectral efficiency itself has less room to run — with systems already within 1 to 2 dB of the linear Shannon bound, the remaining gains come in small increments from better shaping, tighter FEC, and lower roll-off rather than from new modulation orders.
So the capacity lever shifts from bits per hertz to hertz. C+L and Super-C line systems, multiband transmission reaching into S-band, hollow-core fiber with lower loss and nonlinearity, and simply more fiber pairs are where the next order of magnitude comes from. The skills that follow are GSNR-based planning across bands, joint optimization of PCS and FEC against live link telemetry, and spectrum management for a world of fewer, wider, higher-capacity carriers. The four levers are not going away — they are being set closer to their limit, which shifts the advantage back to the spectrum they run in.
8. Reference
8.1 Formulas
Rs symbol rate; β roll-off; M modulation order; RFEC code rate; Hshape shaping factor (≤1); GSNR generalized signal-to-noise ratio.
8.2 Standards touchpoints
| Standard | What it fixes | Value used here |
|---|---|---|
| ITU-T G.694.1 | DWDM fixed and flexible grid | 6.25 GHz central-frequency, 12.5 GHz slot-width granularity; anchor 193.1 THz |
| ITU-T G-series Sup. 39 | Optical system design, GSNR | GSNR framework, OSNR measurement |
| ITU-T G.709 family | OTN framing and line FEC | RS(544,514) baseline line FEC |
| OIF 800ZR / 1600ZR | Interoperable coherent pluggables | 118 Gbaud (800ZR); 236 / 252 Gbaud (1600ZR / ZR+) |
8.3 Glossary
- Spectral efficiency (SE)
- Net information rate divided by the occupied optical bandwidth, in bits per second per hertz.
- Baud rate (symbol rate, Rs)
- Symbols transmitted per second; sets the occupied slot width and the raw line rate.
- GSNR
- Generalized signal-to-noise ratio; combines amplifier ASE noise and nonlinear interference into one figure that bounds achievable efficiency.
- PCS
- Probabilistic constellation shaping; biases the symbol distribution toward low-amplitude points to add a shaping gain and tune bits per symbol continuously.
- Net coding gain (NCG)
- The OSNR reduction a FEC code delivers at a target output error rate; 11 to 13 dB for modern soft-decision codes.
- Roll-off (β)
- The excess-bandwidth factor of the pulse shaping filter; low values (0.05 to 0.1) keep the slot close to the baud rate.
References
- ITU-T G.694.1 — Spectral grids for WDM applications: DWDM frequency grid, ITU-T Study Group 15.
- ITU-T G-series Supplement 39 — Optical system design and engineering considerations, ITU-T Study Group 15.
- ITU-T G.709 — Interfaces for the optical transport network, ITU-T Study Group 15.
- OIF — Implementation Agreement for 800ZR, Optical Internetworking Forum.
- Sanjay Yadav, "Optical Network Communications: An Engineer's Perspective" — Bridge the Gap Between Theory and Practice in Optical Networking.
Related Articles on MapYourTech