Connector and Splice Loss: A Field Engineering Reference
Typical insertion loss for FC/APC, LC/PC, and SC connectors and fusion and mechanical splices, how each figure enters a span loss budget, and the OTDR and OLTS methods that verify it in the field.
1. Introduction
A 42 km amplified span carries a fixed power budget: whatever the transmitter puts out, the receiver must see enough of it above its sensitivity floor, with margin left over for aging and repair. Fiber attenuation eats the largest share of that budget, but every connector pair and every splice along the route takes its own bite — typically fractions of a decibel each, but the fractions add up across a real outside-plant route with dozens of connection points. A design that ignores that arithmetic runs out of margin exactly where a technician later needs it: during an emergency splice, a dirty patch cord, or a hot afternoon that pushes fiber attenuation a little higher than the datasheet number.
This reference covers the two passive loss sources that show up in every link budget calculation: mated connector pairs (FC/APC, LC/PC, and SC, and the IEC grading system behind them) and splices (fusion and mechanical). It walks through the physical mechanism behind each loss figure, a worked span-loss calculation using the ITU-T statistical design method, and the field measurement techniques — OTDR and OLTS — used to verify the numbers a design assumed.
2. Connector Insertion Loss: Grades, Families, and Polish Types
Insertion loss at a connector is the optical power lost when two fiber ends mate through a pair of polished ferrules and an alignment sleeve, expressed as IL = 10·log₁₀(Pin/Pout) in decibels. Three mechanisms account for nearly all of it: lateral core offset between the two ferrules, an angular or axial gap between the polished end faces, and Fresnel reflection at any residual air interface between them.
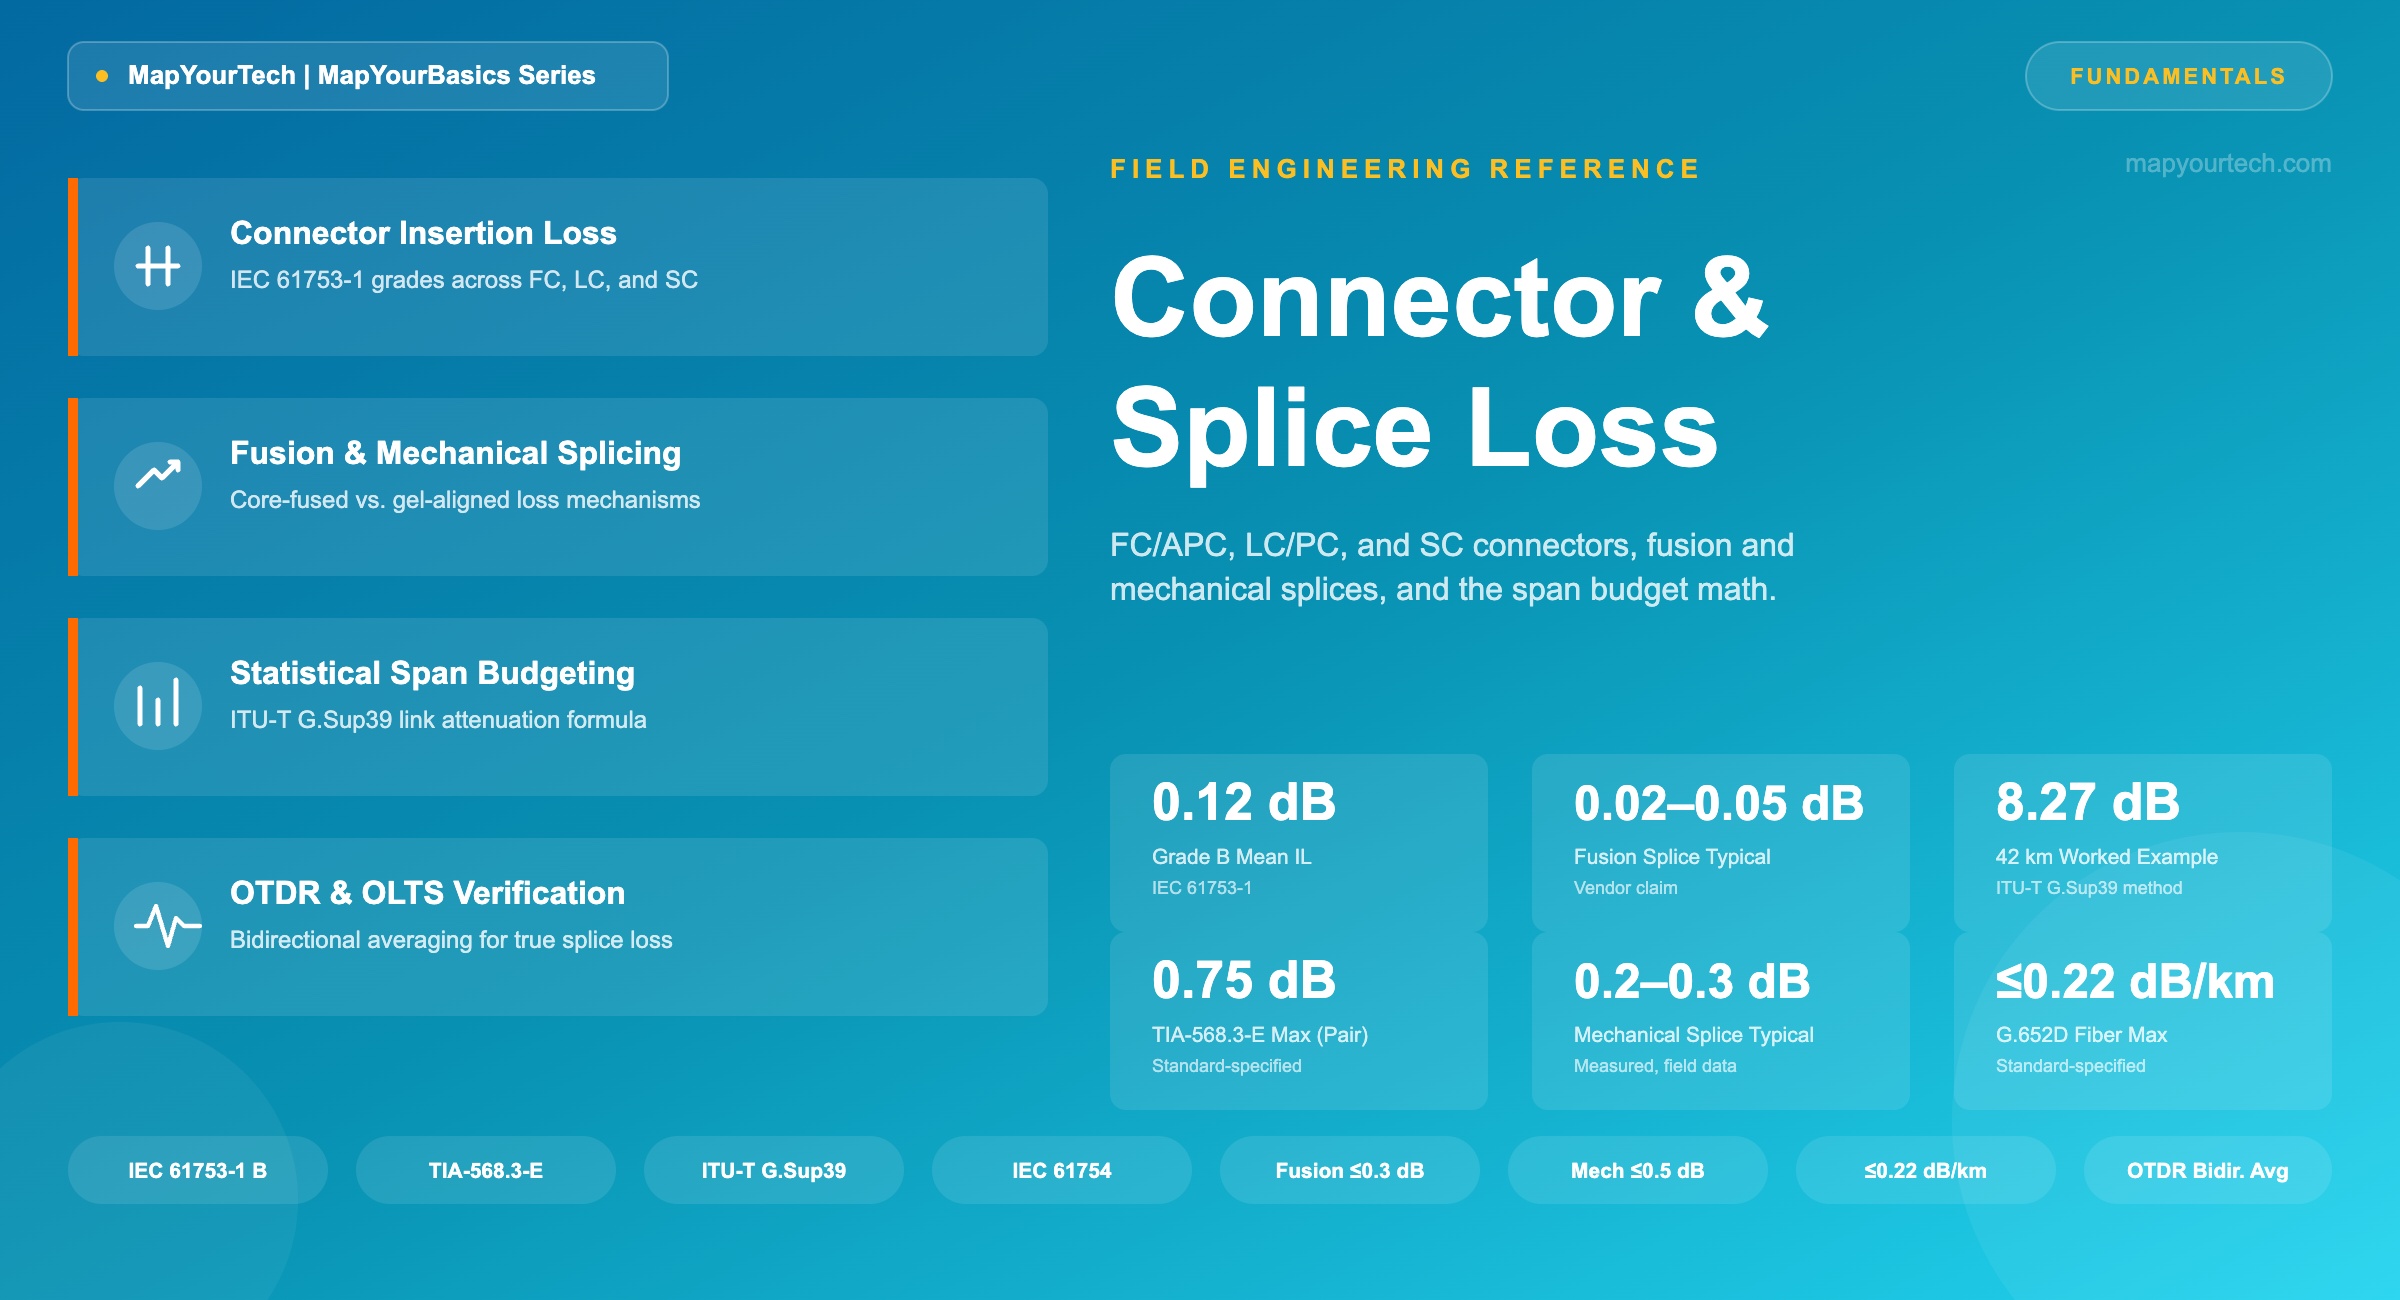
IEC 61753-1 sets the grading system for how much loss a manufactured connector is allowed to contribute, measured under random mating — plugging a sample connector into a reference master cord without hand-selecting for best fit. Grade B, the premium tier most carriers specify for outside-plant and data-center backbone links, holds mean insertion loss to ≤0.12 dB with a maximum of ≤0.25 dB for 97 percent of samples (standard-specified, IEC 61753-1). Grade C relaxes that to ≤0.25 dB mean / ≤0.50 dB maximum, and Grade D to ≤0.50 dB mean / ≤1.00 dB maximum. The number a technician reads off a datasheet reflects which grade the manufacturer targeted, not which connector family was used.
Connector family — FC, LC, or SC — is a mechanical interface specification, not a loss specification. FC (IEC 61754-13) uses a 2.5 mm ferrule and a threaded coupling nut, which gives it strong resistance to vibration-induced loss drift and makes it the default choice for OTDR ports and lab test equipment. SC (IEC 61754-4) also uses a 2.5 mm ferrule, with a push-pull latch favored in FTTH and telecom distribution cabinets for its tolerance to gloved field handling. LC (IEC 61754-20) halves the ferrule to 1.25 mm inside a latching housing sized for SFP and QSFP transceiver density, which is why it dominates data-center patch panels — but the smaller ferrule demands tighter core-to-ferrule concentricity control during manufacturing to hit the same IEC grade, and its smaller exposed core makes it more sensitive to contamination during field cleaning.
Polish type is the second, independent variable. PC and UPC (ultra-physical contact) polish the ferrule end face flat and slightly domed so the fiber cores touch under spring pressure, typically returning roughly 45–55 dB of return loss (vendor datasheets, typical values). APC polishes the end face at an 8° angle, so any residual reflection at the interface refracts into the cladding instead of coupling back into the core — this is why APC connectors reach 60 dB or more of return loss in vendor data, and why they are standard on any link carrying analog RF-over-glass or coherent signals sensitive to reflected light. The two polish types are not mechanically or optically compatible: mating a UPC connector to an APC connector leaves a wedge-shaped air gap at the angled interface that can add several decibels of loss and degrade return loss by 20 dB or more — a common, avoidable cause of intermittent link failures traced back to a mis-stocked patch cord.
For system-level budgeting, ANSI/TIA-568.3-E sets 0.75 dB as the maximum allowed loss for a single mated connector pair using standard-grade, non-reference connectors (standard-specified) — a ceiling meant to bound worst-case components, not a number to design toward. A link built on IEC 61753-1 Grade B connectors should budget close to the 0.12 dB mean figure per pair, treating the gap up to 0.75 dB as margin against contamination, wear, and component variance over the life of the link.
| Connector | Ferrule | IEC Interface Standard | Polish Options | Typical Return Loss | Evidence Class |
|---|---|---|---|---|---|
| FC | 2.5 mm | IEC 61754-13 | PC, APC | UPC ~45–50 dB; APC ≥60 dB | Vendor claim |
| SC | 2.5 mm | IEC 61754-4 | PC (UPC), APC | UPC ~50 dB; APC ≥60 dB | Vendor claim |
| LC | 1.25 mm | IEC 61754-20 | PC (UPC), APC | UPC ~50–55 dB; APC ≥60–65 dB | Vendor claim |
| Grade | Mean Insertion Loss | Max Insertion Loss (97% of samples) | Typical Use |
|---|---|---|---|
| B | ≤0.12 dB | ≤0.25 dB | Outside plant, backbone, coherent links |
| C | ≤0.25 dB | ≤0.50 dB | General enterprise and premises cabling |
| D | ≤0.50 dB | ≤1.00 dB | Legacy or non-critical low-speed links |
Takeaway: Connector loss is set primarily by the IEC 61753-1 polish grade, not the FC, LC, or SC family — budget to the Grade B mean of 0.12 dB for premium components, and never mate a UPC connector to an APC connector.
3. Splice Loss: Fusion vs. Mechanical Methods
A splice joins two bare fiber ends permanently or semi-permanently, without the ferrules and adapter a mated connector pair requires. Two methods dominate field practice, and they fail differently.
Fusion splicing aligns the fiber cores under a motorized alignment stage, then melts the glass with a controlled electric arc so the two ends fuse into a single continuous strand. Because no interface remains to reflect or misalign after the arc, fusion splices carry very little loss and negligible back reflection. Core-alignment fusion splicers on the market in 2026 — the class of equipment used for outside-plant and long-haul builds — typically claim average splice loss of about 0.02 dB on G.652D single-mode fiber, measured by the cut-back method against ITU-T and IEC reference procedures (vendor claim, fusion splicer manufacturer datasheets). Field results run a little higher than a controlled lab cut-back test: experienced technicians routinely achieve well under 0.1 dB per splice in practice (measured, field data), and the residual loss traces mostly to mode field diameter mismatch between the two fiber ends rather than to core misalignment — a factor the splicer's arc power and fusion time can only partly compensate for when splicing dissimilar fiber types, such as standard G.652 to a bend-insensitive G.657 pigtail.
Mechanical splicing skips the arc: it holds two cleaved fiber ends in precise alignment inside a small housing, using an index-matching gel to fill the residual air gap and suppress the Fresnel reflection that gap would otherwise cause — on the order of 0.3 dB per bare-glass interface, or roughly 0.6 dB combined, without the gel (physics-based estimate from the Fresnel reflection coefficient at a glass-air boundary). With the gel in place and a clean, well-cleaved fiber end, mechanical splices typically land in the 0.2–0.3 dB range, with the practical spread running 0.1–0.5 dB depending on cleave quality and installer technique (measured, field data). The alignment sleeve locates the fiber by its cladding, not its core, so any core-to-cladding concentricity error in the fiber itself shows up directly as splice loss — a mechanism fusion splicing largely avoids because the arc lets the core self-align during the melt.
ANSI/TIA-568.3-E sets the standard ceiling at 0.3 dB maximum for a field-installed fusion splice and 0.5 dB maximum for a mechanical splice (standard-specified). Many carrier and ISP construction specifications tighten that further for fusion work — a 0.1 dB average with a 0.2 dB per-splice maximum is a common acceptance threshold on fiber-to-the-premises builds (project-specification practice, not itself a standard value), which forces a resplice of any joint an OTDR reports above that line.
Mechanical splices remain the right tool for emergency restoration and temporary connections where a fusion splicer is not on site, precisely because the loss penalty is a few tenths of a decibel — acceptable for a short-term repair, but not something a permanent backbone route should carry indefinitely.
| Method | Alignment Mechanism | Typical Loss | TIA-568.3-E Max | Evidence Class |
|---|---|---|---|---|
| Fusion (core-aligned) | Arc-fused core alignment | 0.02–0.1 dB | 0.3 dB | Vendor claim / measured |
| Mechanical | Gel-filled cladding alignment | 0.2–0.3 dB (0.1–0.5 dB range) | 0.5 dB | Measured (field data) |
Takeaway: Budget fusion splices near 0.05 dB and mechanical splices near 0.25 dB; reserve mechanical splicing for temporary repairs, since its air-gap-and-gel interface trades permanence for speed.
4. Span Loss Budget: Statistical Design and a Worked Calculation
A span loss budget sums every passive contributor between transmitter and receiver, then compares the total against the system's allocated attenuation. ITU-T G-series Recommendations Supplement 39 formalizes this as a statistical design problem rather than a simple worst-case sum, because splice loss, connector loss, and the fiber attenuation coefficient all vary across a population of components rather than sitting at one fixed value (standard-specified method).
Statistical Link Attenuation — ITU-T G-series Supplement 39
A = α · L  +  αs · x  +  αc · y

A     = total link attenuation (dB)
α     = fiber attenuation coefficient (dB/km)
L     = link length (km)
αs    = mean splice loss (dB)
x     = number of splices
αc    = mean connector loss (dB)
y     = number of mated connector pairs
ITU-T G.Sup39 notes that a suitable margin should be allocated on top of A for cable aging, temperature-driven attenuation changes, and future splice additions; the Supplement does not mandate a fixed margin figure.
One mid-span fusion splice and one mated LC/APC connector pair at each end of the span (two pairs total).
- α = 0.19 dB/km — field-measured typical value for G.652D at 1550 nm, within the ITU-T G.652 specification ceiling of ≤0.22 dB/km (measured, typical).
- L = 42 km → α·L = 7.98 dB
- αs = 0.05 dB, x = 1 — vendor-typical fusion splice loss → 0.05 dB
- αc = 0.12 dB, y = 2 — IEC 61753-1 Grade B mean insertion loss → 0.24 dB
A = 7.98 + 0.05 + 0.24 = 8.27 dB
That 8.27 dB figure is the design center, not the number to plan around directly — real cable attenuation varies with manufacturing lot and temperature, and a route rarely stays at zero future splices for its operational life. Network designers commonly carry several decibels of margin above the calculated statistical attenuation for exactly this reason (operational design practice; ITU-T G.Sup39 flags the need for margin without mandating a specific figure), sized against the transmitter power, receiver sensitivity, and OSNR budget of the line system actually in use.
Takeaway: Run the statistical formula with measured or vendor-typical component values, not standard worst-case maximums — the worst-case numbers exist to bound outliers, not to describe the span you actually built.
5. Field Measurement: OTDR and OLTS Best Practices
Two instruments answer two different questions about the same link, and conflating them is a common field-testing error. An Optical Loss Test Set (OLTS) — a calibrated light source at one end and a power meter at the other — measures true end-to-end insertion loss directly: IL = 10·log₁₀(Pin/Pout), the same quantity the link budget calculation predicts. TIA-568.3-E designates OLTS as Tier 1 testing, the minimum required to certify that a link meets its design loss.
An Optical Time-Domain Reflectometer (OTDR) answers a different question: where loss is occurring along the fiber, not just how much loss the whole link has. It launches a pulse and measures Rayleigh backscatter and Fresnel reflections returning along the fiber over time, building a trace that locates every splice, connector, and fault by distance. That same mechanism is also its limitation for splice-loss measurement: two fiber sections spliced together rarely have identical backscatter coefficients, so a single-ended OTDR trace can show a splice as a small gain — an apparent increase in power — rather than the loss that is actually there, simply because the trace is reading a change in backscatter level rather than a direct through-loss measurement.
The fix is bidirectional averaging, the method TIA-568.3-E and the related EIA/TIA-455 test procedures specify: measure the same splice from both directions and average the two directional loss readings. The bias introduced by the backscatter mismatch has opposite sign in each direction, so it cancels in the average and what remains is the splice's true insertion loss (standard-specified test method). Accepting a single-direction trace as the final splice-loss number risks passing a bad splice that happens to look good from the end it was tested from.
In practice, the two instruments are complementary rather than competing: OLTS certifies the finished link against its Tier 1 loss budget, and OTDR — Tier 2 testing under TIA-568.3-E — is the diagnostic tool that finds which specific connector or splice is responsible when an OLTS reading comes in high. A construction crew building a long route typically runs bidirectional OTDR traces on every fusion splice as it is made, flags anything above the project's acceptance threshold for a resplice on the spot, then closes out the route with an end-to-end OLTS measurement before amplifier and transceiver commissioning begins.
A splice that reads as a small gain on a single-direction OTDR trace has not actually amplified the signal — it has revealed a backscatter coefficient mismatch between the two fiber sections. Trust the bidirectional average, not the single-ended number, whenever the two directions disagree by more than a few hundredths of a decibel.
Takeaway: OLTS gives the number the link budget predicted; OTDR shows where any shortfall is hiding — and only a bidirectional OTDR trace gives a trustworthy per-splice loss value.
6. Field Reference: Quick Values and Practical Guidelines
Most field loss problems trace back to contamination, not component quality — a dust particle or oil film on a fiber end face can add a decibel or more of loss and drive return loss down by 20–30 dB, effects that dwarf the difference between a Grade B and a Grade C connector. A one-click cleaner and a fiber inspection scope belong in every technician's kit, and every connector should be inspected and cleaned immediately before mating, not after a bad OTDR reading forces a truck roll. IEC 61300-3-35 defines the pass/fail zones for end-face inspection under magnification and is the reference standard most carriers cite in their acceptance procedures.
Keep polish types segregated in inventory and in the field: mixing APC and UPC patch cords is a recurring, avoidable cause of high-loss, high-reflection links, and the color coding — green for APC, blue for UPC on single-mode connectors — exists specifically to make the mismatch visible before a bad mate happens. Dust caps stay on every unmated connector and adapter port, including ones that will only sit idle for a few minutes, since airborne contamination accumulates faster in a data center or splice enclosure than most technicians expect.
For new builds, specify IEC 61753-1 Grade B connectors on any link carrying coherent or 100G-and-above signals, budget fusion splices at every permanent joint, and reserve mechanical splices for restoration work only. Run bidirectional OTDR on every splice at time of installation — resplicing during construction costs minutes; resplicing after a route is buried, lit, and carrying traffic costs an outage window.
| Component | TIA-568.3-E Standard Max | Common Project Practice | Evidence Class |
|---|---|---|---|
| Mated connector pair (standard-grade) | 0.75 dB | Design to Grade B mean, ~0.12 dB | Standard-specified |
| Fusion splice | 0.3 dB | 0.1 dB average / 0.2 dB max (many ISP specs) | Standard-specified / project practice |
| Mechanical splice | 0.5 dB | Use for temporary repair only | Standard-specified |
Takeaway: Contamination, not connector grade, causes most field loss events — clean and inspect before every mate, and keep APC and UPC inventory strictly separated.
References
- ITU-T G-series Recommendations, Supplement 39 — Optical System Design and Engineering Considerations, ITU-T Study Group 15.
- ANSI/TIA-568.3-E — Optical Fiber Cabling and Components Standard, Telecommunications Industry Association.
- IEC 61753-1 — Fibre Optic Interconnecting Devices and Passive Components: Performance Standard, Part 1: General and Guidance, International Electrotechnical Commission.
Sanjay Yadav, "Optical Network Communications: An Engineer's Perspective" — Bridge the Gap Between Theory and Practice in Optical Networking.
Related Articles on MapYourTech