
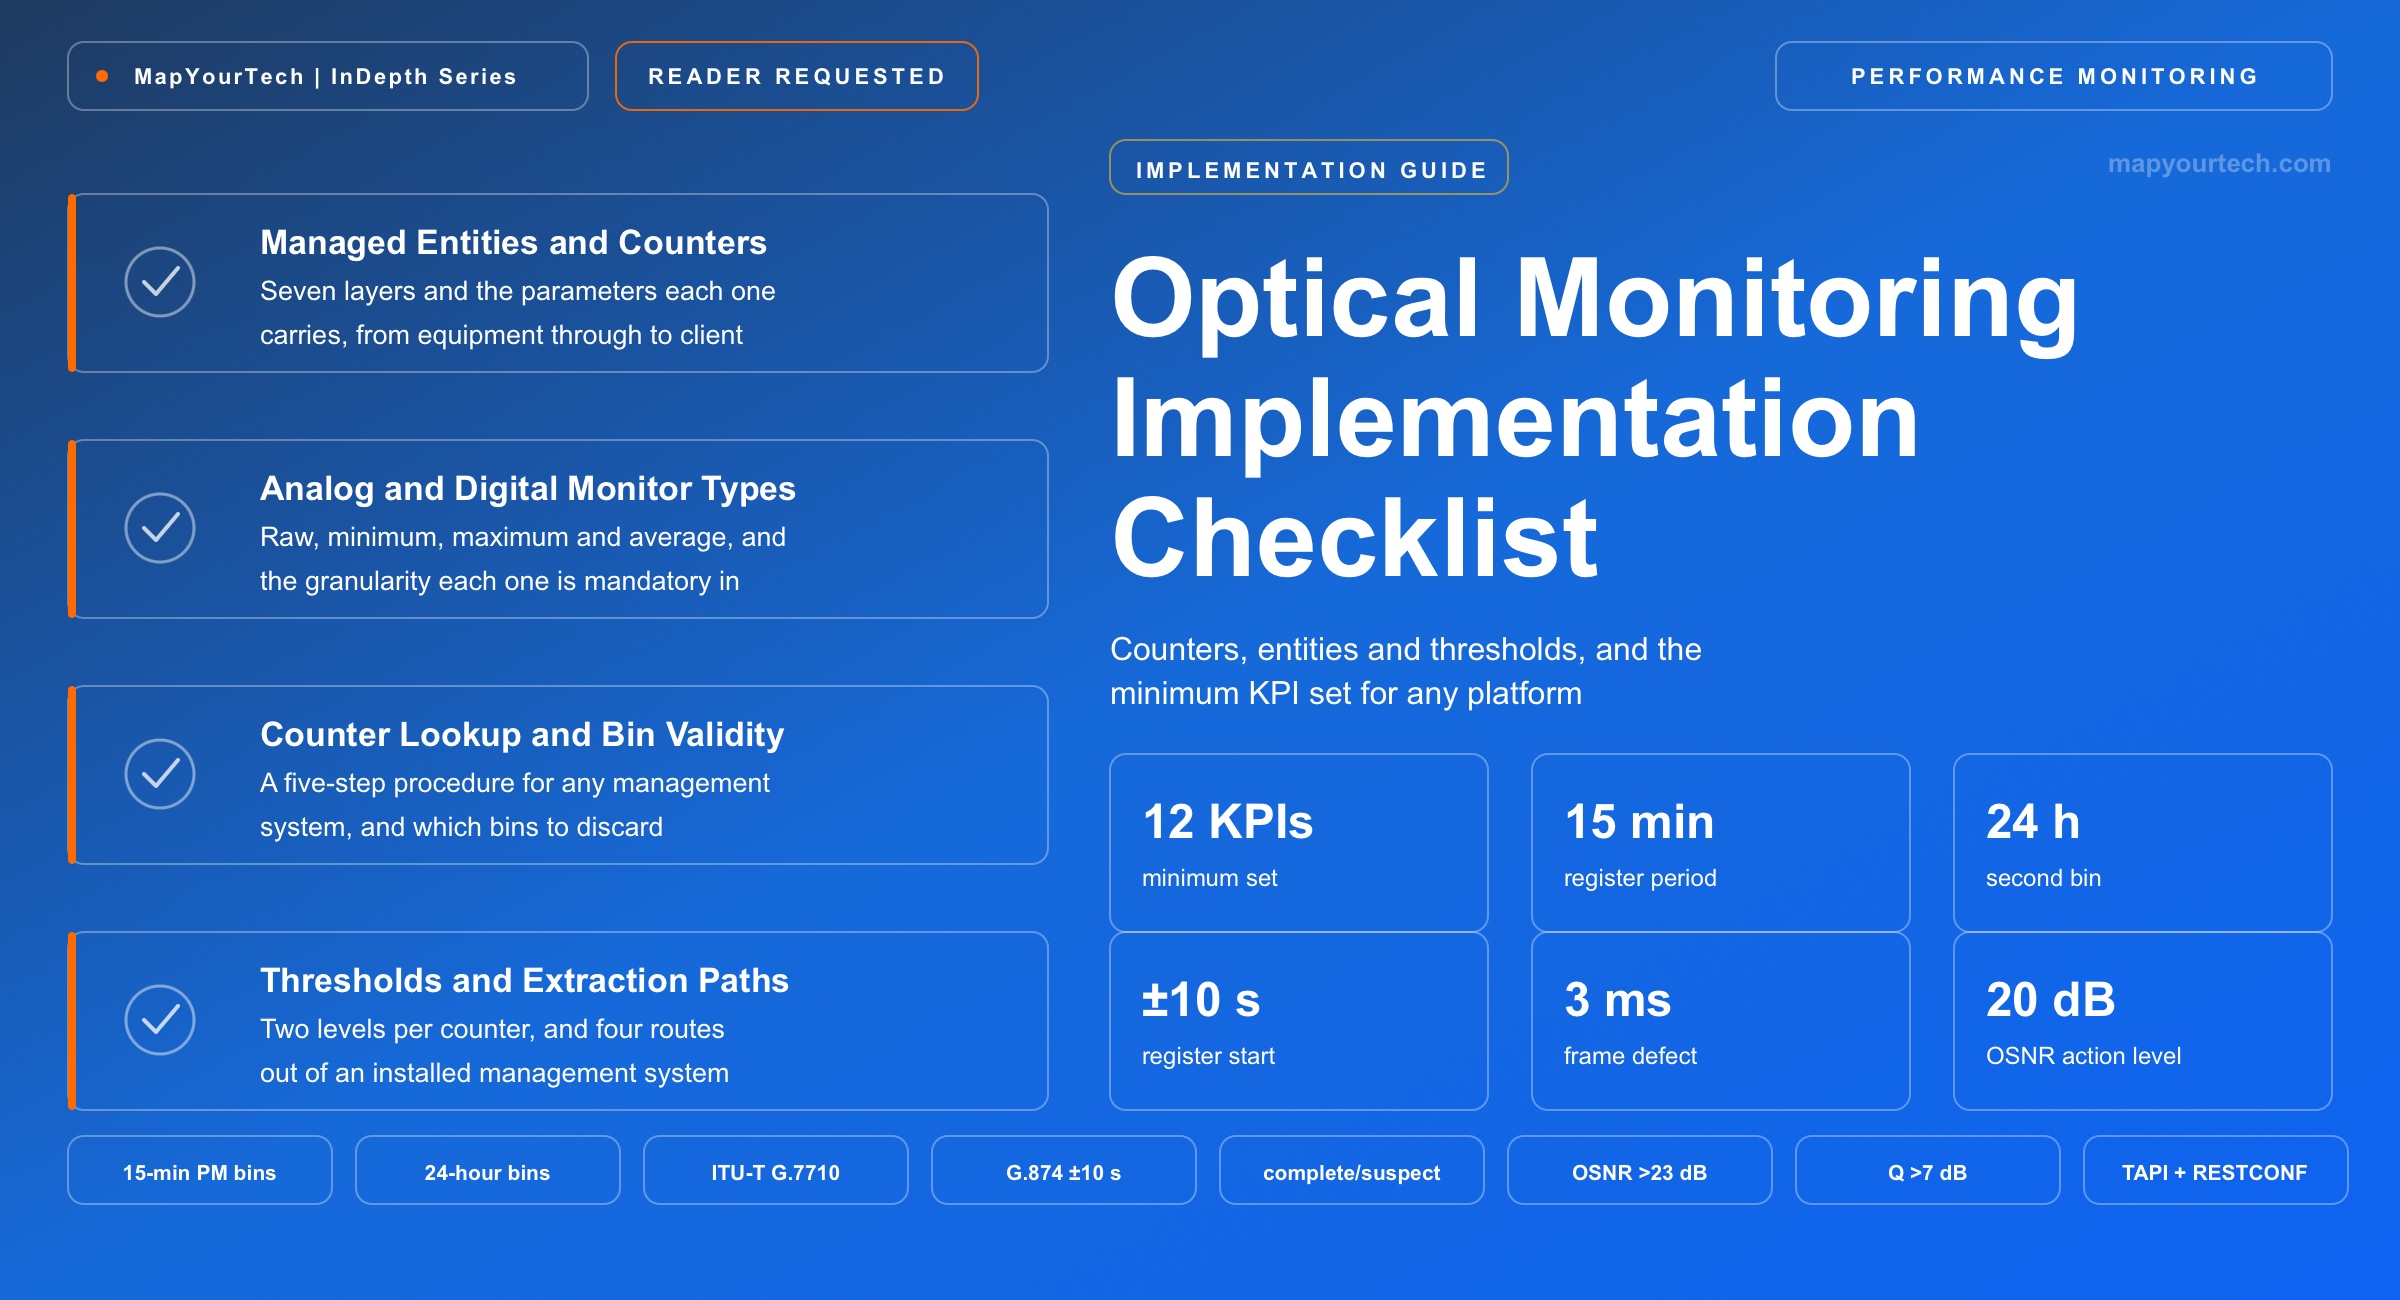
Optical Monitoring Implementation Checklist: Counters to KPIs
Which performance counters to collect, which managed entity carries each one, where to find them in any vendor's management system, and the minimum KPI set a working dashboard needs.
Operations is where theory meets practice.
What You Will Learn
- Locate any performance counter by first naming the managed entity that carries it, using the seven-layer map in Figure 1.
- Collect the minimum twelve-KPI set of Table 1, which is enough for a working dashboard on any platform.
- Read the counter and defect inventory in Tables 3 to 6 with the standard name, the unit and the common label variants each vendor uses.
- Apply the five-step lookup procedure in Section 5 to find a counter in a management system you have never used before.
- Set high and low threshold levels against the 15-minute register period from the starting bands in Table 7, and put the two-period persistence in the alerting layer rather than expecting it from the equipment.
- Choose among the four extraction paths in Figure 2 — scheduled file export, SNMP, model-driven northbound interface, or direct device streaming.
- Follow the five-phase build sequence in Section 8, each phase with an acceptance test that has to pass before the next one starts.
- Run the pre-go-live validation in Section 9 and avoid the eight implementation errors catalogued in Section 10.
1. Introduction
The gap between knowing what to monitor and knowing where to click is the whole difficulty of an optical monitoring project. A concept article can say that pre-forward-error-correction bit error rate (pre-FEC BER) is the primary health metric without helping anyone find it, because in one management system it sits under the line port's optical channel performance view, in another under the optical transport unit termination, and in a third under a card-level counter group with a name that does not contain the word BER at all.
The way out is not a per-vendor cookbook, which goes stale with the next software release and covers only the platforms it was written against. It is the observation that every optical management system organizes performance data the same way underneath, because they all implement the same layered model: ITU-T G.872 defines the optical transport network architecture, G.709 defines the frame structure and the layers within it, and G.874 with G.875 define how those layers are represented as managed entities for fault, configuration and performance management. A counter is always attached to an entity in that hierarchy. Find the entity and the counter is one view away.
This guide exists because a reader asked for it. Having read the companion article on optical network monitoring dashboards, they wrote in to say the concepts were clear but translating them into their own environment was not, and asked for an implementation checklist: the performance objects and counters to look for, where those sit inside a management system, and the minimum KPI set a dashboard needs. That request set the scope of everything below. Requests like it are welcome and they shape what gets published here, because the test of a technical article is whether it moves a reader's work forward — the feedback address in the footer reaches the team directly.
This guide is the implementation companion to that article. The companion covers architecture, sizing and panel design; this one covers the part that comes first in practice — deciding which counters to collect, finding them, setting their thresholds, and getting them out of an installed management system into a store you control. It is written to be usable against any transport platform, and the vendor-specific content is deliberately limited to one table naming the management platforms and their documented northbound interfaces, because that is the only part that varies by vendor.
Two constraints shape everything below. The first is that performance registers on transport equipment are binned: ITU-T G.7710/Y.1701 specifies accumulation into 15-minute and 24-hour periods with threshold crossing alerts (standard-specified), and that period is the granularity most installed systems will give you regardless of what the datasheet promises. The second is that monitoring is often disabled by default on newly provisioned objects, so a counter can be correctly identified, correctly mapped and permanently empty. Section 5 addresses both.
Takeaway: Every optical management system exposes counters against the same layered entity model. Identify the entity first — optical section, optical channel, transport unit, data unit, client — and the counter location follows, whatever the platform is called.
2. Managed Entities and Counter Placement
A performance counter belongs to exactly one managed entity, and the entity determines what the counter can tell you. Received optical power on a card port describes a physical interface. The same nominal quantity read at the optical channel layer describes one wavelength within that interface. Errored seconds at the transport unit layer describe a regenerator section; the same parameter name at the data unit layer describes an end-to-end path. Reading the right number from the wrong entity is the most common cause of a dashboard that disagrees with the network.
Figure 1 lays out the seven entity groups an optical network exposes, the performance parameters that attach to each, and where the entity typically sits in a management system's object tree.
Read the Full Analysis with Premium
The remaining 84% of this article — the design numbers, trade-offs and field guidance — is part of MapYourTech Premium, along with the full premium library, courses and professional tools.
You May Also Like
-
Free
-
August 27, 2026
-
Free
-
August 27, 2026