
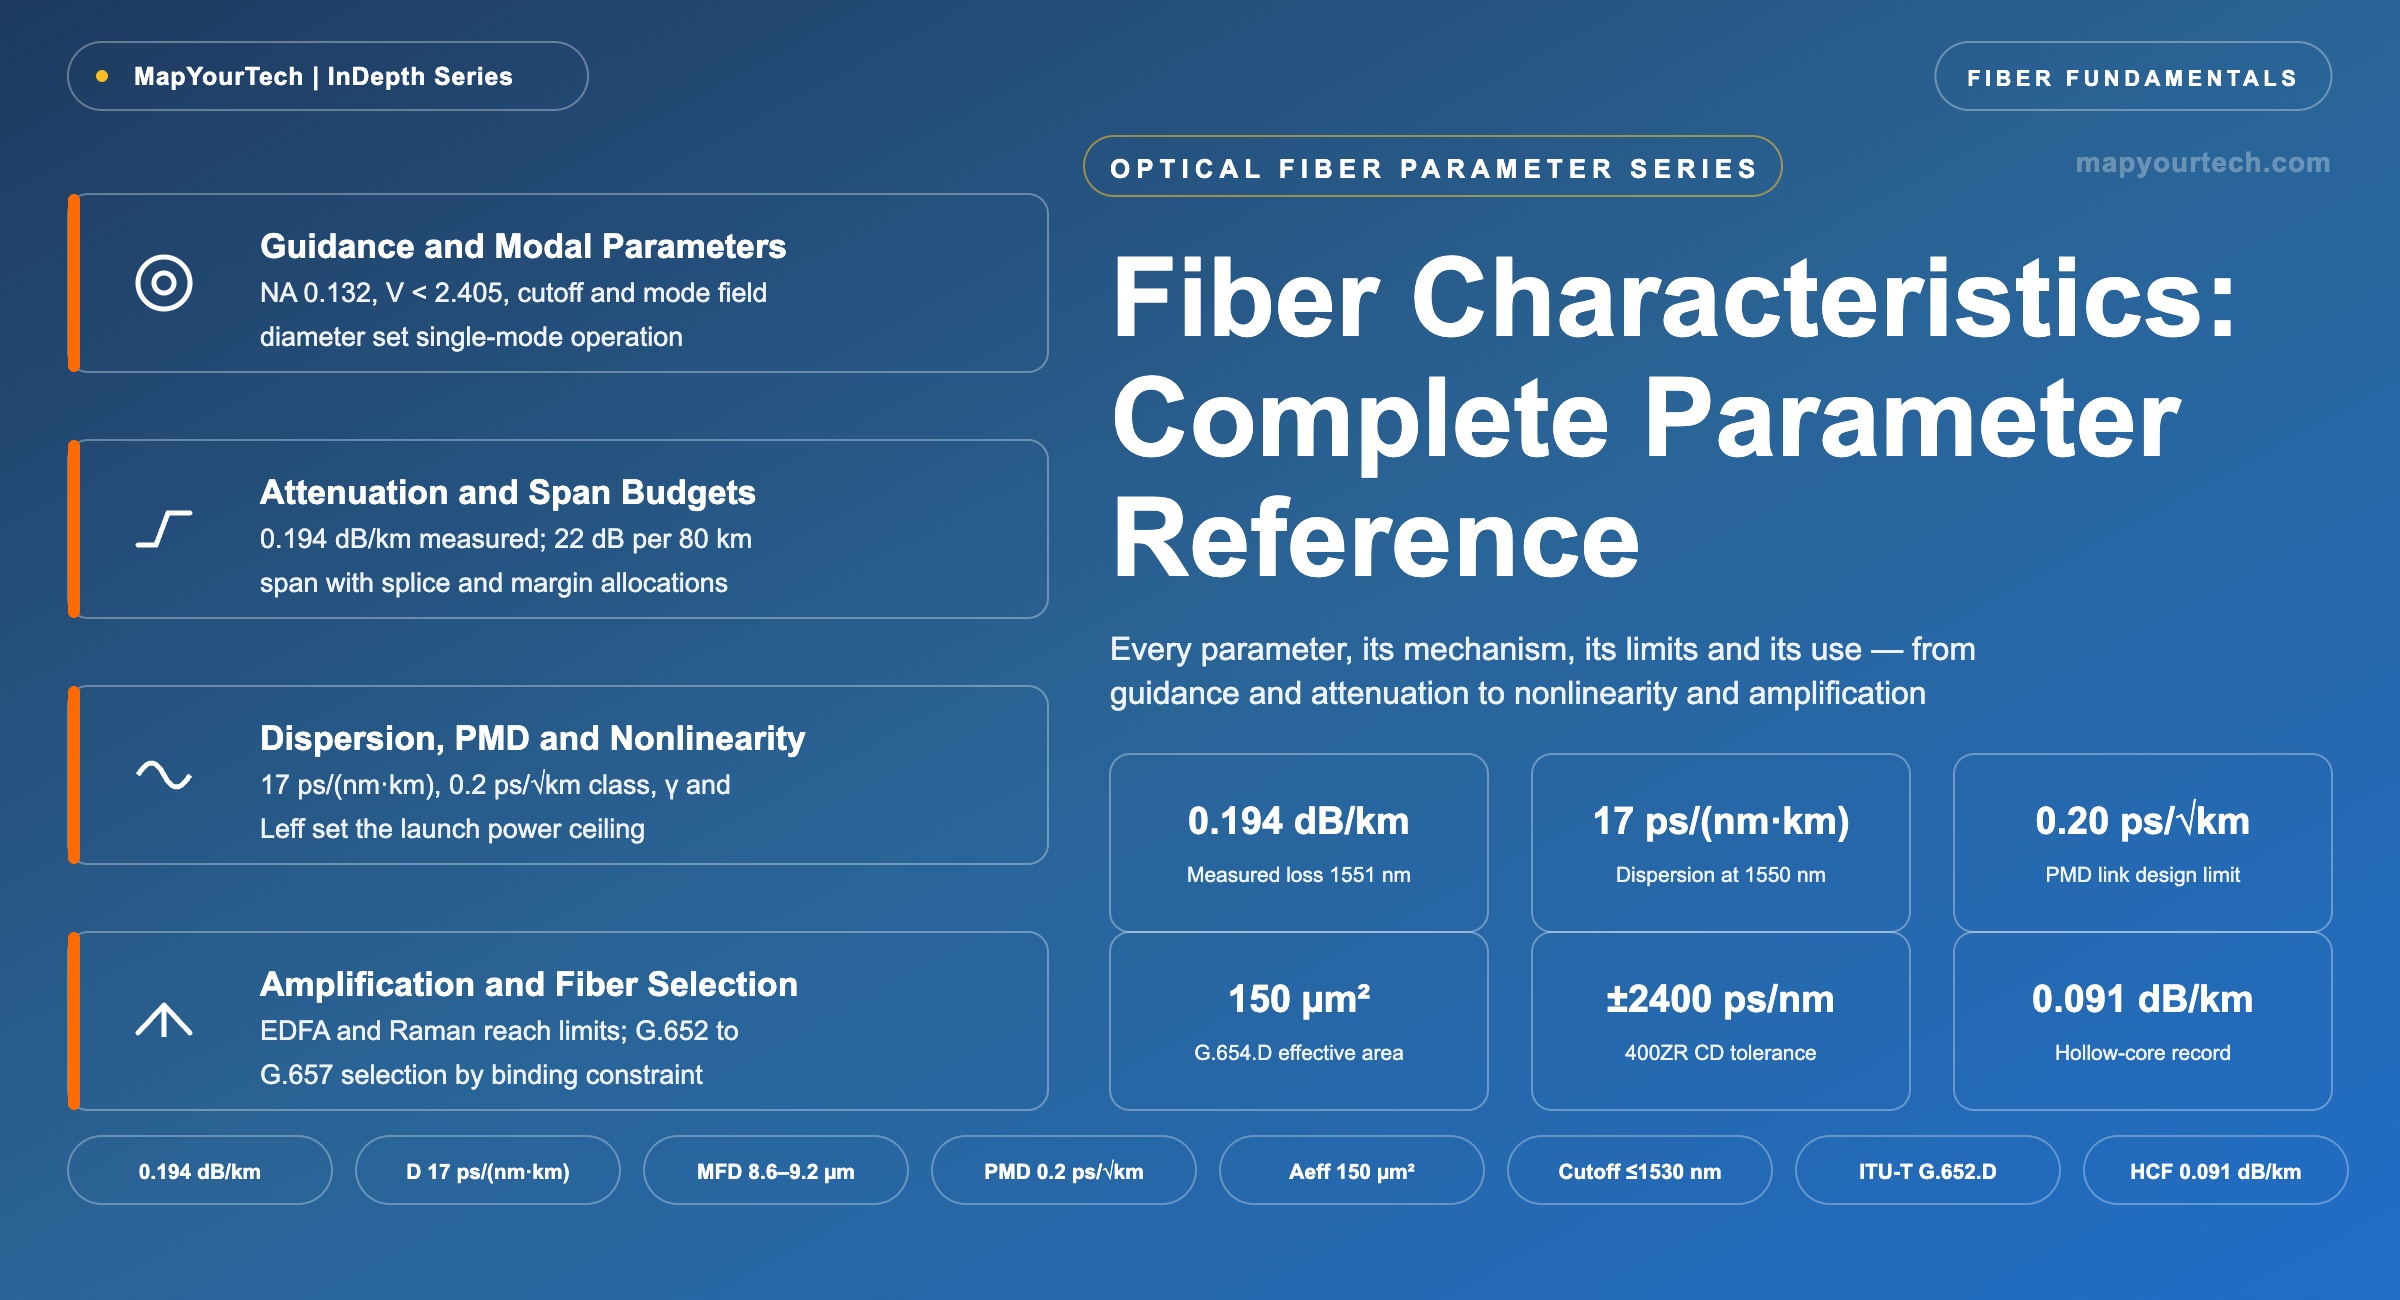
Fiber Characteristics: Complete Parameter Reference
Every parameter that defines an optical fiber, from numerical aperture and mode field diameter to attenuation, dispersion, PMD, nonlinear coefficients and bending limits, with its physical mechanism, standard-specified bounds, typical field values, and the design decisions each one drives.
The true character of a fiber reveals itself under test.
What You Will Learn
- Define the guidance parameter set of Section 3 — numerical aperture, V-number, cutoff wavelength and mode field diameter — and confirm single-mode operation from V < 2.405.
- Quantify each attenuation mechanism of Section 4 and build an 80 km span budget from a measured 0.19 dB/km fiber loss plus splice and connector allocations, then carry it into the multi-span OSNR budget of Section 8.
- Convert the 17 ps/(nm·km) dispersion coefficient of Section 5 into accumulated dispersion per route and compare it against receiver tolerances, including the ±2400 ps/nm bound of OIF 400ZR.
- Anchor PMD design in Section 6 to the 30% bit-period DGD rule of ITU-T G-series Supplement 39 and the PMDQ link value of 0.20 ps/√km specified for ITU-T G.652.D.
- Compute the nonlinear coefficient γ of Section 7 from n2 and effective area, derive the 21 km effective length of a standard span, and place launch power against the −2 to +2 dBm planning window.
- Select fiber per application across the ITU-T G.652 to G.657 family using the parameter comparison of Section 10 and the decision flow of Section 11.
- Match every parameter to its ITU-T G.650-series measurement method in Section 12, including the 1310/1550/1625 nm OTDR test set used for field acceptance.
- Place the 0.1396 dB/km silica attenuation record and the 0.091 dB/km hollow-core result of Sections 2 and 13 on the fiber technology roadmap.
1. Introduction
An optical fiber is completely described by a finite set of measurable parameters, and every transmission-system design decision traces back to one of them. Attenuation sets the span budget and amplifier spacing. Chromatic dispersion sets the pulse-broadening rate that the receiver must absorb. Polarization mode dispersion sets a statistical timing uncertainty that grows with the square root of distance. Effective area and the nonlinear refractive index together set the launch power at which the fiber itself begins to distort the signal it carries. Geometry and mechanical parameters set splice loss, bend tolerance, and the twenty-five-year reliability of the installed plant. A standard single-mode fiber meeting ITU-T G.652.D carries a measured attenuation near 0.19 dB/km at 1550 nm in field-installed links, a chromatic dispersion coefficient of approximately 17 ps/(nm·km) at the same wavelength, and a PMD link design value of at most 0.20 ps/√km — three standard-anchored numbers that between them determine most of what a DWDM line system can do over that fiber.
This reference covers every parameter in that set: what it is physically, which mechanism produces it, what value ITU-T specifies or the field typically measures, when it binds a design, and why an engineer selects one value over another. The treatment runs from the guidance parameters that make a fiber single-mode — numerical aperture, V-number, cutoff wavelength, mode field diameter — through the transmission impairment parameters of attenuation, dispersion, and PMD, into the nonlinear parameter set that governs launch-power optimization, and out to the geometrical, mechanical, and bending specifications that govern installation and lifetime. The ITU-T G.652 through G.657 fiber family is then compared parameter by parameter, application-based selection rules are derived, and the ITU-T G.650-series measurement methods that verify each parameter are mapped to field practice.
The parameter values quoted throughout carry their evidence class in the same sentence: standard-specified limits come from ITU-T Recommendations, measured values from published field measurement campaigns and laboratory records, vendor claims from product specifications, and theoretical limits from the underlying physics. Where a value genuinely varies by implementation, it is stated as a typical range rather than false precision. Readers building link budgets on these parameters will find the companion treatments of fiber attenuation and loss and Q-factor improvement techniques useful next steps.
Takeaway: A fiber is its parameter set. Attenuation, dispersion, PMD, effective area, and geometry each map to one design decision — span budget, receiver tolerance, timing margin, launch power, and installation practice — and this article treats each parameter with its mechanism, its specified bound, its measured field value, and the decision it drives.
2. Historical Development of Fiber Attenuation and Capacity
Fiber attenuation history is a fifty-year descent of nearly three orders of magnitude followed by a four-decade plateau. In 1966, Kao and Hockham proposed that glass fiber could serve communication if attenuation could be brought below 20 dB/km — at the time, available glasses measured near 1000 dB/km, so the proposal was a materials-purity target, not a demonstrated capability. In 1970, a fused-silica fiber first reached approximately 20 dB/km at visible wavelengths (measured), proving the purity path viable. Through the 1970s, chemical vapor deposition processes removed transition-metal and hydroxyl contamination, and by 1979 laboratory silica fiber reached approximately 0.20 dB/km at 1550 nm (measured), close to the intrinsic limit set by Rayleigh scattering.
From there the curve flattened. The laboratory silica record improved only from 0.154 dB/km in 1985 to 0.1396 dB/km in 2024 (measured records, reported in the hollow-core literature published in Nature Photonics) — a 9% gain across thirty-nine years, because Rayleigh scattering in the glass itself is the residual loss and can only be reduced by lowering the fictive temperature and dopant concentration of the core, both of which approach material limits in pure-silica-core designs. Commercial fiber tracked the records at a small offset: standard germanium-doped G.652 product ships at 0.18 dB/km, ultra-low-loss silica-core G.652 at 0.16 dB/km, and silica-core G.654.B/D product at 0.15 dB/km (vendor product specifications across the commercial low-loss fiber class).
In September 2025, the plateau broke — outside silica. A hollow-core fiber using a double nested antiresonant nodeless (DNANF) geometry, developed by University of Southampton researchers with Microsoft Azure Fiber, measured 0.091 dB/km at 1550 nm, held below 0.1 dB/km across an 18 THz window, and stayed below 0.2 dB/km across 66 THz (measured, published in Nature Photonics). Because the light propagates through air rather than glass, Rayleigh scattering nearly vanishes and the group index falls close to 1, so signals also propagate approximately 45% faster than in silica (measured group-velocity difference between air and glass guidance). Section 13 treats the deployment implications; the historical point here is that the intrinsic-loss floor that defined silica fiber engineering for forty years is no longer the floor for fiber as a category.
| Year | Fiber Class | Attenuation (dB/km) | Evidence Class |
|---|---|---|---|
| 1970 | Fused silica, visible wavelengths | 20.000 | Measured record |
| 1979 | Silica, 1550 nm | 0.200 | Measured record |
| 1985 | Silica, 1550 nm | 0.154 | Measured record |
| 2024 | Silica, 1550 nm | 0.140 | Measured record (0.1396) |
| 2025 | Hollow-core DNANF, 1550 nm | 0.091 | Measured record |
Capacity history followed the attenuation history with a lag: once loss stopped limiting reach, dispersion did, and once coherent detection with digital signal processing absorbed dispersion, nonlinearity became the binding constraint. That sequence explains the fiber family tree of Section 10 — G.653 and G.655 were engineered for the dispersion-limited era, while G.654.E and large-effective-area designs answer the nonlinearity-limited era. The dispersion-shifted fiber and NZDSF history covers that middle era in depth.
Takeaway: Silica attenuation fell from 20 dB/km in 1970 to 0.154 dB/km by 1985 and then gained only 9% in thirty-nine years, ending at 0.1396 dB/km in 2024 (measured records). The 2025 hollow-core DNANF result of 0.091 dB/km at 1550 nm moved the record below silica for the first time by removing glass from the propagation path.
3. Light Guidance and Modal Parameters
Guidance parameters define whether a fiber confines light, how much light it accepts, and how many modes it supports. Five parameters carry the whole story: the core and cladding refractive indices and their relative difference Δ, the numerical aperture NA, the normalized frequency V, the cutoff wavelength λc, and the mode field diameter MFD. Each one is fixed at fiber design time and each one has a direct operational consequence — coupling efficiency, splice loss, bend sensitivity, and the single-mode guarantee itself.
Read the Full Analysis with Premium
The remaining 89% of this article — the design numbers, trade-offs and field guidance — is part of MapYourTech Premium, along with the full premium library, courses and professional tools.
You May Also Like
-
Free
-
August 25, 2026

-
Free
-
August 22, 2026

-
Premium
-
August 22, 2026