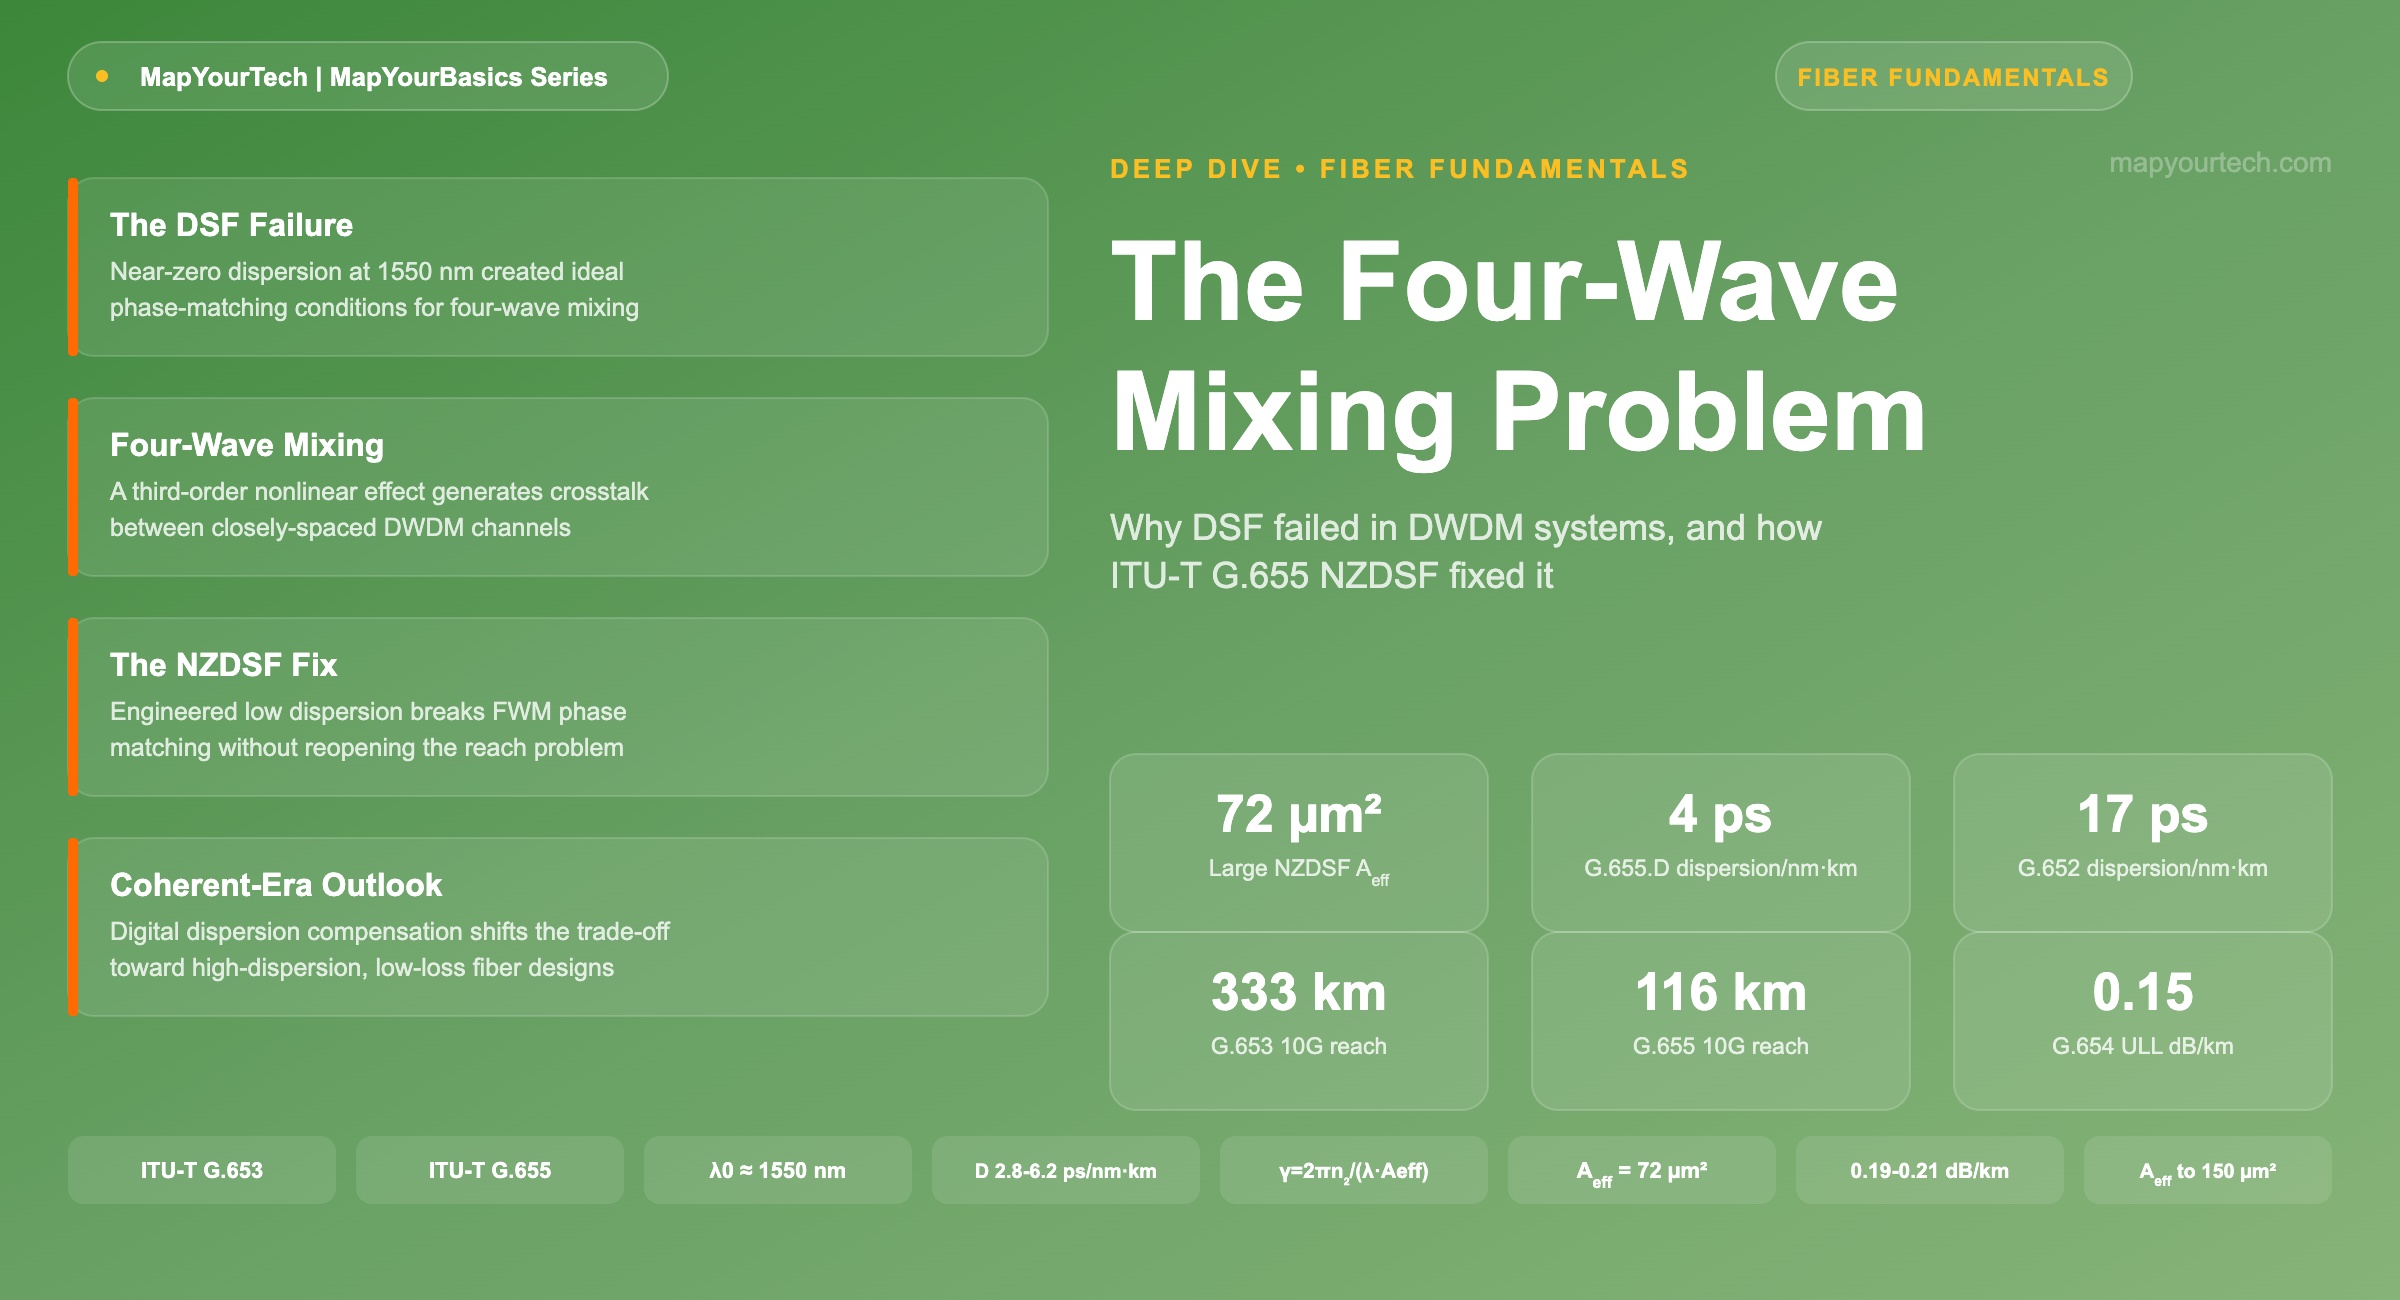
Dispersion-Shifted Fiber at 1550 nm: The Four-Wave Mixing Problem and the NZDSF Solution
How a fiber engineered to erase chromatic dispersion at 1550 nm became the reason early DWDM systems failed to scale, and how ITU-T G.655 non-zero dispersion-shifted fiber fixed it without giving the dispersion problem back.
1. Introduction
In 1996, ITU-T Recommendation G.653 formalized a fiber design that looked, on paper, like the answer to the pulse-broadening problem at 1550 nm: push the zero-dispersion wavelength up from 1310 nm into the erbium-doped fiber amplifier's gain band, and chromatic dispersion effectively disappears exactly where fiber loss is lowest [standard-specified, ITU-T G.653]. Dispersion-shifted fiber (DSF) shipped in volume through the early 1990s on that promise, well before dense wavelength-division multiplexing (DWDM) existed as a commercial category. When carriers later tried to light multiple wavelengths down the same DSF strand, the fiber that was supposed to solve dispersion became the reason those multi-channel systems degraded.
The mechanism was four-wave mixing (FWM): a third-order nonlinear effect in which three co-propagating wavelengths exchange energy and generate a fourth frequency that can land directly on top of a live data channel. FWM is strongest precisely where chromatic dispersion is weakest, because low dispersion lets the interacting wavelengths stay in phase with each other over long distances — the condition nonlinear-optics literature calls phase matching. DSF's near-zero dispersion across the entire C-band made phase matching almost unavoidable, so a fiber engineered to remove one impairment maximized exposure to another.
The industry's answer was non-zero dispersion-shifted fiber (NZDSF), standardized as ITU-T G.655 in 1996 and most recently revised in 2009 [standard-specified, ITU-T G.978 (05/2025), Section 2 references]. Rather than driving dispersion to zero, G.655 fiber deliberately holds a small dispersion value — commercial G.655.D products typically run 2.8 to 6.2 ps/(nm·km) across the C-band [standard-specified, ITU-T G.655 category definitions] — high enough to break the phase-matching condition FWM depends on, but low enough that a single dispersion-compensating module can still handle the residual pulse spreading over a multi-hundred-kilometer span. Corning's LEAF fiber, introduced in 1998 with an effective area of 72 µm² and a dispersion of 4 ps/(nm·km) at 1550 nm [vendor claim, Corning LEAF product information], and Lucent's (now Nokia/OFS) TrueWave family, first commercialized in 1993–1994 [measured/historical, Lightwave Online], defined the terrestrial long-haul network for the better part of a decade.
This article traces why DSF failed once channel count exceeded one, works through the physics governing FWM's dependence on dispersion and channel spacing, and shows how NZDSF's engineered dispersion profile solves the problem without reintroducing the pulse spreading DSF was built to avoid. It closes by placing both fiber types against the coherent-detection, digital-signal-processing (DSP) systems that dominate new deployments today — where the dispersion-tolerance calculus has shifted a second time.
2. Chromatic Dispersion Fundamentals
Chromatic dispersion arises because different wavelength components of an optical pulse travel at different group velocities through a fiber. Two effects combine to produce it: material dispersion, from the wavelength-dependence of silica's refractive index, and waveguide dispersion, from the fraction of optical power guided in the core versus the cladding. The two partially cancel, and the wavelength at which their sum crosses zero is called the zero-dispersion wavelength, written λ0.
For the standard single-mode fiber defined in ITU-T G.652 — the fiber type installed across the majority of terrestrial and access networks worldwide — λ0 sits near 1310 nm by design, because that was the operating wavelength of the first practical single-mode transmitters. G.652 fiber's dispersion coefficient at 1550 nm runs approximately 17 ps/(nm·km), rising to roughly 19 ps/(nm·km) by 1565 nm [standard-specified, ITU-T G.Sup.39 (03/2025), Table 9-3]. That number matters because 1550 nm is also where silica fiber loss is lowest — around 0.19 to 0.21 dB/km for modern G.652 fiber [measured, ITU-T G.978 (05/2025), Table 10-4] — and it is the band the erbium-doped fiber amplifier (EDFA) was built to serve. Every long-haul system therefore wanted to operate at the low-loss, amplifier-friendly wavelength, but doing so on G.652 fiber meant carrying a dispersion coefficient roughly five times its value at 1310 nm.
- Δτ
- Accumulated pulse spreading (ps)
- D
- Chromatic dispersion coefficient at the operating wavelength (ps/(nm·km))
- L
- Fiber length (km)
- Δλ
- Source spectral width (nm)
The two components behind λ0 respond to different design levers, which is what makes dispersion-shifting possible at all. Material dispersion is fixed by the glass itself and cannot be engineered away within silica-based fiber. Waveguide dispersion, by contrast, depends on the core-cladding refractive-index profile and core diameter — parameters a fiber designer controls directly during the preform and draw process. Narrowing the core and steepening the index profile increases the (negative-signed) waveguide dispersion term, pulling the sum further from the material-dispersion curve and shifting λ0 to a longer wavelength. This is the exact mechanism DSF exploited, and it is also why DSF's smaller core, and consequently smaller effective area, was never a side effect — it was the direct mechanical cost of moving λ0 nearly 240 nm from where G.652 fiber puts it.
Run the numbers on a 100 km G.652 span carrying 10 Gbit/s NRZ at 1550 nm: 17 ps/(nm·km) × 100 km × a few tenths of a nanometer of source width already consumes a meaningful fraction of the 1,175 ps/nm budget. Push to 40 Gbit/s and the same fiber becomes dispersion-limited at well under 10 km without compensation — a genuine bottleneck for 1990s systems that had no practical way to undo chromatic dispersion once it accumulated. The engineering response was direct: if dispersion at 1550 nm is the problem, redesign the fiber's waveguide so λ0 itself sits at 1550 nm instead of 1310 nm. That fiber is dispersion-shifted fiber (DSF), standardized as ITU-T G.653.
Why a Second Impairment Was Waiting
Chromatic dispersion is a linear effect — it broadens pulses but does not, by itself, generate new frequencies or transfer energy between channels. Fiber nonlinearity is different. Silica exhibits the Kerr effect: its refractive index depends weakly on the local optical intensity. That intensity dependence is what allows one wavelength to influence another as both propagate together, and it is quantified by the fiber's nonlinear coefficient.
- γ
- Nonlinear coefficient (W⁻¹·km⁻¹)
- n₂
- Nonlinear refractive index of the core glass, approximately 2.1–3.2 × 10⁻²⁰ m²/W for doped-silica telecom fiber (measured, varies with core dopant)
- λ
- Operating wavelength (m)
- Aeff
- Effective core area (m²)
The nonlinear coefficient sets the strength of several distinct effects: self-phase modulation, cross-phase modulation, stimulated Brillouin and Raman scattering, and four-wave mixing. All of them scale with γ and with launch power, but only FWM has a dependence on chromatic dispersion strong enough to make a fiber's dispersion profile the primary design lever against it. That dependence is the subject of Section 3, and it is the reason DSF's greatest strength — near-zero dispersion — turned into its defining weakness the moment a second wavelength was added to the fiber.
3. Four-Wave Mixing: Mechanism and Technical Architecture
Four-wave mixing is a third-order parametric process: three optical fields at frequencies f1, f2, and f3 mix through the fiber's Kerr nonlinearity and generate a fourth field at a new frequency. Energy conservation requires f4 = f1 + f2 − f3, and the process is only efficient when the participating waves also satisfy phase matching — the condition that their propagation constants sum to nearly zero [standard-specified, general nonlinear-fiber-optics theory; consistent derivation in project reference material]. In a DWDM comb with evenly spaced channels, this generates FWM products that fall exactly on top of existing channel frequencies, turning the effect from a spectral curiosity into a direct source of crosstalk.
- f1,f2,f3,f4
- Optical frequencies of the three generating channels and the FWM product
- β(f)
- Propagation constant of the fiber mode at frequency f (rad/km)
- Δβ
- Phase mismatch between the interacting waves (rad/km)
Why Zero Dispersion Maximizes the Effect
Δβ is small — and FWM efficient — when the interacting waves travel at nearly the same group velocity, which is precisely the condition low chromatic dispersion creates. Near a fiber's zero-dispersion wavelength, channels spaced 50 or 100 GHz apart drift out of phase with each other extremely slowly, so the phase-matching condition holds over long interaction lengths and FWM power accumulates coherently span after span. Move away from λ0 and dispersion reintroduces a velocity difference between channels; they walk off each other's phase faster, Δβ grows, and the FWM product's power stops accumulating constructively.
- η
- FWM efficiency, 0 to 1 (dimensionless)
- α
- Fiber attenuation coefficient (km⁻¹, natural-log basis)
- L
- Span length (km)
- Δβ
- Phase mismatch from the equation above (rad/km)
- Pijk
- Generated FWM product power (W)
- Ddeg
- Degeneracy factor — 3 for two-tone mixing, 6 for three distinct tones
- γ
- Nonlinear coefficient from Section 2 (W⁻¹·km⁻¹)
- Leff
- Effective interaction length, (1−e-αL)/α (km)
- Pi,j,k
- Launch power of each interacting channel (W)
Conditions That Make FWM Severe
Three conditions compound to make FWM a practical limit rather than a laboratory curiosity: low local chromatic dispersion, narrow channel spacing, and high per-channel launch power. Systems using 50 GHz spacing experience measurably more FWM crosstalk than 100 GHz systems on the same fiber, and coarse WDM (CWDM), with its 20 nm channel grid, is effectively immune because the huge frequency separation keeps Δβ large under any realistic dispersion value [measured/standard-specified, consistent with project reference material on FWM channel-spacing dependence]. Because FWM power scales with the product of three channel powers, halving launch power per channel reduces generated FWM power by roughly a factor of four to eight depending on channel combination — a lever operators used routinely on DSF-based systems before NZDSF became available, at the direct cost of reach.
4. Design Considerations: From DSF to NZDSF
ITU-T G.653 dispersion-shifted fiber achieves its near-zero dispersion at 1550 nm through waveguide design rather than a change in glass chemistry. A triangular or graded core-index profile increases waveguide dispersion — which carries a negative sign relative to material dispersion — until it nearly cancels material dispersion at the target wavelength [standard-specified, consistent with ITU-T G.653 scope definition]. The trade-off is a smaller effective area than standard SMF, typically in the range of roughly 50 µm² for early DSF designs versus 80 µm² or more for G.652 fiber [measured, historical fiber-industry literature] — a smaller core concentrates optical intensity and raises the nonlinear coefficient γ even before dispersion is considered, compounding the FWM exposure the near-zero dispersion already creates.
Non-zero dispersion-shifted fiber solves the phase-matching problem by relocating λ0 outside the amplified transmission band rather than trying to eliminate dispersion inside it. Two design families emerged in the 1990s, distinguished by which side of the C-band λ0 lands on:
- Positive-dispersion NZDSF (NZDSF+): λ0 pushed below roughly 1500 nm, leaving positive, rising dispersion across 1530–1565 nm. Lucent's original TrueWave fiber, commercialized in 1993–1994, followed this approach [measured/historical, Lightwave Online; Grokipedia summary of NZDSF history].
- Negative-dispersion NZDSF (NZDSF−): λ0 pushed above roughly 1580 nm, leaving negative dispersion across the C-band. Corning's original SMF-LS design used this approach before the company moved to the positive-dispersion LEAF design in 1998 [measured/historical, Lightwave Online, "Optical-fiber designs evolve," 1998].
Corning's LEAF fiber illustrates how far the second-generation NZDSF design pushed beyond simply relocating λ0. LEAF combines a positive dispersion of 4 ps/(nm·km) at 1550 nm with an effective area of 72 µm² [vendor claim, Corning LEAF product information sheet] — roughly 30% larger than a typical DSF core [vendor claim, Lightwave Online, "Optical-fiber designs evolve"]. Because FWM product power depends on the nonlinear coefficient squared (Section 3, formula 3), and γ is inversely proportional to Aeff, enlarging the core suppresses FWM by a second, independent mechanism on top of the dispersion-driven phase mismatch — a compounding effect rather than a redundant one.
Five Categories, One Design Principle
ITU-T G.655 is not a single fiber specification — it defines five sub-categories, labeled A through E, distinguished mainly by how tightly they bound dispersion across the operating band and how far that band extends beyond the original 1530–1565 nm C-band window. Categories A and B date to the original 1996 Recommendation and specify dispersion as a flat minimum and maximum across the C-band. The 2006 revision added categories D and E specifically because system designers wanted per-wavelength dispersion values rather than a single band-wide bound, since real NZDSF dispersion rises measurably with wavelength rather than staying flat [standard-specified, Lightwave Online, "ITU revises Recommendation G.655"]. G.655.D covers low-dispersion fiber, with dispersion at 1550 nm specified from roughly 2.80 to 6.2 ps/(nm·km); G.655.E covers medium-dispersion fiber, running roughly 4 to 9 ps/(nm·km) over the same window [standard-specified, Lightwave Online; cross-checked against QSFPTEK/FS technical references]. Category C retains the original band-wide bound of 1–10 ps/(nm·km) across 1530–1565 nm without the tighter per-wavelength structure [standard-specified, ResearchGate technical discussion of ITU-T G.655]. In practice, C, D, and E are the categories manufacturers actually ship; LEAF is G.655.D-compliant, placing it at the low-dispersion end of the family — enough to break FWM phase matching, not so much that a long-haul span needs aggressive optical compensation.
Sizing the Residual Dispersion Budget
NZDSF's engineered dispersion is a deliberate compromise, not a free win: every picosecond-per-nanometer-per-kilometer added to suppress FWM has to be paid back somewhere in the link budget, typically with a dispersion-compensating module (DCM) or compensating fiber (DCF) at the receive end or at intermediate amplifier sites.
Practical Example — Migrating a 120 km DWDM Span from DSF to NZDSF
Scenario: An 8-channel, 100 GHz-spaced DWDM system is lit on an existing 120 km G.653 span, with an EDFA booster launching approximately +2 dBm per channel. Within days of turn-up, an optical spectrum analyzer shows sidebands growing symmetrically around each channel as launch power increases — the signature of FWM generated near the fiber's zero-dispersion wavelength.
Implementation: The operator has two practical levers on the existing DSF: cut launch power, which trades reach for lower crosstalk, or replace the span with G.655 NZDSF, whose 4–6 ps/(nm·km) dispersion pushes Δβ far enough from zero to collapse η without touching the amplifier chain or channel plan.
Outcome: Re-sheathing the span in NZDSF restores the full 8-channel plan at the original launch power, at the cost of one low-slope dispersion-compensating module per multi-span segment to manage the roughly 480–720 ps/nm of accumulated dispersion over 120 km — a fraction of the 2,040 ps/nm a G.652 span of the same length would accumulate at 17 ps/(nm·km).
Takeaway: NZDSF does not eliminate the dispersion-compensation problem DSF was built to avoid — it right-sizes it. By holding dispersion in the low single digits rather than at zero, G.655 fiber breaks FWM phase matching while keeping the residual compensation burden small enough for a modest DCM rather than the aggressive, per-span optical compensation direct-detection G.652 systems required.
5. Implementation and Deployment Practice
NZDSF reached commercial volume through the same late-1990s DWDM buildout that exposed DSF's FWM weakness in the first place. TrueWave established the category from 1993–1994, and Corning's LEAF, introduced in 1998, became — in the manufacturer's own description — the most widely deployed NZDSF in the world, backed by low-loss variants reaching 0.19 dB/km at 1550 nm [vendor claim, Corning press material, 2011]. Prysmian's TeraLight and later OFS TrueWave RS (Reduced Slope) rounded out the field, with TrueWave RS specifically engineered for flatter dispersion slope across a wider wavelength range than the original TrueWave design [vendor claim, industry fiber-comparison references].
Deploying NZDSF in a live network means engineering three things together: the dispersion map, the channel launch power, and the amplifier placement. Because G.655 fiber's dispersion is an order of magnitude below G.652's, per-span accumulated dispersion is proportionally smaller — which shortens the reach at which a DCM becomes mandatory, but does not eliminate the need for one on long-haul spans. A typical G.655.D long-haul design compensates dispersion at every second or third amplifier site rather than at every site, versus the near-continuous compensation direct-detection G.652 systems needed at the bit rates common in the 2000s.
Channel spacing and launch power stay coupled to the fiber choice throughout the design process. A 50 GHz-spaced NZDSF system pushes Δβ closer to zero than a 100 GHz system on the same fiber, so tighter channel grids partially erode the FWM suppression NZDSF provides — engineers compensate by keeping per-channel launch power a few decibels below what an equivalent G.652 system would use, or by favoring phase-diverse modulation formats such as QPSK over on-off keying, since lower peak power per symbol reduces every power-cubed nonlinear term simultaneously [standard-specified relation, consistent with FWM power formula in Section 3].
Fiber qualification and splicing practice differ from a G.652 build as well. Because G.655 fiber's mode field diameter and effective area differ from G.652, splicing NZDSF to legacy G.652 plant — common at network boundaries where a long-haul NZDSF ring meets a G.652 metro tail — requires attention to mode-field mismatch loss, which can run several tenths of a decibel per splice if fusion parameters are not adjusted for the dissimilar fiber geometry. Field technicians qualifying a new NZDSF span typically run an OTDR trace at multiple wavelengths (1310, 1550, and 1625 nm are common test points) both to confirm attenuation matches the vendor's per-kilometer specification and to catch macrobend-induced loss, since NZDSF's smaller mode field diameter relative to G.652 makes it somewhat more bend-sensitive at tight cable-management radii. None of this is exotic compared to G.652 installation practice, but it is a real, line-item cost that factored into operators' fiber-choice decisions once G.652.D with coherent DSP became a viable substitute.
Polarization also plays a role operators use in practice: FWM efficiency depends on the relative polarization state of the interacting channels, and systems that intentionally interleave orthogonal polarization states across adjacent DWDM channels see measurably lower FWM crosstalk than systems where all channels share a polarization state [measured, consistent with polarization-dependence findings in nonlinear fiber-optics literature]. This technique costs nothing in fiber or amplifier hardware and is commonly layered on top of the fiber-level dispersion engineering already discussed.
6. Performance Analysis and Trade-offs
The clearest way to see the DSF-to-NZDSF trade-off is to compare dispersion-limited reach directly. ITU-T G.Sup.39 works a chirp-free, narrow-linewidth NRZ example at 1565 nm for a 1 dB dispersion penalty across three fiber types, and the spread is stark.
Chart 1. Dispersion-limited reach at 1565 nm, 1 dB penalty, chirp-free NRZ source [standard-specified, ITU-T G.Sup.39 (03/2025), Table 9-3]. Logarithmic y-axis.
Read purely for chromatic-dispersion-limited reach, G.653 looks like the best fiber in the table by a wide margin — 333 km at 10 Gbit/s versus 61 km for G.652 and 116 km for G.655. That comparison is exactly what makes DSF's DWDM failure counterintuitive: the fiber with the longest dispersion-limited reach on a single channel was the fiber that collapsed first once a second wavelength was added, because dispersion-limited reach and FWM-limited reach are governed by opposite dependencies on the same parameter. G.655's shorter dispersion-limited reach relative to G.653 is the price paid for FWM suppression — and on a multi-channel system, it is the only one of the two numbers that determines whether the link works at all.
The second axis of the trade-off is launch power. Every nonlinear effect in a fiber, including FWM, has a practical onset threshold below which it stays below the noise floor and above which it starts to measurably degrade OSNR. These thresholds are order-of-magnitude guidance rather than fixed constants — actual onset depends on fiber type, span length, and channel plan — but they illustrate why FWM was historically the first nonlinear effect operators had to design around in dense, low-dispersion systems.
Chart 2. Typical order-of-magnitude onset power thresholds by nonlinear effect in a representative DWDM channel [typical/illustrative guideline values — actual thresholds vary with fiber type, span length, and channel plan].
FWM's threshold sits lowest among the five effects shown, which is consistent with it being the dominant impairment on low-dispersion fiber long before self-phase modulation or stimulated Raman scattering become limiting. That ordering flips on higher-dispersion fiber: G.652 systems running the same channel plan see FWM suppressed well below the noise floor by dispersion alone, and self-phase modulation or amplified spontaneous emission accumulation typically becomes the first limit instead.
On a live system, FWM shows up first as a slow degradation in Q-factor or bit-error rate that correlates with launch power rather than distance — the tell that distinguishes it from a simple attenuation or OSNR budget problem. Because each FWM product draws power away from the channels that generated it as well as adding crosstalk to whichever channel it lands on, the practical symptom is often asymmetric: channels near the center of a dense wavelength plan, where the largest number of three-channel combinations can phase-match, degrade measurably faster than channels at the edge of the band. Field engineers troubleshooting a suspected FWM problem typically confirm it with an optical spectrum analyzer rather than a BERT alone, looking for spectral sidebands at the predicted f1+f2−f3 frequencies before touching the amplifier chain or channel plan — ruling out FWM early avoids chasing what looks like an OSNR problem with power increases that would only make a real FWM problem worse.
| OTDR Wavelength (nm) | G.655 Average (dB/km) | G.652 Average (dB/km) |
|---|---|---|
| 1310 | 0.361 | 0.343 |
| 1551 | 0.209 | 0.192 |
| 1621 | 0.230 | 0.209 |
Measured OTDR data across a sample of 216 G.655 and 55 G.652 fiber links [measured, ITU-T G.Sup.39 (03/2025), Table 10-4]. G.655 fiber runs approximately 0.015–0.021 dB/km higher attenuation than G.652 across this wavelength range, a modest but real cost of the NZDSF waveguide design.
7. Comparison and Alternatives
G.653 and G.655 are two points on a five-point spectrum of ITU-T single-mode fiber types built around 1550 nm transmission, each trading dispersion, effective area, and attenuation differently.
| Fiber Type | ITU-T Rec. | λ0 (approx.) | D @1550 nm | Typical Aeff | 2026 Role |
|---|---|---|---|---|---|
| G.652 SMF | G.652 (2024) | ~1310 nm | ~17 ps/(nm·km) | ~80–82 µm² | Dominant terrestrial/access fiber; CD compensated digitally by coherent DSP |
| G.653 DSF | G.653 (2010) | ~1550 nm | ~0 ps/(nm·km) | ~50 µm² | Rare; largely superseded for WDM use due to FWM exposure |
| G.655 NZDSF | G.655 (2009) | <1500 or >1580 nm | 1–10 ps/(nm·km) | ~55–72 µm² | Legacy long-haul/metro DWDM; large installed base (e.g., LEAF, TrueWave) |
| G.654 ULL | G.654 (2024) | ~1310 nm | ~20–21 ps/(nm·km) | 112–150 µm² | Submarine and ultra-long-haul coherent systems, often paired with SDM |
| G.656 WNZDF | G.656 (2010) | outside 1460–1625 nm band | 1–14 ps/(nm·km) | ~55–70 µm² | Wideband CWDM/DWDM; niche deployment |
Values compiled from cited ITU-T Recommendations, ITU-T G.Sup.39, ITU-T G.978, and vendor product literature referenced throughout this article [standard-specified and vendor claim, mixed — see individual section citations].
A third historical alternative deserves mention alongside relocating λ0: leaving transmission fiber alone and compensating dispersion optically downstream with dispersion-compensating fiber (DCF) or fiber Bragg gratings. DCF carries a large negative dispersion — commonly around −80 ps/(nm·km) — concentrated in a short spool that cancels the positive dispersion accumulated over many kilometers of G.652 transmission fiber [standard-specified, ITU-T G.Sup.39 (03/2025), Section 9.2.2.5 worked example]. DCF solves the pulse-spreading problem without touching the transmission fiber at all, which made it attractive for upgrading existing G.652 plant, but it does nothing for FWM — the nonlinearity is generated in the transmission span itself, before the signal ever reaches the compensating module, and DCF's own small effective area makes it a nonlinearity risk in its own right at high launch power. NZDSF and DCF address different halves of the same problem: NZDSF changes the transmission fiber to suppress nonlinear generation at the source, while DCF corrects the linear pulse spreading after the fact. Many G.655 long-haul builds used a lighter-touch DCF stage precisely because NZDSF's already-small residual dispersion left less for the DCF to do.
DSF's practical alternative in 2026 is not a return to G.653 — it is simply G.652.D fiber paired with a coherent transponder. Digital coherent receivers compensate chromatic dispersion entirely in the digital domain; one widely cited laboratory demonstration compensated over 107,000 ps/nm of accumulated dispersion electronically after 6,400 km of standard single-mode fiber [measured, laboratory demonstration, Optics Express]. Once CD compensation moves to DSP, a fiber's dispersion coefficient stops being a reach-limiting liability and becomes, counter-intuitively, a nonlinear-tolerance asset — the subject of Section 8.
8. Future Directions
Coherent DSP has quietly inverted the design goal DSF and NZDSF were both built to serve. When chromatic dispersion is compensated digitally rather than optically, high local dispersion is no longer a problem to be minimized — it is a mechanism that spreads channel walk-off faster, which reduces cross-phase modulation and pushes nonlinear tolerance up. Numerical studies of polarization-multiplexed coherent systems have found a minimum dispersion coefficient near 4–8 ps/(nm·km) is what maximizes nonlinear-impairment reduction for both PM-QPSK and PM-16QAM/64QAM signals [modeled, ScienceDirect, "On the benefits brought by fiber chromatic dispersion in coherent communication networks"] — a range that happens to overlap the dispersion NZDSF was engineered to hold for an entirely different reason three decades earlier. G.652.D fiber, with roughly 17 ps/(nm·km), sits comfortably above that floor without any waveguide redesign, which is a large part of why new terrestrial coherent deployments default to G.652.D rather than G.655 today.
Submarine and ultra-long-haul systems are converging on a different fiber family: ITU-T G.654 ultra-low-loss, large-effective-area fiber, with attenuation as low as 0.15 dB/km and effective areas up to 150 µm² in commercial G.654.D products [standard-specified/measured, project reference table of commercial low-loss fiber offerings]. A widening body of techno-economic analysis on space-division multiplexing (SDM) submarine cables adds a further twist: once systems scale to dozens of parallel fiber pairs, per-fiber optical power falls low enough that nonlinear effects become secondary to linear noise accumulation, and the analysis concludes low-nonlinearity, large-effective-area fiber will not be needed for future massive-SDM submarine systems at all [modeled, project reference techno-economic analysis of SDM submarine systems]. Cisco's own 2026 submarine guidance points the same direction — 12 to 24-plus fiber pairs per cable, lower per-fiber spectral efficiency, and reduced nonlinear exposure by design rather than by fiber choice [vendor material, Cisco BRKOPT2556, 2026].
None of this retires NZDSF outright. G.655 fiber remains lit in a substantial installed base of metro and regional long-haul rings built during the late-1990s and 2000s DWDM buildout, and operators upgrading those rings to coherent 100G or higher still have to account for its dispersion profile, effective area, and PMD characteristics when qualifying new transponders — the fiber does not change, only the equipment reading it does. The practical lesson DSF and NZDSF leave for 2026 network design is less about a specific fiber type and more about the underlying principle: any single physical parameter optimized in isolation, whether dispersion, effective area, or spectral efficiency, tends to move a different impairment into first place, and the fiber types that succeeded across three decades of DWDM — G.655 after G.653, G.652.D and G.654 after G.655 — are the ones that treated dispersion, nonlinearity, and loss as one coupled system rather than three separate problems.
Conclusion
DSF's failure was never a design error in the narrow sense — G.653 fiber did exactly what it was specified to do, eliminating chromatic dispersion at 1550 nm with genuine precision. Its failure was a scope error: it was optimized for a single-channel world that DWDM ended within a few years of DSF reaching volume production. NZDSF's contribution was not a bigger fix but a better-scoped one, treating dispersion as a parameter to be tuned rather than eliminated, and holding it exactly where FWM breaks down without reopening the reach problem G.652 fiber already had. That same discipline — sizing a design parameter to the coupled set of impairments it actually faces, rather than to the one impairment it was named after — is what carried the industry from NZDSF to coherent G.652.D and now toward G.654 and SDM, and it will likely outlast every specific fiber type discussed in this article.
References
- ITU-T Recommendation G.653 — Characteristics of a Dispersion-Shifted, Single-Mode Optical Fibre and Cable, ITU-T Study Group 15.
- ITU-T Recommendation G.655 — Characteristics of a Non-Zero Dispersion-Shifted Single-Mode Optical Fibre and Cable, ITU-T Study Group 15.
- ITU-T Recommendation G.654 — Characteristics of a Cut-off Shifted Single-Mode Optical Fibre and Cable, ITU-T Study Group 15.
- ITU-T G-series Supplement 39 — Optical System Design and Engineering Considerations, ITU-T Study Group 15.
- ITU-T Recommendation G.978 — Characteristics of Optical Fibre Submarine Cables, ITU-T Study Group 15.
- Sanjay Yadav, "Optical Network Communications: An Engineer's Perspective" – Bridge the Gap Between Theory and Practice in Optical Networking.
Related Articles on MapYourTech