
Power Equalization Methodology for DWDM Line Systems
Where per-channel power is measured, what it is measured against, and the ordered sequence of gain, tilt and per-slot commands that hold a DWDM spectrum on target from commissioning through steady-state operation.
What you can measure, you can improve.
What You Will Learn
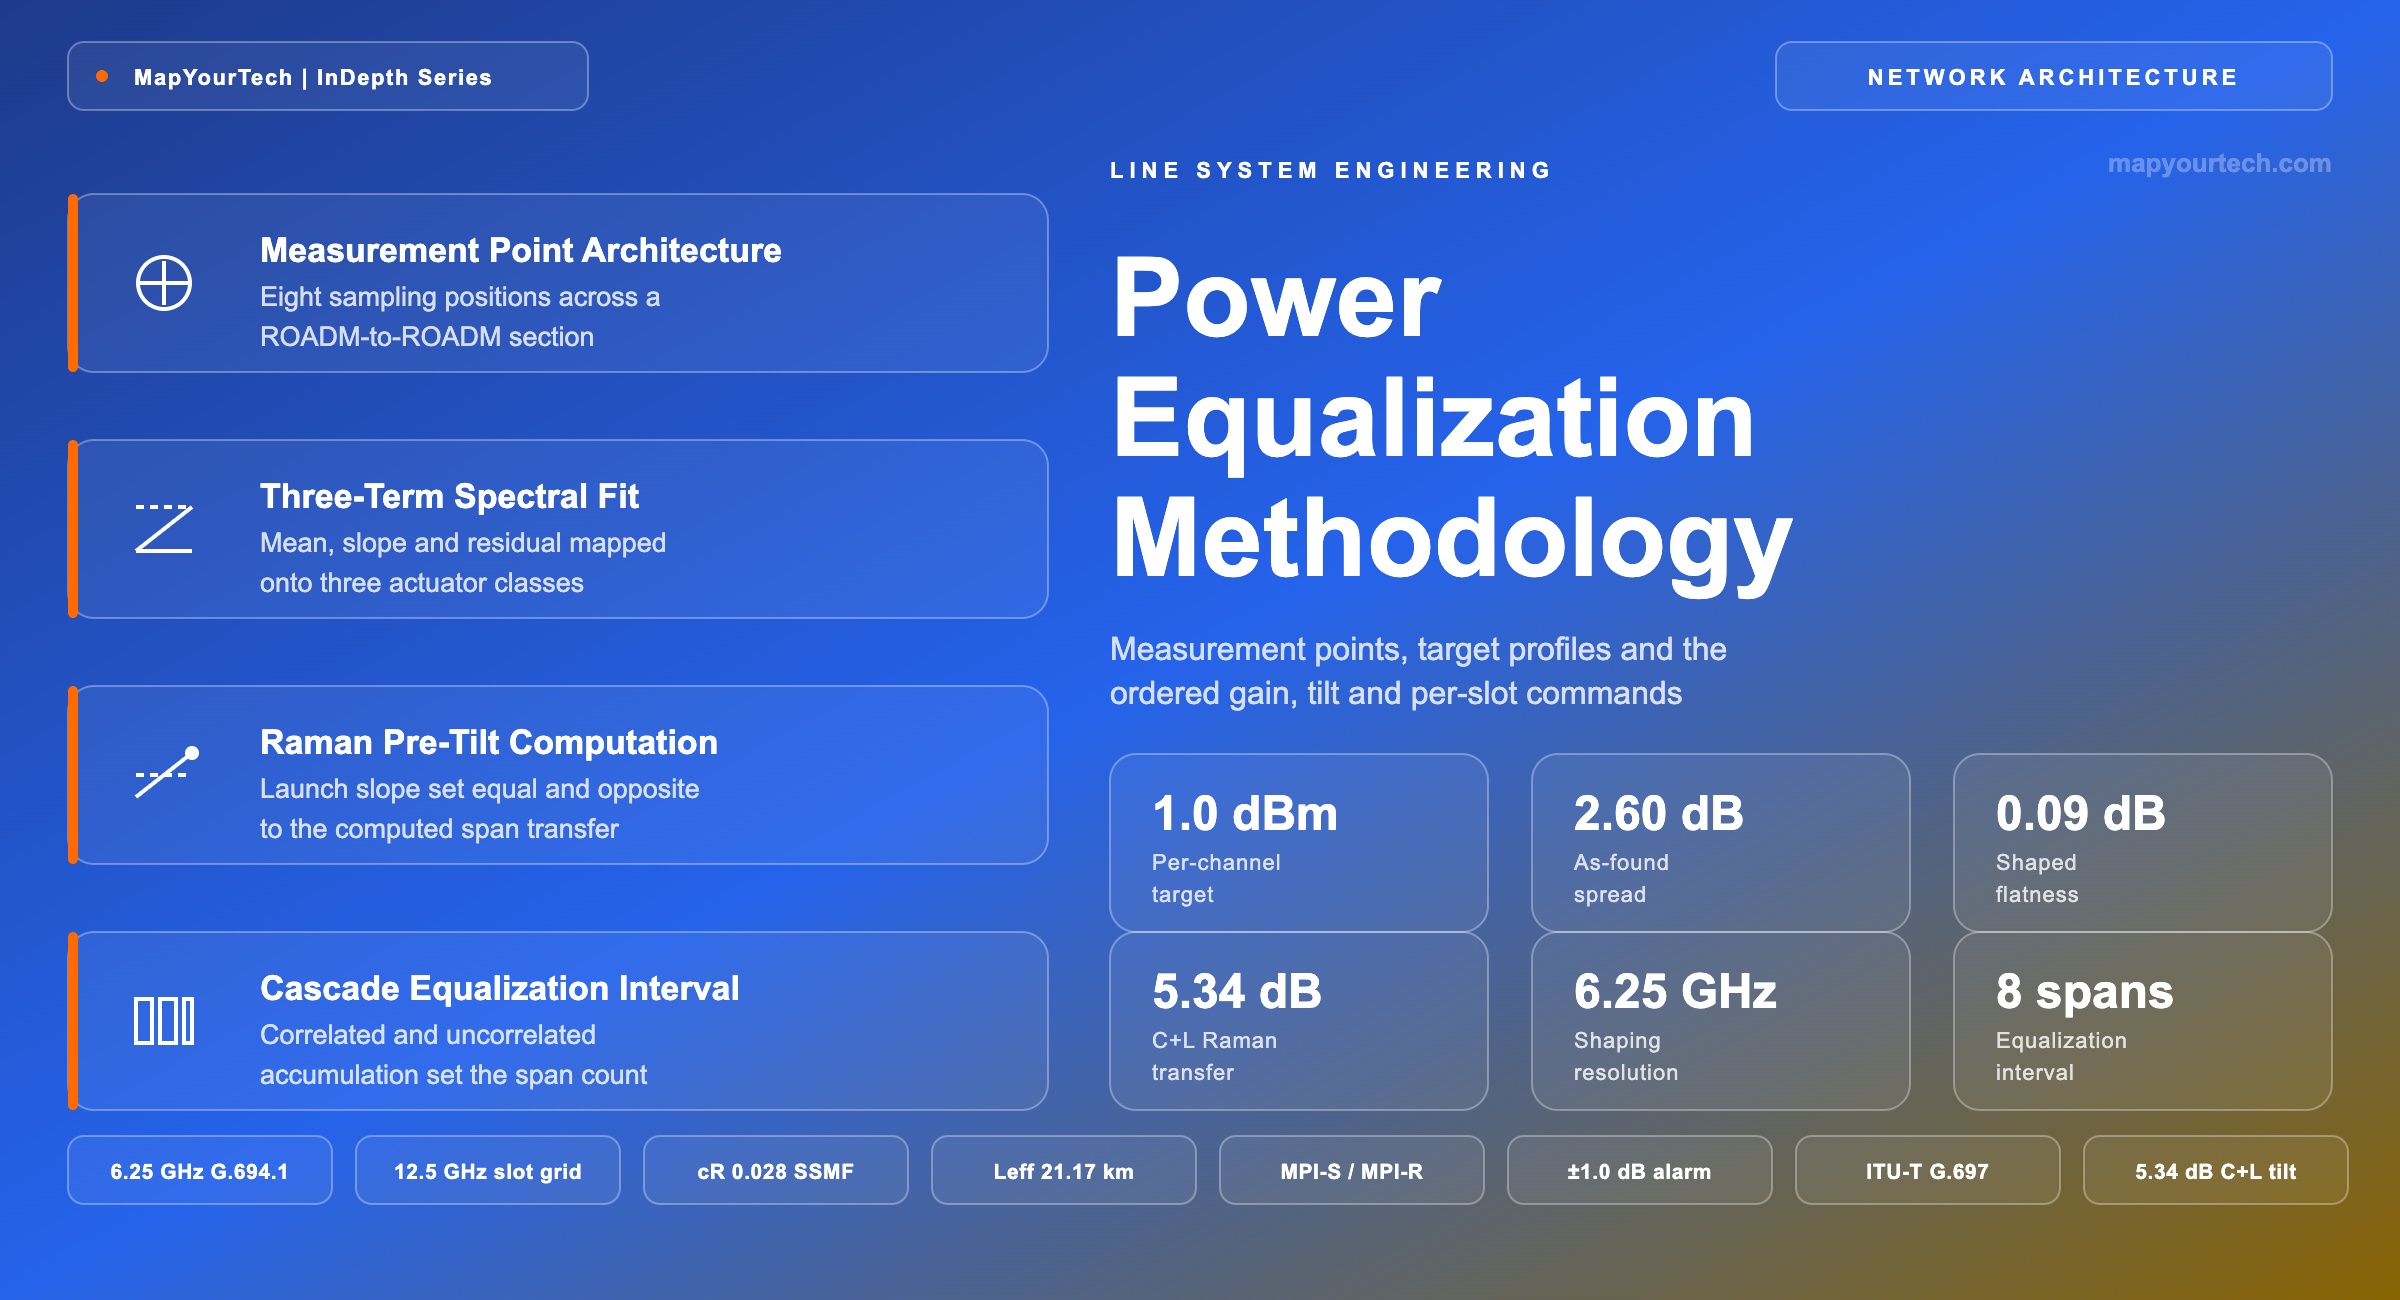
- Place the eight measurement points of an amplified line and name what each reports at the ITU-T G.959.1 reference points MPI-S and MPI-R.
- Select among four target-profile classes: flat power, flat power spectral density, pre-tilted for flat arrival, and flat generalized OSNR.
- Convert a 20 dBm booster output across 80 carriers into a 1.0 dBm per-channel target, and a −17.7 dBm/GHz density target into 1.0 dBm and −2.0 dBm for 400G and 200G carriers.
- Resolve a measured sweep into mean, slope and residual, and read off the two scalar commands that take 2.60 dB peak-to-peak down to 0.49 dB.
- Compute Raman power transfer from the triangular approximation: 1.22 dB across the C-band at 20 dBm and 5.34 dB across C+L at 23 dBm over an 80 km span.
- Set the equalization interval from correlated and uncorrelated accumulation, which puts the boundary at eight spans for a ±1.5 dB flatness budget.
- Build the commissioning sequence from span characterization through spectral fill to steady-state trending, with an exit criterion at every stage.
- Diagnose ten divergence signatures from their measurement fingerprint, in a system where a channel running 3 dB low raises no alarm at all.
1. Introduction
Power equalization is the procedure that holds every carrier in a DWDM spectrum at its assigned power, measured at a named reference point, against a target profile the network controller computed in advance. It is not amplifier tuning and it is not a one-time commissioning activity. It is a measurement-driven control cycle with three actuator classes, one convergence test, and a documented cost every time the cycle runs.
The reason it earns a methodology rather than a procedure card is that the quantity being controlled is invisible to the alarm system. A coherent transponder with soft-decision forward error correction (FEC) and probabilistic constellation shaping (PCS) converts a power deficit into a lower delivered bit rate rather than into a failure. A carrier sitting 3 dB below target still passes traffic, still reports a clean pre-FEC bit error rate, and still shows green on every management screen — it simply delivers 400 Gb/s where the design promised 600 Gb/s. Across 96 carriers on a line built for 800G-class rates, a spectrum that has drifted 3 dB peak-to-peak can give back a quarter of its designed throughput with nothing in the alarm log to explain where it went.
Three forces move carriers off target, and they act on different timescales. Fiber attenuation varies across the occupied band and repeats identically at every span of the same fiber type. Erbium-doped fiber amplifier (EDFA) gain shape depends on average inversion, so an amplifier running off its nominal gain applies a slope nobody commanded. And inter-channel stimulated Raman scattering (ISRS) transfers power continuously from shorter wavelengths to longer ones in proportion to total launched power, which is why the discipline changed character the moment operators started filling the L-band alongside the C-band. The network-level strategy for spectral flatness covers those mechanisms and how they accumulate; this article covers the procedure that answers them.
Scope is deliberately narrow and complete within itself. The article defines the target profile and the reference point it is written against, places the measurement points on an amplified line, sets out the three-term fit that turns a spectral sweep into three commandable numbers, orders the commissioning sequence with an exit criterion at each stage, computes the pre-tilt that cancels expected Raman transfer, derives the equalization interval from cascade accumulation, and closes with monitoring metrics and a diagnostic table. Every numerical value is worked through from stated inputs and labelled with its evidence class: standard-specified, measured, vendor claim, theoretical limit, or planner-computed. Readers who want the surrounding noise and nonlinear arithmetic in full will find it in the optical link engineering formula reference, whose conventions this article follows.
Takeaway: Power equalization controls a quantity that produces no alarm when it drifts. The methodology exists because the transponder will absorb a 3 dB deficit as reduced capacity rather than report it, so the measurement discipline — not the fault management system — has to find the loss.
2. Target Profiles and Flatness Definitions
A target profile is the ordered set of per-slot powers the controller intends to see at a named reference point. Equalization compares a measured sweep against that set and commands actuators to close the difference. Everything that follows depends on which profile the network was designed against, because the four common choices produce visibly different spectra and correct for different physics.
2.1 The Four Target-Profile Classes
Flat power assigns every carrier the same launch power in dBm. It is the correct target when every carrier occupies the same slot width and runs the same symbol rate, and it remains the default on uniform C-band lines carrying a single line-rate class. Flat power spectral density (PSD) assigns every carrier the same power per unit occupied bandwidth, so a wider carrier receives proportionally more power. It is the correct target the moment a line carries mixed symbol rates, because equal power across unequal bandwidths gives the narrow carrier a nonlinear disadvantage and the wide carrier a noise disadvantage.
Pre-tilted for flat arrival takes either of the first two and adds a launch slope equal and opposite to the transfer the span will apply, so the spectrum arrives on target at the far-end amplifier rather than leaving on target at the near-end one. Flat generalized OSNR (GSNR) abandons power flatness entirely and shapes launch power so that the delivered signal-to-noise ratio is uniform across the band. The profile that results is not flat and not linear — on a loaded C+L line it is close to parabolic, because the amplified spontaneous emission (ASE) contribution and the nonlinear interference (NLI) contribution vary across the spectrum in opposite directions.
| Profile class | Controlled quantity | Primary actuator | Select when |
|---|---|---|---|
| Flat power | Per-carrier power in dBm | Amplifier gain, per-slot attenuation | Uniform slot width and symbol rate across the fill |
| Flat power spectral density | Power per GHz of occupied bandwidth | Amplifier gain, per-slot attenuation | Mixed symbol rates or mixed slot widths on one line |
| Pre-tilted for flat arrival | Power at the far-end amplifier input | Amplifier tilt control | Raman transfer across the span exceeds the flatness budget |
| Flat generalized OSNR | Delivered GSNR per carrier | Per-slot attenuation with model-derived profile | Wideband or C+L lines where uniform capacity is the objective |
2.2 Flatness Metrics and What Each One Hides
Three metrics describe the same sweep and answer different questions. Peak-to-peak deviation is the difference between the strongest and weakest carrier, and it is the number most often written into an acceptance criterion — a typical design guideline for a ROADM-based line calls for channel power flatness within ±1 dB. It is also the metric most sensitive to a single outlier, so a spectrum with one badly seated connector and ninety-five well-behaved carriers reports the same peak-to-peak as a spectrum with a systematic 2 dB slope. Standard deviation across the occupied slots describes the bulk of the distribution and ignores the outlier, which is why it is the better trending metric. Fitted slope in dB/THz isolates the one component that a single amplifier command can remove, and its value is that it separates the correctable part of a deviation from the part that needs per-slot work.
Read the Full Analysis with Premium
The remaining 88% of this article — the design numbers, trade-offs and field guidance — is part of MapYourTech Premium, along with the full premium library, courses and professional tools.
You May Also Like
-
Free
-
August 22, 2026

-
Premium
-
August 22, 2026
-
Premium
-
August 22, 2026