
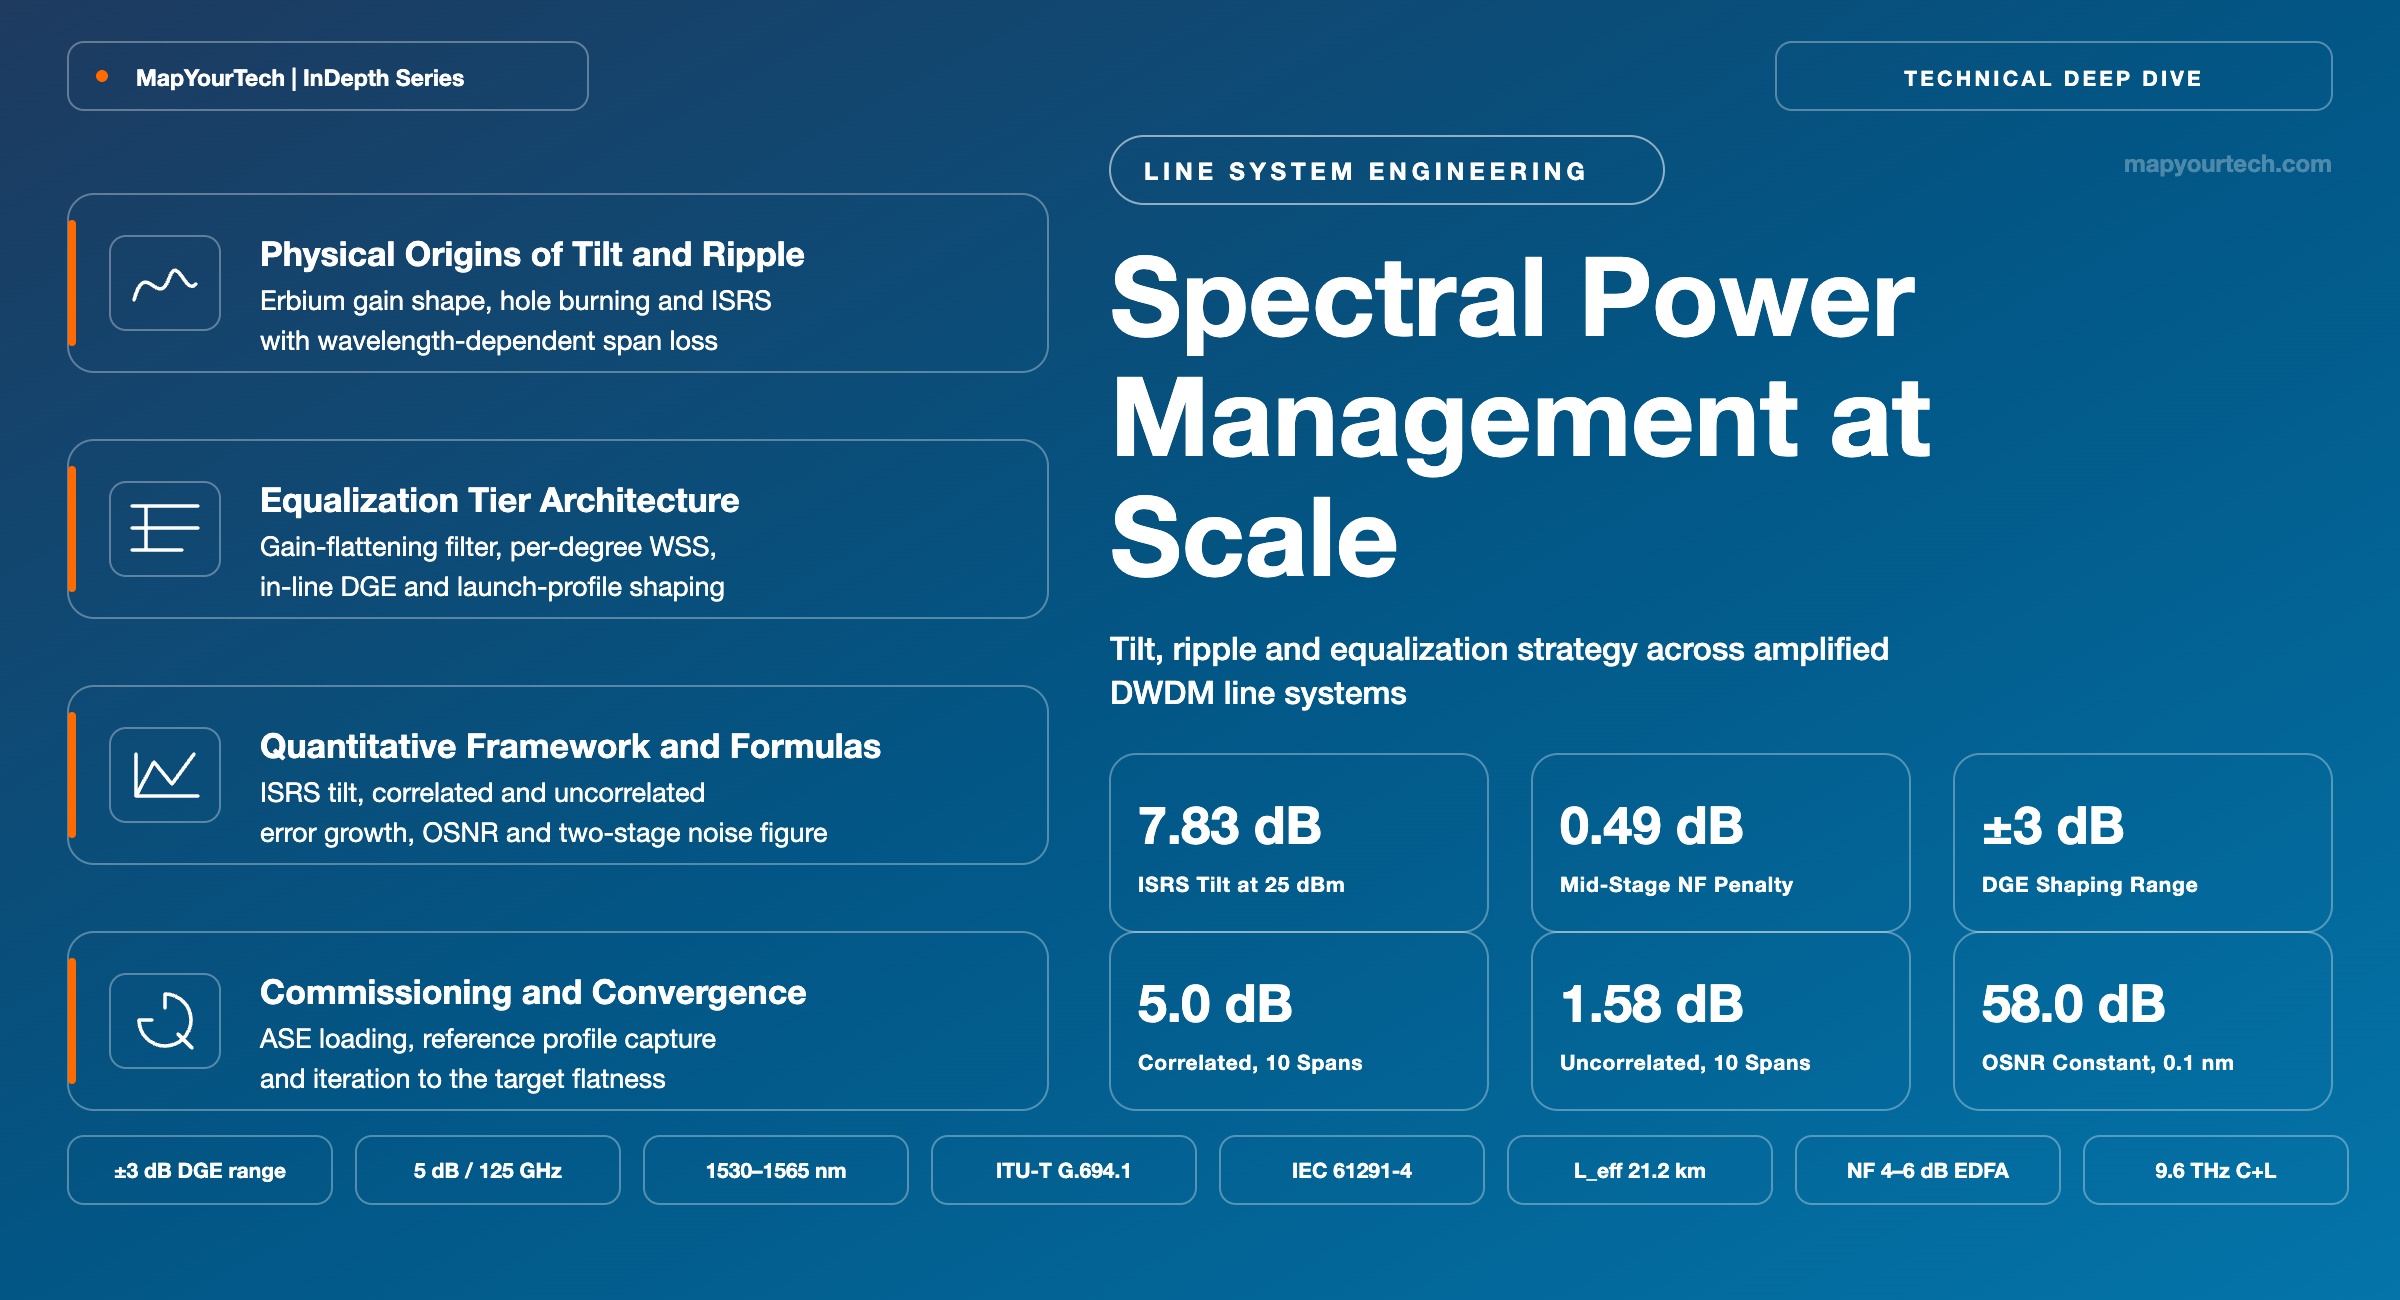
Spectral Power Management at Scale: Tilt, Ripple and Equalization Strategy
A network-level strategy for spectral flatness on amplified DWDM lines: where equalization belongs, how tilt and ripple accumulate across a cascade, and the monitoring practice that detects divergence before margin is lost.
What you can measure, you can improve.
What You Will Learn
- Separate the four physical sources of spectral non-flatness in Section 2 — erbium gain shape, ISRS tilt, wavelength-dependent span loss and filter shaping error — by their distinct spectral signatures.
- Place correction at the right tier using the four-tier hierarchy of Section 3, from the gain-flattening filter inside the amplifier to the 6.25 GHz-resolution in-line dynamic gain equalizer.
- Quantify ISRS tilt with the closed-form expression of Section 4: 3.12 dB across 9.6 THz at 21 dBm total launch, rising to 7.83 dB at 25 dBm on an 80 km G.652 span.
- Distinguish correlated growth (N × δ) from uncorrelated growth (δ√N) in Figure 5, and read the 10-span divergence of 5.0 dB against 1.58 dB from the same 0.5 dB per-span error.
- Convert a per-channel power offset into its OSNR consequence with the 58.0 dB reference-bandwidth constant, and price an equalizer's insertion loss through the two-stage noise-figure form.
- Build the commissioning sequence of Section 6 and Figure 4, from span-loss characterization through full-spectrum ASE loading to a frozen baseline profile.
- Resolve a monitored spectrum into mean level, tilt coefficient in dB/THz and residual ripple, and set the alarm thresholds proposed in Section 7.
- Select an equalization technology against the six criteria of Section 9, and diagnose a divergent line with the symptom-to-cause table of Section 8.
1. Introduction
Spectral power management is the set of controls that holds a wavelength-division-multiplexed line at its intended per-channel power profile from the first amplifier to the last. An amplified line leaves commissioning with a measured profile that matches its target profile, and the two separate afterwards because four independent mechanisms act on the spectrum, each with a different wavelength signature and a different timescale. The erbium gain medium contributes a shape that changes with operating gain. The transmission fiber contributes a tilt through inter-channel stimulated Raman scattering (ISRS) that changes with total launched power and with channel loading. The cable contributes a wavelength-dependent loss slope. The wavelength selective switches (WSS) in every reconfigurable optical add-drop multiplexer (ROADM) contribute a passband shaping error that compounds through a cascade.
Flatness is not cosmetic. It converts directly into reach. A channel sitting 2 dB below the target output power of a line amplifier leaves that span with 2 dB less optical signal-to-noise ratio (OSNR) than its neighbours, and the same 2 dB deficit repeats at every amplifier that reproduces the same shape. Required OSNR at the 0.1 nm reference bandwidth scales sharply with constellation density: approximately 13–15 dB for DP-QPSK at 100G and approximately 21–23 dB for DP-16QAM at 400G (planning-tool values, verify against the transceiver specification in use). A line whose worst channel runs 3 dB below its best has spent 3 dB of the budget that separates those two formats. Readers new to the underlying budget arithmetic will find it built up from the physics in the MapYourTech treatment of OSNR fundamentals.
The problem scales badly with bandwidth. A C-band-only line carries roughly 4.8 THz of spectrum and its Raman coupling across that width is modest. A C+L line carries roughly 9.6 THz, and the same fiber physics that produced a fraction of a decibel of tilt at 10 Gb/s direct-detection power levels now produces several decibels per span. Ultra-wideband demonstrations spanning S, C and L bands reach 15.6 THz and beyond, where the tilt across the band is large enough that the launch profile itself has to be shaped before the first span. The design question is therefore not whether to equalize but where in the line to place the correction, at what spectral resolution, and how often to recompute it.
This article treats flatness as a network-level property rather than an amplifier specification. Section 2 separates the four physical sources by their signatures. Section 3 sets out the four-tier equalization hierarchy and the standard reference points that bound each tier. Section 4 gives the arithmetic: an ISRS tilt closed form, the two accumulation laws that govern a cascade, the power-to-OSNR conversion, and the noise-figure cost of inserting an equalizer. Sections 5 and 6 cover placement decisions and the commissioning sequence that makes a profile converge. Sections 7 and 8 cover the four spectrum components a monitor should report and their failure signatures. Sections 9 through 12 compare the available technologies, look at where multi-band operation is heading, and close with a reference sheet.
Takeaway: Spectral flatness is stored margin. Every decibel of unequalized spread on the worst channel is a decibel unavailable for reach, for a higher-order modulation format, or for end-of-life ageing.
2. Physical Origins of Spectral Non-Flatness
Four mechanisms shape the spectrum of an amplified line, and each leaves a distinct signature. A broad linear slope across the whole band points at Raman transfer or an amplifier tilt setting. A repeating structure fixed to wavelength points at the erbium gain shape or a filter. A step at a band boundary points at the C/L splitter or a mismatch between two amplifier chains. A single channel out of line points at the add path, not the line. Separating these before touching a setpoint is the difference between a correction and a guess.
2.1 Erbium Gain Shape and Residual Ripple
An erbium-doped fiber amplifier (EDFA) delivers 20–30 dB of gain with a noise figure of 4–6 dB, and its gain spectrum is not flat by nature. The emission and absorption cross-sections of erbium in silica vary strongly with wavelength, so an unflattened C-band EDFA peaks near the short-wavelength end of the band. A gain-flattening filter (GFF) removes most of that shape by inserting a matched wavelength-dependent loss, and it does so exactly for one operating point. Because the medium is homogeneously broadened, changing the average inversion changes the gain shape as well as its level, so an amplifier operated away from the gain at which its GFF was designed shows a residual shape that grows with the departure. This is the mechanism behind gain-dependent tilt, and it is why a line that is flat at 17 dB of span loss can be measurably tilted at 24 dB.
The parameters that describe this behaviour are standard-specified rather than vendor-invented. IEC 61291-4 defines multichannel gain variation, multichannel gain tilt and multichannel gain-change difference, and ITU-T G-series Supplement 39 (03/2025) references those definitions as the amplifier parameters a system design works with. Two second-order effects add to the residual. Spectral hole burning produces a shallow, load-dependent depression in the gain around wavelengths carrying high power, so the shape depends on which channels are lit. Temperature changes the gain and noise figure of the doped fiber and the pump, which is why amplifiers carry thermoelectric control and are specified over a defined ambient range, commonly −5 to 70 °C for the module.
2.2 Inter-Channel Stimulated Raman Scattering
Stimulated Raman scattering transfers power from shorter wavelengths to longer wavelengths inside the transmission fiber itself. The higher-frequency channel acts as a pump and is depleted; the lower-frequency channel receives Raman gain. In silica the Raman gain profile is broad, with its maximum near a 13 THz frequency offset from the pump, which places the C-band squarely in position to pump the L-band. Between channels of one wideband comb the same process is named inter-channel stimulated Raman scattering, and its spectral consequence is an approximately linear power tilt across the occupied band, rising toward longer wavelengths.
Two properties of this tilt drive the operational design. It is load-dependent, because the transfer scales with total launched power: add or remove channels and the tilt changes, which is what makes add and drop events a transient problem rather than only a provisioning problem. And it is correlated across spans, because every span of the same fiber carrying the same comb reproduces the same transfer, so the tilt adds span by span rather than averaging out. In a fully loaded C+L system the inter-band tilt can reach approximately 8 dB per span, a figure that has to be actively managed and cannot be absorbed by a fixed setting. The band-interaction mechanics of a live upgrade are covered in the MapYourTech guide to hitless C-band to C+L capacity migration, and the amplifier-chain consequences in the C+L band DWDM primer.
Read the Full Analysis with Premium
The remaining 88% of this article — the design numbers, trade-offs and field guidance — is part of MapYourTech Premium, along with the full premium library, courses and professional tools.
You May Also Like
-
Free
-
August 22, 2026

-
Premium
-
August 22, 2026
-
Premium
-
August 22, 2026