
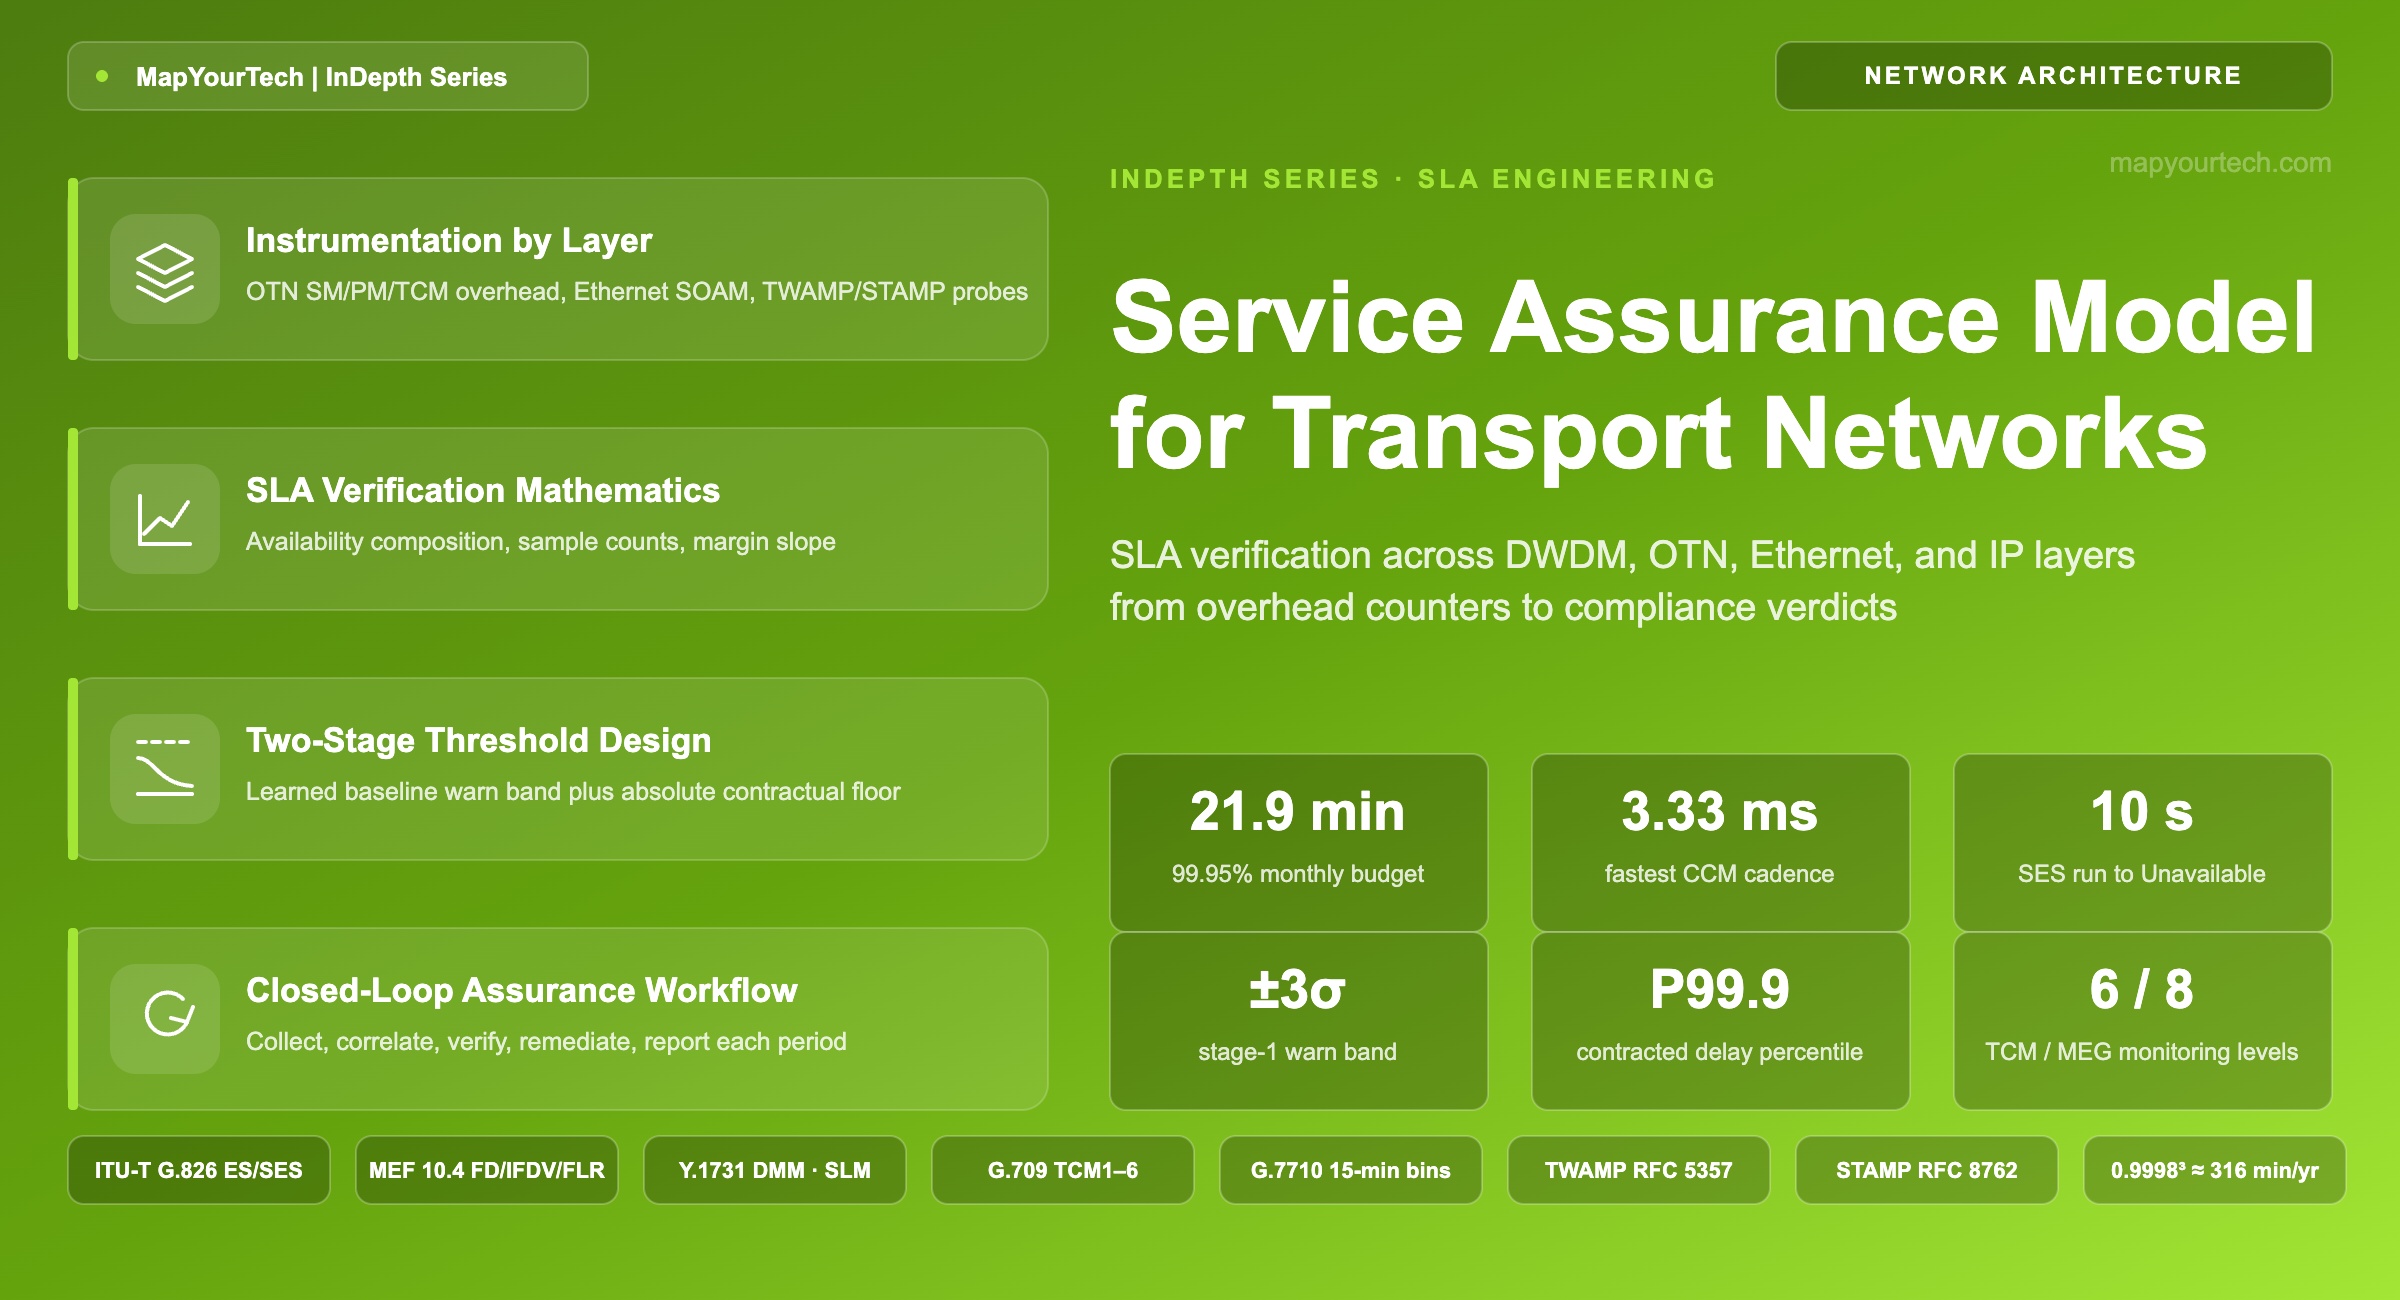
Service Assurance Model for Transport Networks
A working model for the layer that sits above raw fault management: how transport networks instrument every segment, convert overhead bits and telemetry streams into service-level evidence, and prove — mathematically and continuously — that each customer received what the contract promised.
1. Introduction
Service assurance is the discipline that verifies, continuously and per customer, that a transport network delivered the availability, delay, and loss its Service Level Agreement (SLA) promised — and that detects, localizes, and drives the correction of anything that puts that promise at risk. It sits one full abstraction above fault management: an alarm reports a failed card; assurance identifies which contracts that failure affected, by how many minutes of the monthly budget, and whether the protection path held the numbers inside the objective.
The gap between those two views is where transport operators lose money in 2026. A wholesale 400G wavelength between two metros can carry SLA commitments of 99.99% availability and sub-millisecond one-way delay bounds; the difference between 99.99% and 99.9% is the difference between roughly 52.6 minutes and 8.8 hours of permitted annual downtime (arithmetic on a 365.25-day year), and the difference between paying service credits and not. Yet the raw data that decides the question — Bit Interleaved Parity (BIP-8) block counts in Optical Transport Network (OTN) overhead, Continuity Check Messages (CCMs) at the Ethernet layer, pre-Forward-Error-Correction (pre-FEC) bit error ratio from a coherent Digital Signal Processor (DSP) — lives four layers below the contract, in different formats, on different clocks, owned by different teams.
This article builds a complete model of the layer that closes that gap. Section 2 separates assurance from the fault and performance management functions it consumes. Section 3 defines the model itself: five functions, two data classes, and one join key. Sections 4 and 5 work downward into the architecture and the per-layer instrumentation — OTN Section, Path, and Tandem Connection Monitoring (TCM); Ethernet Service Operations, Administration and Maintenance (OAM); active Internet Protocol (IP) measurement; and the coherent-optics telemetry that now feeds all of it. Section 6 develops the mathematics an SLA verification engine actually runs: availability composition, the errored-second family, frame-loss and percentile-delay estimators, and margin conversion from pre-FEC bit error ratio. Sections 7 through 12 cover implementation, benchmarking, field-representative case studies, the maturity ladder toward autonomous assurance, and the near-term direction of the discipline now that Level-4 autonomy validations cover real service-assurance use cases.
The intended reader is an engineer who owns, builds, or audits this layer: a transport operations lead deciding between polling and streaming, an Operations Support System (OSS) architect wiring a Time-Series Database (TSDB) to a service inventory, or a network architect who has to sign an SLA and then prove it every month. Foundations are explained where they appear, but the pace assumes prior production transport experience.
2. Service Assurance Versus Fault Management
The Telecommunications Management Network (TMN) framework of ITU-T M.3010 organized network management into the FCAPS functions — Fault, Configuration, Accounting, Performance, and Security — and transport equipment has implemented the F and the P faithfully for three decades. Fault management is binary and fast: a Loss of Signal (LOS) or Loss of Frame (LOF) defect is detected in hardware within milliseconds (typical detection behavior for hardware-based supervision), consequent actions such as Alarm Indication Signal (AIS) and Backward Defect Indication (BDI) propagate through the layer stack, and an alarm with a severity and a probable cause arrives in the Network Management System (NMS). Performance management is analog and slow: per-second primitives are accumulated into 15-minute and 24-hour registers, and Threshold Crossing Alerts (TCAs) are raised when a count exceeds a provisioned level — the mechanism ITU-T G.7710 specifies for common equipment management, including near-end and far-end registers and the availability filters that suppress error counting during unavailable time (standard-specified).
Both functions answer questions about network resources. Neither answers the question a customer or a regulator asks: whether the service was delivered as sold. That determination requires three additions that conventional fault and performance management do not provide. First, a service model — an inventory record that maps each sold circuit or Ethernet Virtual Connection (EVC) to the ordered list of resources carrying it right now, including the resources it moved to after a protection switch. Second, metric semantics defined at the service boundary — availability per the SLA's own definition rather than per port, one-way delay between the customer's two hand-off points rather than between two line cards. Third, a verdict function — logic that aggregates a month of measurements into a compliance statement, a credit calculation, and a customer-facing report. Service assurance is the layer that supplies all three, consuming fault and performance management as inputs rather than replacing them.
The economics justify the extra layer. Downtime for enterprise services is widely priced around 5,600 US dollars per minute (a frequently cited Gartner estimate for average enterprise network downtime cost), and the field-practice numbers behind repair change slowly: signal-degradation faults typically resolve in 2–4 hours, hard failures such as fiber cuts in 4–8 hours, and intermittent environmental faults in 24–48 hours (typical field resolution windows). An assurance layer cannot shorten a splice crew's drive time, but it changes two other terms in the cost equation: it detects degradation-class failures — the slow drifts over days or weeks that never raise an alarm but end in an outage — early enough to schedule the fix, and it demarcates responsibility across operator boundaries fast enough that a compliant operator's team never spends the first four hours demonstrating that its own segment meets the objective. Practitioners who have worked through the alarm side of this problem will recognize the escalation trees catalogued in the OTN alarm troubleshooting reference; assurance is what turns those per-alarm procedures into a per-service outcome.
| Discipline | Primary question | Time base | Typical trigger | Primary output |
|---|---|---|---|---|
| Fault management | Whether the resource is broken | Milliseconds to seconds | Defect (LOS, LOF, AIS, BDI) | Alarm with severity and probable cause |
| Performance management | How well the resource is performing | Seconds to 15-minute / 24-hour bins | Threshold Crossing Alert (TCA) on a counter | performance-monitoring (PM) history registers, TCA notifications |
| Service assurance | Whether the customer received what the contract specifies | Minutes to the SLA reporting period | Service-impact correlation, SLA budget consumption | Compliance verdict, credit calculation, prioritized action |
A backhoe severs a duct carrying 80 wavelengths. Fault management reports it as roughly 2,000 correlated alarms — LOS at the line ports, AIS and BDI cascading upward, client-side failures at every tributary — which an alarm-correlation engine compresses to one root cause in seconds. Performance management reports it as Unavailable Seconds (UAS) accumulating in the 15-minute registers of every affected trail. Service assurance reports it as: 61 of the 80 wavelengths protection-switched inside their objective and burned zero availability budget; 19 unprotected services accumulated 4 hours 40 minutes of downtime each; three of those 19 have monthly SLA budgets of 26.3 minutes (99.995% class) and are now in credit territory, so the trouble-ticket priority order changes tonight. Same event, three levels of interpretation — and only the third quantifies the financial exposure. (Illustrative scenario with typical values.)
Takeaway: Fault management finds broken resources and performance management scores working ones; service assurance joins both against a service inventory and an SLA definition to produce a per-customer verdict. It is an additional layer with its own data model, not a rebranding of the NMS alarm list.
3. The Service Assurance Model
Strip every vendor product away and a working assurance system reduces to five functions arranged in a loop, exchanging two classes of data, joined by one key. The five functions: instrument (generate measurements at every layer and segment boundary), mediate (collect, timestamp, normalize, and store them), correlate (map resource-level events to the services carried on those resources), verify (evaluate each service's measurements against its SLA definition and burn its error budget), and act (report, credit, ticket, or trigger an automated repair). Objectives and thresholds flow down this stack; evidence flows up. Figure 1 shows the arrangement.
Read the Full Analysis with Premium
The remaining 87% of this article — the design numbers, trade-offs and field guidance — is part of MapYourTech Premium, along with the full premium library, courses and professional tools.
You May Also Like
-
Free
-
August 31, 2026
-
Free
-
August 27, 2026