
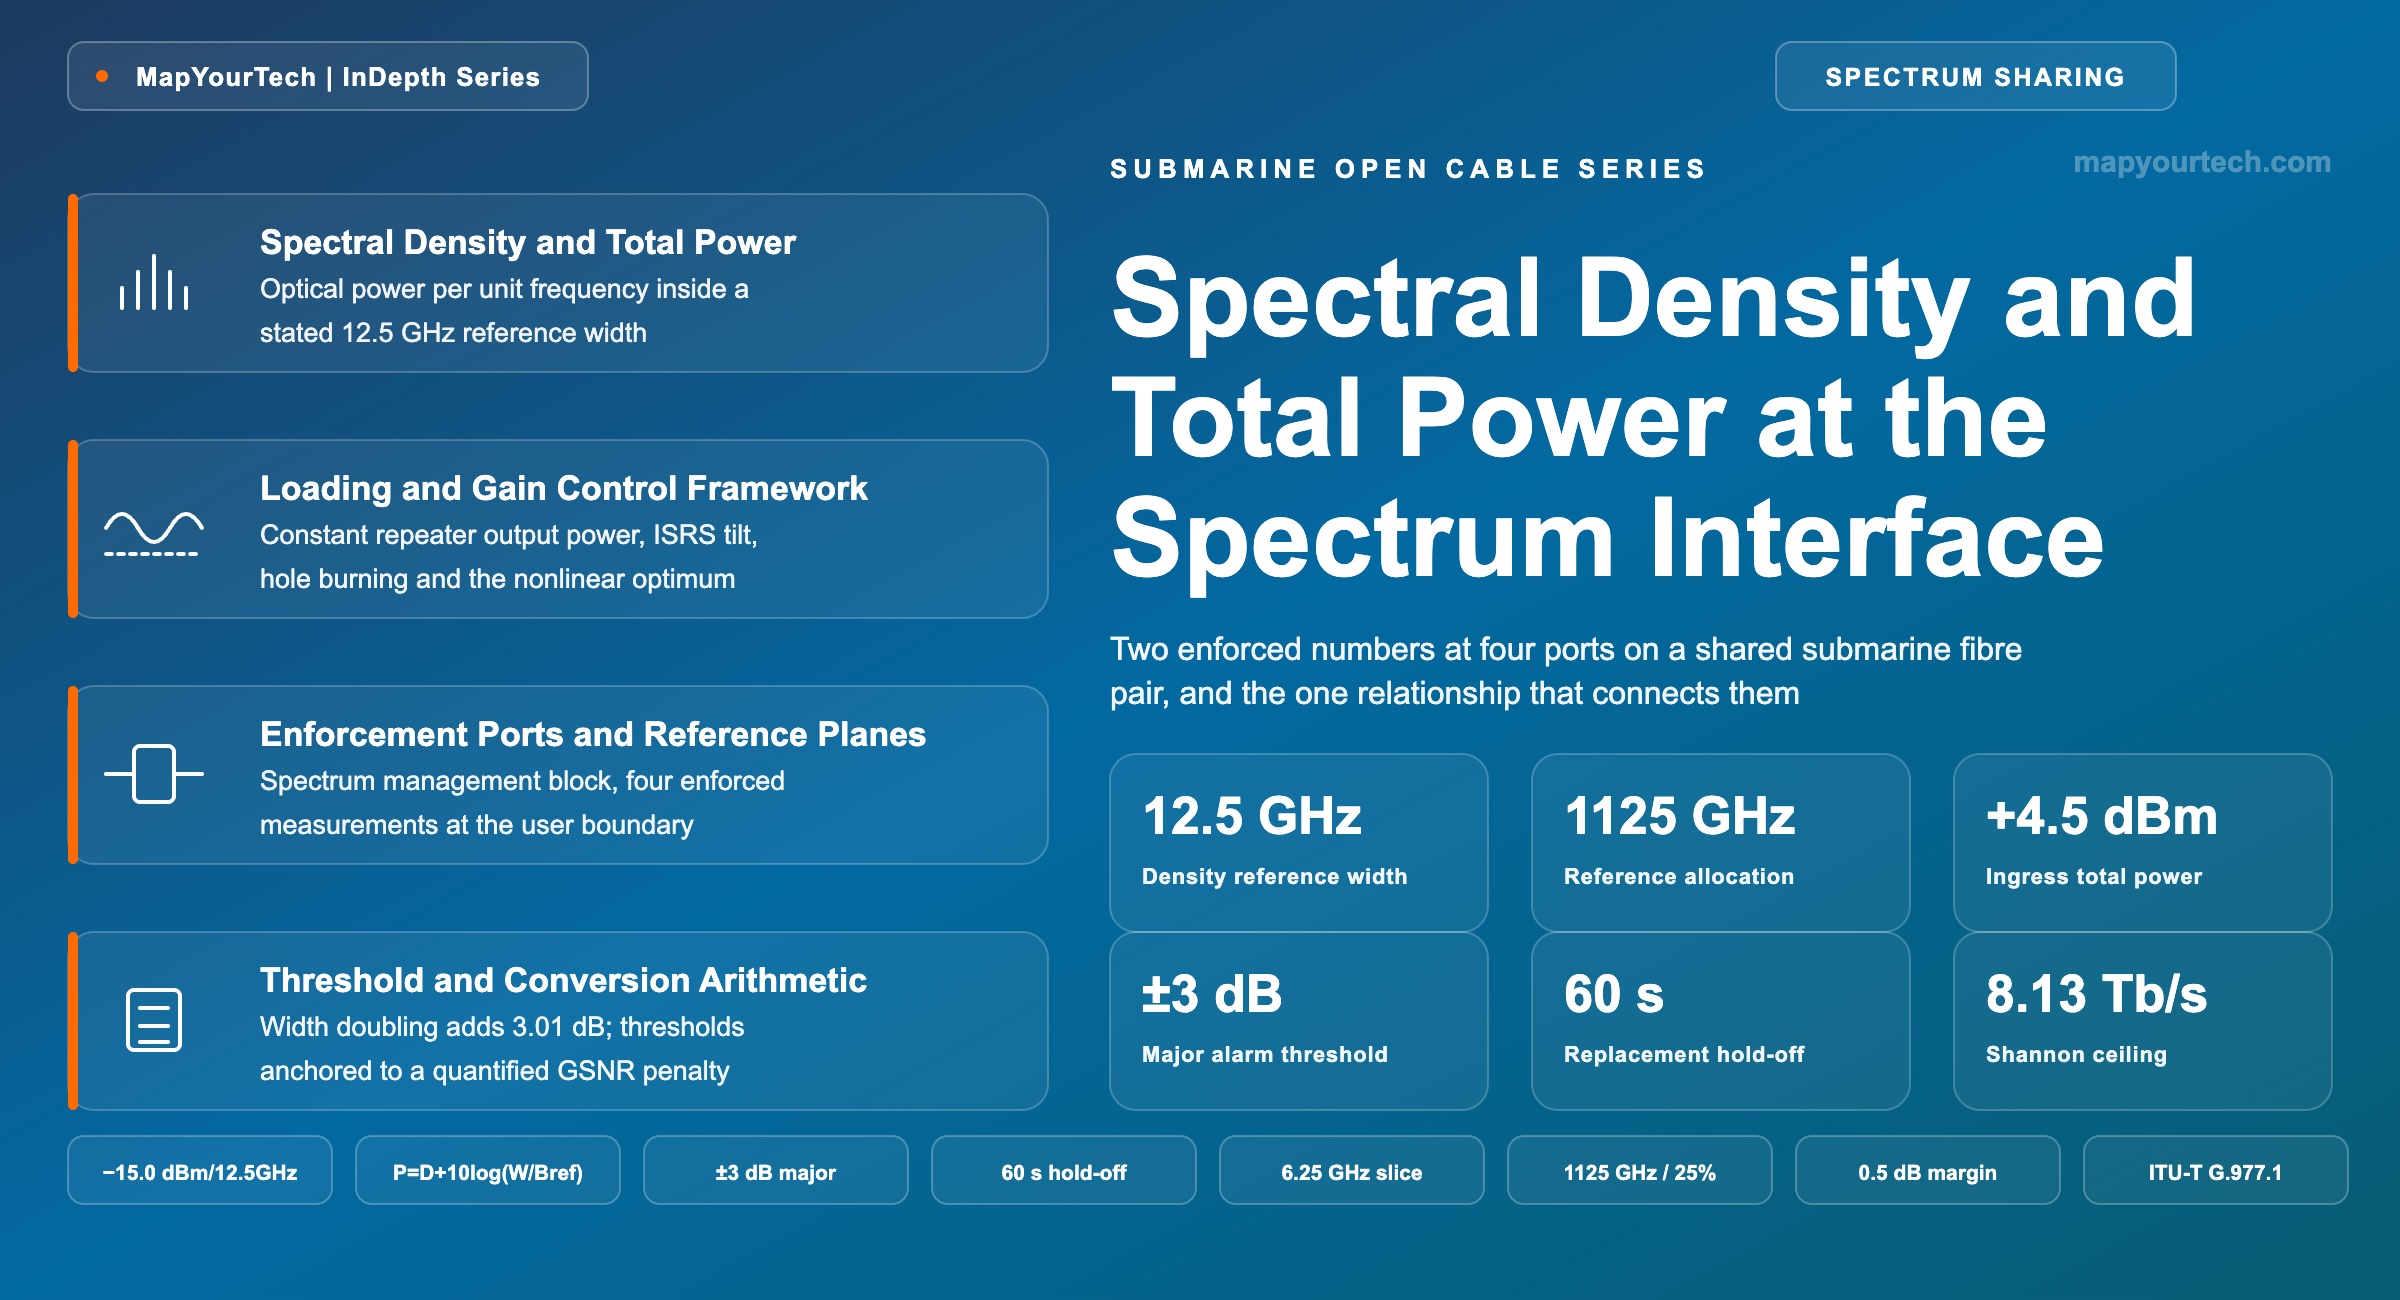
Spectral Density and Total Power at the Spectrum Interface
Two numbers at the spectrum management block ports carry the whole spectrum sharing agreement: a power spectral density target and the total power that allocation width multiplies it into.
Reference bandwidth is not a formality; it is half the number.
What You Will Learn
- Define power spectral density and total power from the anatomy of Figure 1, including the 12.5 GHz and 6.25 GHz reference widths.
- Convert a −15.0 dBm/12.5 GHz density target into the +4.5 dBm total power target of an 1125 GHz allocation.
- Quantify why an allocation loaded across half its width at unchanged total power sits 3.01 dB above its density target.
- Anchor the ±2 dB minor and ±3 dB major thresholds to the GSNR penalties of Table 5.
- Compute the 0.38 dB penalty every surviving user incurs when a 25% allocation is lost without ASE replacement.
- Place the enforced ports against the MPI and IPI reference points of ITU-T G.977.1 using Figure 2.
- Select a dead-band arrangement using the density excess of Table 9, which reaches 1.25 dB at a 100 GHz allocation.
- Build the twenty-parameter contract set of Table 12, from allocation width through reinstatement hold-off.
1. Introduction
A submarine spectrum sharing agreement reduces, at the physical layer, to two numbers measured at four ports. The spectrum user delivers a defined optical power, spread at a defined density, into the provider's spectrum management block at each end of the cable; the provider returns a defined optical power at a defined density out of the same block in the opposite direction. Everything else in the contract — the allocation width, the start and stop frequencies, the beginning-of-life generalized signal-to-noise ratio, the ageing and repair margin, the dead-band arrangement — either sets those numbers or describes what the user receives in exchange for holding them. The total power and the allocated spectral range at the designated input and output ports are the enforced terms, and the total input power is not an independent quantity: it follows from the allocation width multiplied by the target spectral density.
That derived relationship is the reason the pair exists. Power spectral density is the quantity the physics cares about. A chain of a hundred or more erbium-doped fibre amplifiers, each running at a fixed total output power, was designed around a particular distribution of power against frequency, and departures from that distribution propagate into gain tilt, spectral hole burning and nonlinear interference that reach every other user on the fibre pair. Density, however, is expensive to observe: resolving power against frequency at 6.25 GHz granularity needs an optical channel monitor or an optical spectrum analyser, and a full spectral scan takes seconds. Total power is cheap to observe: a tap coupler and a photodiode read it continuously, and a handheld power meter confirms it during a site visit. Scaling the density target by the allocation width produces a single scalar that a fast, inexpensive detector can police, and that is what the contract writes down as the total power target.
The arithmetic is one line and the consequences take an article. A density of −15.0 dBm/12.5 GHz across an 1125 GHz allocation gives a total input power target of +4.5 dBm (computed). Double the allocation and the target rises by exactly 3.01 dB. Halve it and the target falls by the same amount. The target moves with width because density is held constant, which is precisely the property that lets a provider write one density figure into every user's contract on a fibre pair and let each user's own width determine their power. Users with different allocation sizes then present different total powers at their ports while presenting the same spectral shape to the wet plant, and the combined spectrum arriving at the optical coupling interface is flat by construction rather than by negotiation.
Where the pair earns its keep is in the failure modes each term misses. Total power alone cannot distinguish a compliant allocation from one carrying the same power concentrated into half its width, because the integral is identical; the concentrated case sits 3.01 dB above the density target across the loaded half and leaves the other half dark. Density alone cannot be sampled fast enough to catch a transient, and it is blind to a slow common-mode offset if the monitor and the transmitter share a calibration error. Enforcing both closes the gap in both directions, and the two thresholds that follow — typically ±2 dB for a warning and ±3 dB for the action that replaces a user's spectrum with amplified spontaneous emission — are not arbitrary. They map onto specific generalized signal-to-noise ratio penalties, both for the deviating user and for every other user on the pair, and this reference derives that mapping.
The scope here is the interface contract itself: what the two terms mean, how they convert into each other, what physical mechanism makes each one binding, how the thresholds and hold-off timers around them are chosen, and what a complete parameter set looks like when it reaches a commissioning engineer. The treatment assumes a modern uncompensated positive-dispersion cable of the class ITU-T G.977.1 addresses for transversally compatible DWDM applications, with constant-total-output-power repeaters and a wavelength selective switch based spectrum management block at each landing. Dispersion-compensated legacy cables carry the same two terms with tighter tolerances and additional frequency planning constraints, and they appear in the limitations section rather than the main derivation. Terrestrial open line systems share the vocabulary but not the control philosophy, a distinction the terrestrial demarcation treatment referenced in section 10 sets out in full.
One framing is worth stating before the derivation. A spectrum sharing contract is a mutual constraint, not a one-way obligation. The provider warrants a delivered generalized signal-to-noise ratio across a stated frequency range; that warranty is only enforceable if the user's launch condition is fixed, because delivered performance depends on what every user launches. The user accepts a launch condition; that acceptance is only reasonable if the provider's monitoring is accurate, its thresholds are documented, and its automatic actions are bounded in time. Total power and spectral density are where the two sides of that bargain meet, and every number in the sections that follow attaches to one side of it or the other.
Takeaway: Power spectral density is the physically binding quantity and total power is its cheap, fast observable. The contract carries both because each catches a class of violation the other cannot see, and the total power figure is always derivable from the density target and the allocation width rather than negotiated separately.
2. Power Spectral Density and Total Power Definitions
Power spectral density is optical power per unit optical frequency, quoted in this domain as decibel-milliwatts inside a stated reference width — dBm/12.5 GHz or dBm/6.25 GHz. Total power is that density integrated over an allocation. Density fixes what each hertz of spectrum carries; total power fixes what the whole allocation delivers to the line.
Both quantities are ratios of a physical measurement to a stated interval, and the interval is half of each definition. A density figure written without its reference width is not a density, in the same way that an optical signal-to-noise ratio written without its reference bandwidth is not an OSNR. Two vendors quoting −15 dBm and −18 dBm per slice may describe identical spectra if one references 12.5 GHz and the other 6.25 GHz, because halving the reference width halves the power counted inside it and subtracts 3.01 dB from the number. The reference width in a spectrum sharing contract is normally chosen to match the pixel granularity of the wavelength selective switch in the spectrum management block, which is 6.25 GHz in current devices, or the 12.5 GHz flexible-grid slot step of ITU-T G.694.1. Either is correct; only silence about which one is in use is an error.
Read the Full Analysis with Premium
The remaining 87% of this article — the design numbers, trade-offs and field guidance — is part of MapYourTech Premium, along with the full premium library, courses and professional tools.
You May Also Like
-
Free
-
August 22, 2026
-
Premium
-
August 22, 2026
-
Premium
-
August 22, 2026