Can Fiber Optics Cause Fires?
The Physics, Mathematics,
and Engineering Reality
A rigorous analysis of optical power density, thermal ignition mechanisms, and the role of Automatic Laser Shutdown in preventing fire hazards in EDFA-amplified fiber networks.
Article Inspiration
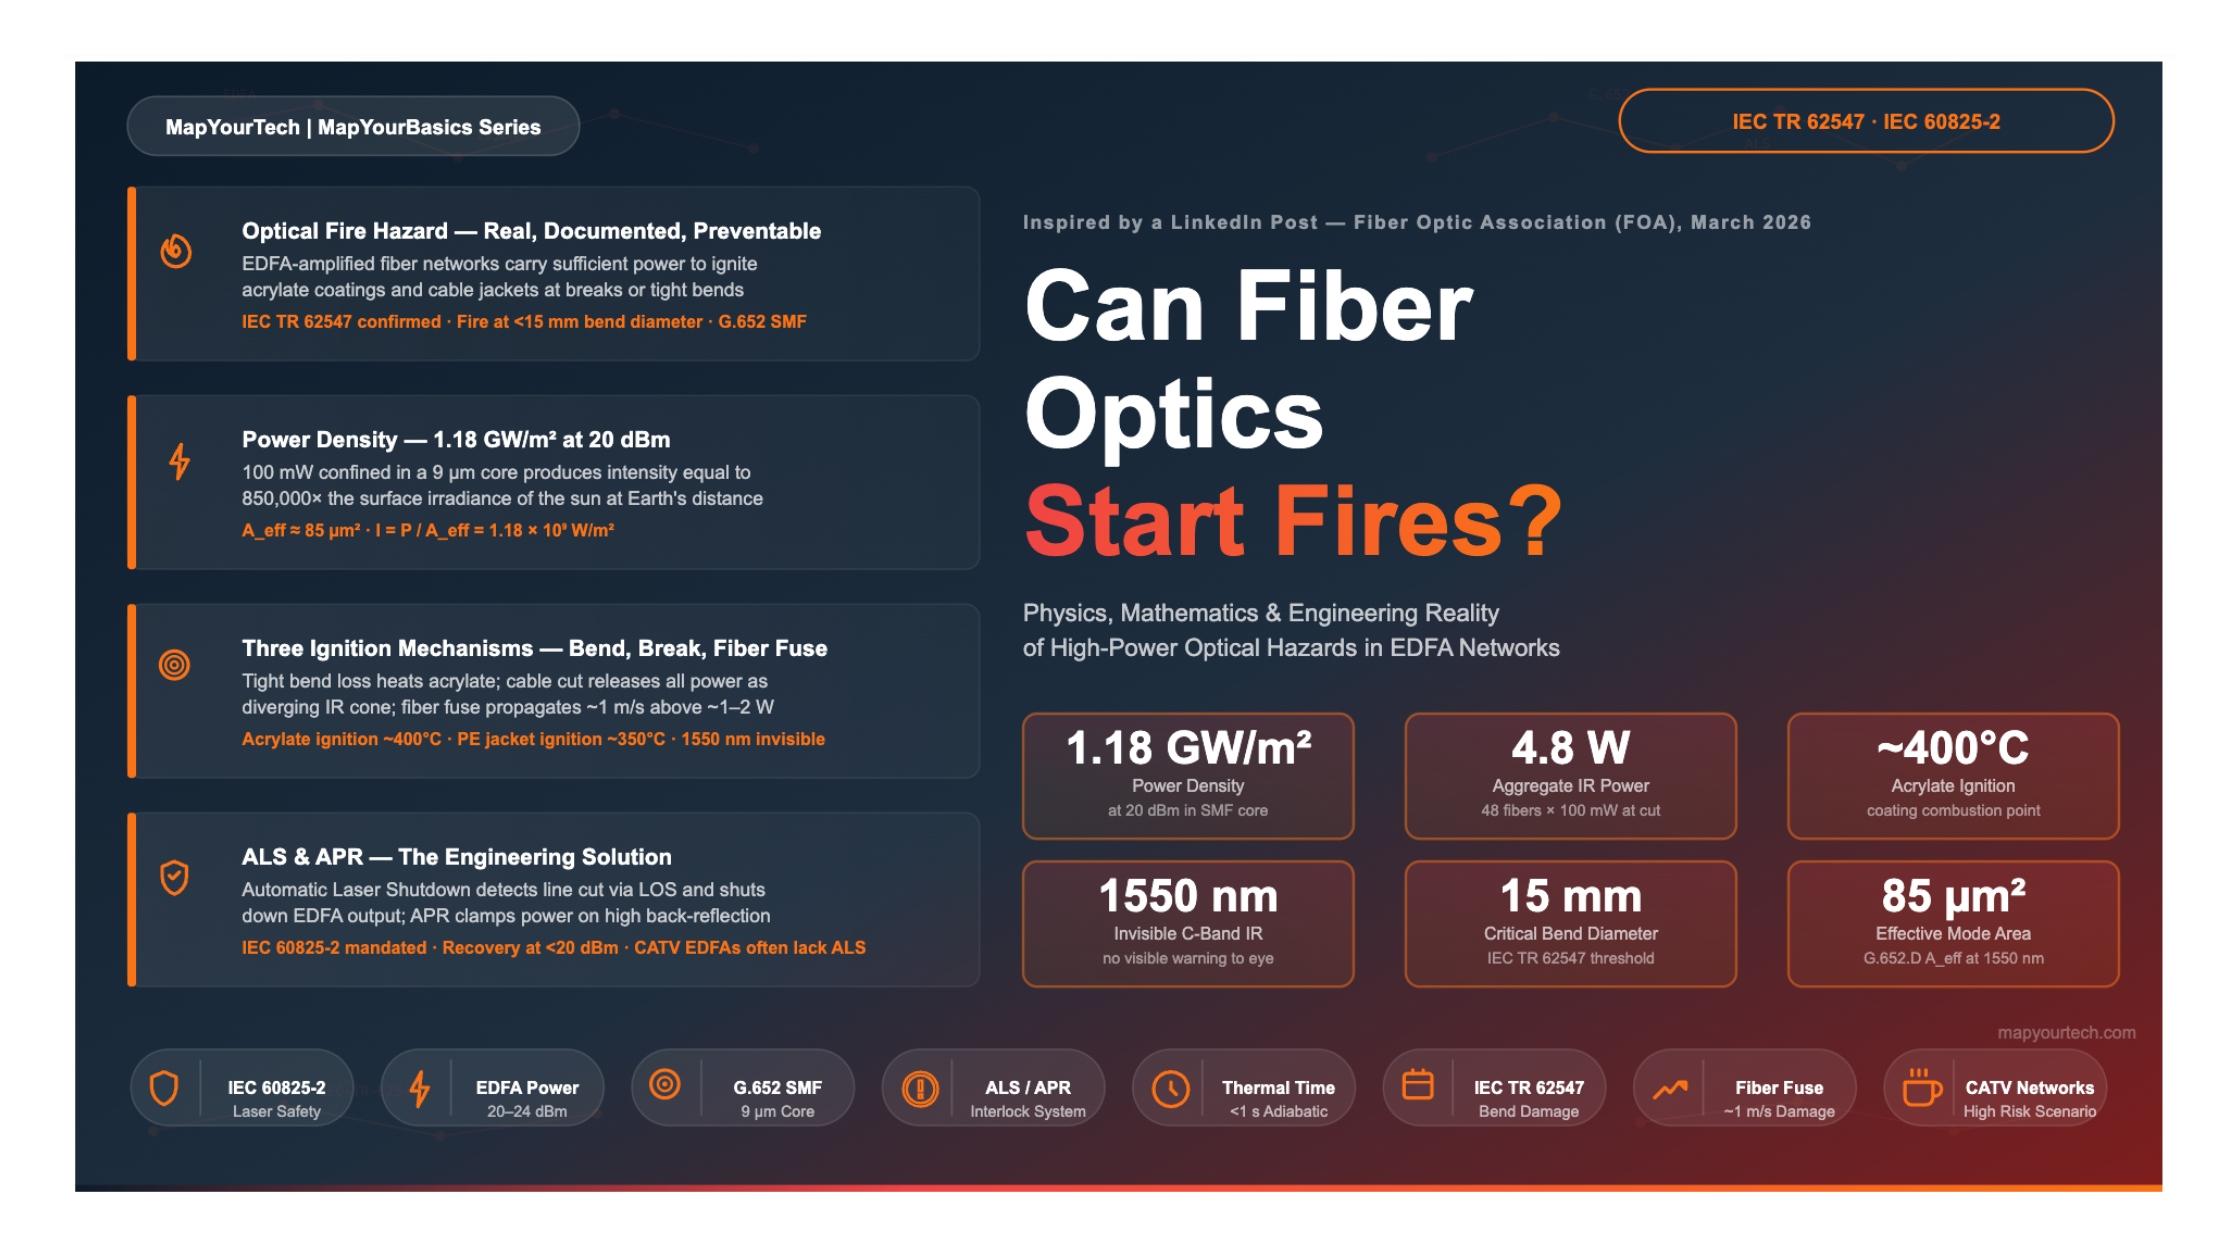
This article was inspired by the Fiber Optic Association (FOA) March 2026 Newsletter — Seen On The Street: Can Fiber Optics Cause Fires? — featuring a real fire incident reported from Serbia.
1. Introduction
A photograph from a cable management tray in Serbia prompted a question that reveals a gap between what fiber-optic engineers know theoretically and what field technicians often understand practically: can the optical power in an EDFA-amplified fiber network actually ignite a fire?
The short answer, supported by physics, experimental evidence, and international standards, is yes. This article examines every aspect of how, why, when, and where this can happen — from the fundamental optics of guided power in a single-mode fiber to the aggregate thermal loading of a multi-fiber cable break, and the engineering safety mechanisms that exist to prevent it.
The scenario is specific but instructive. A CATV operator running a 144-fiber cable with approximately one-third of those fibers carrying 20 dBm of EDFA-amplified optical power experienced a fire when the cable was cut at a service loop. Firefighters attended. The EDFA remained active throughout. Understanding why that fire started requires working through the physics from first principles.
2. EDFA Power Levels in Deployed Networks
2.1 Understanding 20 dBm — It Is Not a Small Number
Power in optical systems is expressed on a logarithmic scale in dBm — decibels relative to 1 milliwatt. The conversion from dBm to absolute power in watts is:
P[W]  =  10^( P[dBm] / 10 )  ×  10^(-3)  W

— At 20 dBm:
P  =  10^(20/10)  ×  10^(-3)
   =  10^(2)  ×  0.001
   =  100  ×  0.001
   =  0.100 W  (100 mW)

— At 22 dBm (typical DWDM booster EDFA output):
P  =  10^(2.2)  ×  0.001  =  158 mW

— At 24 dBm (high-power CATV EDFA):
P  =  10^(2.4)  ×  0.001  =  251 mW
P[dBm] = optical power expressed in decibels relative to 1 mW
P[W] = absolute optical power in watts
100 mW sounds modest in everyday terms — a low-power LED produces more visible light. The critical difference is confinement. In a standard single-mode fiber (G.652.D, per ITU-T), all of that optical power is confined to a core of approximately 8–10 µm in diameter with a mode field diameter (MFD) of approximately 10 µm. This changes everything.
2.2 Optical Intensity Inside the Fiber Core
The optical intensity — power per unit cross-sectional area — determines the severity of any interaction between the optical field and surrounding materials. For a Gaussian beam approximation in SMF, the effective beam area is:
Aeff  =  π  ×  ( MFD / 2 )^2

— For G.652.D fiber, MFD ≈ 10.4 µm at 1550 nm:
Aeff  =  π  ×  (5.2 × 10^(-6))^2
      =  π  ×  2.704 × 10^(-11)
      ≈  8.49 × 10^(-11) m²  (85 µm²)

— Optical intensity at 20 dBm (100 mW):
I  =  P / Aeff
   =  0.100 / (8.49 × 10^(-11))
   =  1.18 × 10^9  W/m²  (1.18 GW/m²)
MFD = Mode Field Diameter (m); ≈ 10.4 µm for G.652.D at 1550 nm
A_eff = Effective mode area (m²); ≈ 80–85 µm² for standard SMF
I = Optical intensity (W/m²)
1.18 GW/m² is comparable to the focal point of an industrial laser cutter. It exceeds the surface irradiance of the sun by approximately 850,000 times. This power density exists continuously inside every active single-mode fiber carrying 20 dBm — during normal operation, it is perfectly safe because the glass waveguide confines it. The moment that confinement is lost, the consequences are severe.
3. Fire Mechanisms — Three Distinct Pathways
There are three physically distinct mechanisms by which high optical power in an SMF can initiate or sustain combustion. They differ in the optical power threshold required, the physical trigger, and the rate of heat generation.
3.1 Mechanism 1: Tight Bend Loss and Coating Absorption
Total internal reflection (TIR) confines the guided mode inside the fiber core as long as the bend radius is above a critical threshold. When the fiber is bent tightly, the evanescent field of the guided mode couples into radiation modes and the light leaks out through the cladding and into the coating layer.
Bend-induced loss increases exponentially with decreasing bend radius. The macrobending loss coefficient for a standard SMF can be approximated as:
αbend  ∝  exp( -C₁ × R )  /  sqrt(R)

— where C₁ is a fiber-specific constant dependent on:
   •  Δn (core-cladding index difference)
   •  V-number (normalized frequency)
   •  Operating wavelength λ

— For G.652 SMF at 1550 nm, significant loss begins at:
   R ≤ 15 mm diameter (IEC TR 62547 threshold)
   R ≤ 8 mm diameter: loss typically >3 dB per turn

— Power escaping at a 10 mm diameter bend (3 dB/turn):
Pescaped  =  Pin  ×  (1 - 10^(-3/10))
          =  100 mW  ×  0.50
          =  50 mW  radiated into coating per turn
R = bend radius (m)
C₁ = fiber-specific bend sensitivity constant
α_bend = power loss per unit length (dB/m or dB/turn)
The acrylate coating absorbs this radiated light and converts it directly to heat. At near-infrared wavelengths (1550 nm), acrylate has a non-negligible absorption coefficient — the energy is deposited in a very small volume at the bend point, which acts as a localized heat source.
3.2 Mechanism 2: Complete Cable Break or Cut
A complete cut or crush of the fiber destroys the waveguide entirely. The optical beam diverges from the cleave face as a cone, with a half-angle determined by the numerical aperture of the fiber:
— Numerical Aperture of G.652.D SMF:
NA  =  sqrt( ncore^2  -  ncladding^2 )  ≈  0.12 to 0.14

— Far-field divergence half-angle:
θ  ≈  arcsin(NA)  ≈  7° to 8°

— All guided optical power (100 mW at 20 dBm) is
  released into this diverging cone at the break point
  and immediately strikes surrounding cable materials:
    • Buffer tube (loose or tight): PBT or nylon
    • Strength members: aramid (Kevlar) or GRP
    • Cable jacket: polyethylene or PVC

— Unlike the bend case, 100% of power is released — not ~50%
  P_released = P_in = 100 mW per fiber (complete break)
NA = Numerical Aperture of the fiber
n_core = Refractive index of core (≈ 1.468 for Ge-doped silica)
n_cladding = Refractive index of cladding (≈ 1.4628 for pure silica)
θ = Beam divergence half-angle
3.3 Mechanism 3: Fiber Fuse Propagation
The fiber fuse is a runaway thermal damage phenomenon that occurs above a threshold power in a single fiber — typically in the range of 1–2 W at a localized defect or contaminated connector. Once initiated, a plasma front propagates back toward the source along the fiber at velocities on the order of 1 m/s (experimentally confirmed range approximately 0.5–2 m/s depending on power level), converting the silica core to a chain of vapor-filled voids.
The fiber fuse threshold for standard G.652 SMF at 1550 nm is typically reported as approximately 1–2 W in a single fiber at a point of elevated absorption (dirty connector, coating defect, or mechanical damage). At 20 dBm (100 mW) per fiber, individual fibers in a CATV system are below this threshold. However, when optical power is concentrated at a single break point from multiple fibers simultaneously, or when power levels approach 1 W per fiber in premium booster configurations (up to 24 dBm = 251 mW), the risk profile changes significantly. Raman pump lasers, which operate at watts-level per fiber, represent a higher fiber fuse risk and are the reason IEC 60825-2 mandates interlocks specifically for these systems.
3.4 Mechanism 4: Contaminated or Damaged Connector
The optical connector interface is the fourth and often the most common ignition point in high-power fiber systems. When a connector end-face is contaminated — dust, oil from handling, or residue from a previous connection — the contamination absorbs optical power at the connector interface. This absorption heats the contamination, which can then carbonize, crack the ferrule, or initiate a fiber fuse that propagates back toward the source along the fiber.
The power-handling limit of a standard single-mode connector (SC, LC, FC type) is approximately 400 mW. This is well below the output power of Raman pump lasers, which routinely operate at 500 mW to over 1,000 mW per port in unrepeatered submarine and long-haul terrestrial systems. Even in CATV EDFA systems at 20 dBm (100 mW), a contaminated connector with high absorption can concentrate enough energy at the ferrule face to initiate damage.
Per Chesnoy and Antona (eds.), Undersea Fiber Communication Systems, 2025: the power-handling specification for standard optical connectors is approximately 400 mW, which is well below the power typically used for Raman amplification. The most common damage mechanism in fiber-optic connectors is absorption of optical power by surface contaminants. The risk of damage can be greatly reduced by using an expanded-beam connector, which enlarges the beam diameter and reduces power density at the connector interface. Some high-power expanded-beam connectors have a damage threshold of more than 3,000 mW and in some cases 5,000 mW. For the most demanding unrepeatered systems, it is often preferable to replace connectors near high-power equipment with fusion splices entirely, eliminating the connector interface as a failure point.
— Standard LC/SC connector: MFD ≈ 10.4 µm, A_eff ≈ 85 µm²
  At P = 400 mW (limit):
Imax  =  P / Aeff  =  0.400 / 85×10^-12  ≈  4.7 GW/m²

— Expanded-beam connector: beam diameter ≈ 40–100 µm
  At same P = 400 mW, beam area ~10–100× larger:
Iexpanded  =  P / Aexpanded  ≈  47–470 MW/m²  (10–100× lower)

— Contamination absorption is proportional to I
  Expanding the beam directly reduces thermal loading
  at the interface by the same factor

  Standard connector + Raman pump (1,000 mW) = 11.8 GW/m²
  → 10× above rated limit → severe damage risk
The contamination-to-fuse pathway is particularly insidious because it can occur during normal operation without any visible warning. A connector that passes inspection may become contaminated after handling, particularly if protective dust caps are not replaced immediately. For this reason, high-power optical networks require not only ALS and APR interlocks but also a rigorous connector inspection and cleaning protocol as a mandatory pre-connection step.
4. Thermal Analysis — Time to Ignition
The question of how quickly optical power can raise the coating temperature to ignition is answerable from heat transfer physics. The calculation below considers a single tight bend at 20 dBm, which is the minimum risk scenario.
— Volume of acrylate coating heated at a 1 mm bend section:
  Outer coating: Ø 250 µm → r_outer = 125 µm
  Cladding:      Ø 125 µm → r_inner =  62.5 µm

Vcoating  =  π × (router^2 - rinner^2) × L
          =  π × ((125×10^-6)^2 - (62.5×10^-6)^2) × 0.001
          =  π × (1.5625×10^-8 - 3.906×10^-9) × 0.001
          ≈  3.68 × 10^-11  m³

— Acrylate material properties:
  Density ρ    ≈  1,100 kg/m³
  Specific heat Cp ≈  1,500 J/(kg·K)
  Ignition temperature T_ign ≈ 400°C (piloted ignition threshold)
  Note: acrylate pyrolysis onset ≈ 200–250°C; decomposition is
  rapid above 300°C; 400°C used here for sustained ignition calc
  Ambient temperature T_amb ≈  25°C

m  =  ρ × V  =  1100 × 3.68×10^-11  =  4.05×10^-8  kg

Q  =  m × Cp × ΔT
   =  4.05×10^-8  ×  1500  ×  (400 - 25)
   =  4.05×10^-8  ×  562,500
   ≈  2.28 × 10^-2  J  (22.8 mJ)

— Time to reach ignition temperature (50 mW absorbed,
  ignoring conduction losses — upper-bound heat rate):
t  =  Q / Pabsorbed
   =  0.0228 / 0.050
   ≈  0.46 seconds  (adiabatic — actual time longer due to conduction)
V = heated acrylate volume over 1 mm length (m³)
m = mass of heated volume (kg)
Q = energy required to reach ignition temperature (J)
t = time to reach ignition under adiabatic assumption (s)
Note: Conductive and convective losses extend t significantly in practice. However, in a tightly coiled service loop or enclosed splice tray, thermal dissipation is limited and t remains on the order of seconds to minutes.
Under adiabatic assumptions, a single fiber at 20 dBm with 3 dB/turn bend loss can heat a 1 mm section of acrylate coating to ignition temperature in under 1 second. In practice, with realistic heat conduction, the timescale extends to seconds or minutes — but remains entirely plausible during a fault condition where the EDFA continues to operate without a shutdown interlock.
The important takeaway from this calculation is not the exact value of t — which depends heavily on thermal boundary conditions, coating absorption coefficient at 1550 nm, and the geometry of the bend. The important takeaway is the order of magnitude: this is a seconds-to-minutes timescale, not hours. A technician who does not know the fiber is live has no warning before combustion begins.
4.1 How Power Accumulates Into Damaging Energy — The Integral View
The thermal calculation above gives ignition time for a fixed absorbed power. But the deeper physical principle at work is more general and worth stating explicitly: energy is the integral of power over time. A small continuous power, given enough time without dissipation, will raise any finite mass to any temperature. This is why continuous-wave optical power — even at levels that seem modest — is a categorically different hazard from a brief pulse.
— Fundamental thermal energy balance:

E(t)  =  ∫₀t Pabsorbed(τ) dτ  -  ∫₀t Ploss(τ) dτ

Where:
  E(t)          = net thermal energy stored in the material (J)
  P_absorbed(τ) = optical power being absorbed at time τ (W)
  P_loss(τ)     = power lost via conduction + convection + radiation (W)

— For constant power and simplified adiabatic case (P_loss ≈ 0):

E  =  Pabsorbed  ×  t

— Temperature rise from this stored energy:

ΔT  =  E  /  (m × Cp)  =  (Pabsorbed × t) / (m × Cp)

— Time to reach critical temperature T_crit from ambient T_amb:

tcrit  =  (m × Cp × (Tcrit - Tamb)) / Pabsorbed
E(t) = net thermal energy stored at time t (J)
P_absorbed = optical power deposited in material (W)
P_loss = heat leaving via conduction, convection, radiation (W)
m = mass of heated volume (kg)
Cp = specific heat capacity (J/kg·K)
T_crit = critical temperature for pyrolysis or ignition (°C)
t_crit = time to reach T_crit under adiabatic assumption (s)
This relationship has three important consequences that are not immediately obvious from looking at a power value in dBm:
1. Smaller mass means faster heating. The coating volume at a single tight bend point is tiny — on the order of 10-11 m³. A small mass has small thermal capacity. Even 50 mW deposited into 40 nanograms of acrylate represents an enormous power density per unit mass. The rate of temperature rise is inversely proportional to mass: halving the mass doubles the rate.
2. Thermal dissipation determines whether energy accumulates or escapes. In open air with good airflow, P_loss can balance P_absorbed, and the temperature reaches a steady state below ignition. In an enclosed splice tray, a tight service loop coiled in a cabinet, or inside a cable duct where airflow is restricted, P_loss is substantially reduced. Energy accumulates rather than escaping. The integral grows. The question of whether a given power level is dangerous depends as much on the thermal environment as on the power itself.
3. Continuous-wave power never stops integrating. A pulsed laser delivers energy in bursts, giving material time to cool between pulses. An EDFA running at 20 dBm is continuous-wave: it deposits energy without interruption, 24 hours a day, as long as traffic is flowing. If an interlock fails to trip at a bend or break, the integral ∫ P dt simply keeps growing, second after second, until the critical temperature is reached. There is no self-limiting mechanism in the optical system — only the interlock provides one.
At the Serbia cable break, no single fiber produced enough instantaneous power to cause immediate ignition on its own. But 48 fibers each depositing 100 mW produced a combined 4.8 W — continuously. Over 60 seconds without an ALS trip, this accumulates to 288 J deposited into the cable materials at the break face. Over 5 minutes: 1,440 J. Over 10 minutes: 2,880 J. Polyethylene cable jacket requires far less energy to ignite when heated locally to its critical temperature. The fire was not caused by a single instant of extreme power — it was caused by modest power integrating over time in an enclosed cable environment without an automatic shutdown.
— Scenario: 48 fibers × 100 mW, no ALS interlock
  P_absorbed = 4.8 W (conservative: assumes all power reaches jacket)

— Energy deposited over time:
t =  10 s   →  E  =  4.8 × 10   =   48 J
t =  30 s   →  E  =  4.8 × 30   =  144 J
t =  60 s   →  E  =  4.8 × 60   =  288 J
t = 300 s   →  E  =  4.8 × 300  = 1,440 J

— Comparison: ignition energy for common cable materials
  (piloted ignition, per unit mass, at representative heat flux)
  PE jacket at local break point: well below 144 J for small mass
  Acrylate coating (Eq. 5): 22.8 mJ for 1 mm section
  Aramid strength members: higher — but 1,440 J far exceeds this

  With ALS: P_absorbed → 0 within seconds. E remains near zero.
  Without ALS: E grows linearly and without bound until ignition.
This is the mathematical reason why the interlock is not merely a safety recommendation — it is the only mechanism that terminates the integral. Remove it, and physics does the rest.
5. The Multi-Fiber Cable Break — Aggregate Power Analysis
The scenario described by Vladimir Grozdanovic involves not one fiber but a cable containing 144 fibers, of which approximately one-third carry 20 dBm. This transforms the analysis from a single-fiber thermal problem to an aggregate energy deposition problem.
— Number of active fibers:
Nactive  =  144 × (1/3)  =  48 fibers

— Per-fiber power at 20 dBm:
Pfiber  =  100 mW = 0.100 W

— Total aggregate optical power at the break point:
Ptotal  =  Nactive  ×  Pfiber
        =  48  ×  0.100
        =  4.8 W  of continuous-wave infrared radiation

— For comparison (all at 1550 nm, invisible to human eye):
  Typical electric hot plate (domestic): 1000–2000 W
  Soldering iron tip: approximately 40–60 W
  Cigarette lighter flame: approximately 50–100 W
  4.8 W concentrated at cable break cross-section: FIRE RISK

— Energy deposited in cable jacket (PE) over 60 seconds:
E  =  Ptotal × t  =  4.8 × 60  =  288 J
  (polyethylene ignition energy requirement: << 288 J)
To place 4.8 W in practical context: polyethylene cable jacket begins to melt at approximately 120–130°C and reaches ignition temperature at approximately 350°C. A heat flux of 4.8 W concentrated into the cross-section of a 144-fiber cable break — perhaps 15 mm × 30 mm in area — produces a heat flux density of approximately 10,700 W/m². This exceeds the critical heat flux for ignition of most polymers (typically 15–25 kW/m² depending on geometry and ventilation), and while not sufficient for spontaneous ignition in isolation, it is entirely sufficient to sustain combustion once a flame is initiated by the initial coating ignition, particularly in a service loop with limited ventilation.
6. The Invisible Hazard — Why 1550 nm Is Uniquely Dangerous
The wavelength of CATV and telecommunications optical signals — 1550 nm in the C-band — falls squarely in the near-infrared region of the electromagnetic spectrum. The human eye responds to wavelengths between approximately 380 nm and 700 nm. At 1550 nm, there is no retinal response whatsoever. A technician looking directly at the cut end of a live 20 dBm fiber would see nothing at all — no glow, no spot, no indication of optical power.
| Wavelength (nm) | Band / Region | Eye Visibility | Skin Sensation | Primary Hazard |
|---|---|---|---|---|
| 850 nm | Near-IR (MMF systems) | Faint red glow at high power | Slight warmth | Retinal burn (focused) |
| 1310 nm | O-band (SMF) | Completely invisible | No sensation | Retinal burn (pre-retinal absorption reduces risk vs. visible) |
| 1480 nm | Raman pump / S-band | Completely invisible | No sensation | Retinal burn; coating heating at high power |
| 1550 nm | C-band (EDFA/DWDM) | Completely invisible | No sensation below ~1 W | Coating ignition; fire at cable break; eye burn |
| 1625 nm | L-band / maintenance | Completely invisible | No sensation | Same as C-band; fire risk at high power |
| 980 / 1480 nm | EDFA pump wavelengths | Invisible | No sensation | Very high power (pump lasers); highest fire risk |
This invisibility means that all conventional human warning systems fail. A worker handling a cut cable end in a service enclosure has no way to know whether the fiber is carrying 0 W or 4.8 W by looking at it, feeling it, or smelling it — until combustion has already begun and visible smoke or flame appears. By that time, the cable jacket may be burning, the splice tray may be igniting, and in a confined space such as a cable duct or equipment room, the conditions for a sustained fire are already established.
6.1 Eye Hazard vs Fire Hazard — Two Separate Risk Thresholds
It is important to distinguish between two separate hazard categories, because they have different power thresholds and different consequences:
Eye hazard occurs when infrared radiation enters the eye directly or is focused onto the retina. At 1550 nm, the cornea and lens absorb most of the radiation before it reaches the retina, making 1550 nm less acutely dangerous to the eye than 1310 nm or visible wavelengths — but chronic or high-power exposure can still cause corneal damage. Eye hazard from 1550 nm fiber systems is primarily relevant when looking directly into a live fiber end face, a practice that is categorically prohibited in any optical network environment. The threshold for eye injury at 1550 nm is in the range of a few milliwatts at direct exposure — far below the fire ignition thresholds.
Fire hazard is the subject of this article. It requires significantly more power than an eye injury — tens to hundreds of milliwatts absorbed by polymer materials over seconds to minutes. The fire hazard is a material science and thermal engineering problem, not a direct biological hazard. However, unlike an eye injury (which requires a direct line of sight to the fiber end), fire can occur inside an enclosed cable tray, cabinet, or duct where no human is present and no one sees the event developing.
A technician looking into a live 20 dBm fiber would require training violations and a sequence of errors. A CATV cable carrying 48 live fibers at 20 dBm, cut by excavation equipment or an accidental cable crimp, releases 4.8 W of infrared radiation with no human in the loop at all. The fire risk operates without line of sight, without an observer, and without the possibility of immediate human response. This is why automatic interlocks — not safety training alone — are the only effective control measure for the fire hazard.
7. When and Where — Risk Conditions and Circumstances
7.1 High-Risk Physical Configurations
The fire risk is not uniform across all fiber-optic installations. It is strongly associated with specific physical configurations that either concentrate optical power at a point of coating exposure or create conditions where heat is trapped near the heated material.
| Configuration | Risk Mechanism | Where It Occurs | Risk Level |
|---|---|---|---|
| Tight bend in splice tray | Bend loss → coating heating | Splice closures, patch panels | High (confined, poor cooling) |
| Service loop coil, small radius | Cumulative bend loss over multiple turns | Cabinet service loops, ducts | High (multiple turns compound loss) |
| Cable cut or crush | Complete loss of guiding → all power released | Construction damage, excavation | Very High (aggregate power) |
| Damaged or cracked fiber (partial) | Partial power release at damage point | Anywhere mechanical stress occurs | Moderate to High |
| Contaminated connector (dirty ferrule) | Absorption at contamination site; fiber fuse initiation | Patch panels, ODF cross-connects | Moderate (isolated, but fiber fuse possible) |
| Kink in cable (installation fault) | Severe bend loss at kink point | Duct entry points, cable tray bends | High (may not be detected by OTDR) |
7.2 Network and System Risk Factors
The physical configuration alone does not determine risk. The system-level context — power level, amplifier type, interlock implementation, and network architecture — determines whether a physical fault event leads to a fire.
| Risk Factor | Lower Risk | Higher Risk |
|---|---|---|
| Per-fiber optical power | <10 dBm (10 mW) | >17 dBm (50 mW) and above |
| Amplifier type | Raman (interlocks mandated by IEC); modern coherent EDFA with ALS | Low-cost CATV EDFA without verified ALS |
| ALS/APR interlock | Verified, tested, within IEC 60825-2 response time | Absent, untested, or slow to respond |
| Number of active fibers per cable | Low (single or few fibers active) | Many fibers simultaneously active (CATV distribution) |
| Installation quality | Bend radii verified by OTDR; no kinks | Unverified bends; service loops coiled tightly |
| Monitoring | Active OTDR or OSC monitoring; rapid fault detection | Passive distribution with no active monitoring |
| Cable material | Low-smoke zero-halogen (LSZH) jacket | Standard PE or PVC (more flammable, more toxic smoke) |
7.3 Raman Amplifier Systems — The Higher Power Tier
CATV and terrestrial EDFA boosters operating at 20–24 dBm (100–251 mW per fiber) represent the most common scenario for optical fire risk in deployed networks. However, Raman amplification systems operate at a categorically higher power tier that places them well above all fire and fiber fuse thresholds.
Raman pump lasers in unrepeatered submarine and long-haul terrestrial systems typically inject 500 mW to over 1,000 mW per fiber at pump wavelengths of approximately 1,420–1,480 nm (for C-band amplification). At these power levels, the risk profile is substantially more severe:
A single Raman pump at 1,000 mW (30 dBm) directed into a contaminated connector exceeds the standard connector power-handling limit of approximately 400 mW by more than 2.5 times. The fiber fuse threshold of approximately 1–2 W is within reach for a single fiber at high Raman pump levels. Any tight bend in a fiber carrying a 1 W Raman pump deposits far more heat than the CATV scenario — the energy accumulation calculation (section 4.1) applies directly, with P_absorbed ten times higher.
For this reason, IEC 60825-2 places specific interlock requirements on Raman amplification systems, and the common engineering practice in high-power unrepeatered installations is to replace connectors near the pump equipment with fusion splices entirely, eliminating the connector interface as a potential damage point. Some installations use expanded-beam connectors with damage thresholds above 3,000–5,000 mW for the few connection points that must remain accessible.
CATV EDFA booster: 20–22 dBm per fiber (100–158 mW) — fire risk at multi-fiber breaks, bend damage at tight coils, no immediate fiber fuse risk per fiber. Coherent telecom booster: 22–24 dBm per fiber (158–251 mW) — approaching fiber fuse range, elevated connector risk, ALS mandatory. Raman pump: 27–30+ dBm per fiber (500–1,000+ mW) — exceeds connector rated limits, within fiber fuse threshold range, expanded-beam connectors or splice-only terminations required near pump equipment.
8. Automatic Laser Shutdown (ALS) and Automatic Power Reduction (APR)
The engineering response to the optical fire hazard is the Automatic Laser Shutdown (ALS) system, mandated by IEC 60825-2 for Class 1M optical systems. ALS detects a line fiber break — typically via loss of the Optical Supervisory Channel (OSC) or loss of the amplifier's input signal — and immediately shuts down the high-power laser output.
8.0 What Is an Interlock — and Why Does It Matter?
The word interlock in optical networking refers to an automatic protective circuit that monitors a specific operating condition and takes a predefined action the moment that condition is violated — without waiting for human intervention. In the context of high-power fiber systems, an interlock is the only mechanism standing between a fiber break and a fire, because the timescale of thermal ignition (seconds to minutes) is far shorter than any realistic human response time.
The concept comes from industrial safety engineering, where interlocks have been used for decades in machines, chemical plants, and electrical systems to prevent runaway conditions. A simple example: a microwave oven has a door interlock — the moment the door opens, the magnetron stops. The oven does not wait for you to press Stop. The action is automatic, immediate, and non-negotiable.
In a fiber-optic amplifier, the equivalent is the optical interlock: when the fiber is cut or disconnected, the laser stops. Automatically. Within milliseconds to seconds. Before enough energy accumulates to ignite anything.
There are two primary interlock types used in high-power optical systems, each targeting a different fault scenario:
Trigger condition:
  Loss of Signal (LOS) detected at amplifier input
  — fiber has been cut, crushed, or completely disconnected
  — Optical Supervisory Channel (OSC) disappears

Action:
  EDFA output laser → OFF immediately
  Output power drops to 0 W within response time (~milliseconds)

Recovery:
  System automatically retries at eye-safe power (<20 dBm)
  every few minutes to check if fault has been repaired
  Full power only restored when signal continuity confirmed

Why it prevents fire:
  No optical power → no energy deposition → no heating
  The 4.8 W that would otherwise reach the break point = 0 W
Trigger condition:
  High back-reflection detected at EDFA output port
  — connector is dirty, cracked, or partially disconnected
  — fiber not fully broken but partial reflection is large
  — Threshold: back-reflection > -18 dB AND P_out > 20.5 dBm

Action:
  EDFA output clamped to eye-safe level (20.5 dBm)
  Gain control overridden — power cannot exceed this limit

Recovery:
  APR disengages automatically when back-reflection
  drops below threshold or power naturally falls below limit

Why it prevents fire:
  A dirty or partially-seated connector that cannot guide
  light properly generates localised heating — APR limits
  the energy available to sustain that heating
IEC 60825-2 mandates ALS for Class 1M systems — but compliance is not universal. Low-cost CATV EDFAs are often deployed without a verified, tested ALS circuit. Some units include a basic LOS alarm — a software flag or LED indicator — that notifies an operator but does not automatically shut down the laser. An alarm that requires a human to act is not an interlock. It is a notification. By the time that notification reaches a person and they act, the coating may already be burning. The fire in Serbia described in the FOA newsletter is the real-world consequence of this distinction.
An Analogy That Makes It Concrete
Think of the ALS as the circuit breaker in your home electrical panel. When a short circuit occurs, the breaker trips — automatically, in milliseconds — before the wiring overheats and starts a fire. You do not have to be home. You do not have to see it happen. The breaker does not send you a text message asking permission. It acts.
An EDFA without ALS is like a home wired with no circuit breakers — fuses that someone has bypassed. Everything works fine under normal conditions. The moment there is a fault, there is nothing between that fault and a fire except luck and the speed of whoever happens to be nearby.
An EDFA without APR is like a car without airbags. It handles normal operation fine but has no protection the moment something fails at a connector interface under high power.
Neither ALS nor APR is optional in a system carrying hundreds of milliwatts of invisible infrared radiation into a polymer cable. They are the difference between a fault that causes a service outage and a fault that calls the fire brigade.
8.1 ALS Operating Principle
In a bidirectional high-power link, each end of the span includes a booster EDFA. When the fiber is cut:
The near-end booster EDFA detects loss of its own return monitoring path (or the OSC from the far end disappears). The ALS control circuit triggers an immediate shutdown of the booster laser output. The far-end equipment detects loss of signal on its receive input. The far-end ALS also shuts down its booster output into the broken fiber. Both ends of the broken span are now dark. The system then periodically attempts automatic recovery at eye-safe power levels — the project reference document for the Apollo ROADM system specifies recovery attempts at less than 20 dBm every few minutes.
The ROADMI_20TF booster implements both ALS and Automatic Power Reduction (APR). ALS activates on loss of signal at the line input, shutting down the booster output completely. APR activates when back-reflection exceeds a threshold of -18 dB relative to output power AND the EDFA output exceeds 20.5 dBm — in this case, output power is clamped to 20.5 dBm regardless of set gain. This two-layer protection addresses both fiber cut scenarios (ALS) and connector disconnection or dirty connector scenarios (APR). Recovery attempts are made at eye-safe power levels (<20 dBm) per the system specification.
8.2 APR — Automatic Power Reduction
Automatic Power Reduction (APR) is a complementary safety mechanism that addresses scenarios where a fiber is not cut but partially disconnected — such as a dirty or loosely seated connector. In this case, a large back-reflection is generated at the imperfect interface. APR monitors the back-reflected power at the EDFA output port. If the back-reflection exceeds a threshold (typically -18 dB relative to output power in the Apollo system specification) and the EDFA output exceeds 20.5 dBm, the output power is clamped to the eye-safe level of 20.5 dBm. APR and ALS operate independently and in parallel.
9. Applicable Standards and Regulatory Framework
| Standard / Document | Scope | Relevance to Fire Hazard |
|---|---|---|
| IEC TR 62547 | Guidelines for measurement of high-power damage sensitivity of SMF to bends | Directly documents experimental evidence of coating ignition at tight bends with standard G.652 fiber. Establishes 15 mm diameter as the critical threshold. Recommends bend-insensitive fibers in central offices. |
| IEC 60825-2 | Safety of laser products — Part 2: Safety of optical fibre communication systems | Mandates ALS or equivalent interlock for Class 1M systems. Requires method to detect line fiber cut or disconnected fiber jumper. Key compliance requirement for high-power EDFA systems. |
| ITU-T G.664 | Optical Safety Procedures and Requirements for Optical Transport Systems | Specifies safety procedures for installation, maintenance, and operation of high-power optical transport systems. Requires ALS or equivalent for systems where optical power could pose a hazard. Directly referenced by unrepeatered and high-power amplified system designs. |
| ITU-T laser safety recommendations | Laser safety in telecommunications | Classifies sources emitting more than 500 mW in the 1400–1600 nm band as Class 4 radiation hazards. Underpins the safety architecture for high-power amplified systems. |
| ITU-T G.652 (D) | Characteristics of a single-mode optical fibre and cable | Defines the standard fiber (MFD, A_eff, attenuation) that determines bend loss characteristics and power density calculations in this analysis. |
| ITU-T G.650.2 | Definitions and test methods for non-linear attributes of SMF | Defines effective area (A_eff) measurement relevant to power density calculations. |
10. Engineering Best Practices — Prevention and Mitigation
10.1 Installation
Bend radii must be verified during installation and recorded. OTDR testing of every fiber after installation should check for anomalous reflections or loss spikes that may indicate kinks or tight bends. Service loops must be coiled to the manufacturer's minimum bend radius, which for standard G.652 SMF is typically 30 mm for long-term installation. IEC TR 62547 identified that damage can occur at diameters below 15 mm for standard SMF — a service loop coiled to a cable tie at 10–12 mm diameter is a potential ignition point under high power.
For high-power applications (above approximately 17 dBm per fiber), bend-insensitive fiber (G.657) is recommended for any installation points where tight bends cannot be guaranteed to be avoided. G.657.A2 fiber maintains acceptable bend loss performance at radii down to 7.5 mm, substantially reducing the risk of coating heating at accidental tight bends.
10.2 Amplifier Selection and Qualification
Not all EDFAs implement ALS. This is particularly true of lower-cost CATV amplifiers where cost optimization may lead to the omission of interlock circuitry, or where interlock response time is not specified or tested. Any procurement of EDFA equipment for networks where optical power exceeds 17 dBm per fiber should require the following to be documented in the vendor's technical specification and verified during acceptance testing:
| Requirement | Specification Target | How to Verify |
|---|---|---|
| IEC 60825-2 compliance | Documented declaration of conformity for Class 1M | Request compliance documentation from vendor |
| ALS response time | Laser output power <1 mW within 2 seconds of LOS detection | Simulate line cut during FAT; measure with power meter |
| APR back-reflection threshold | Power clamped to ≤20.5 dBm when back-reflection >−18 dB | Inject calibrated back-reflection during factory test |
| ALS auto-recovery | Recovery attempt at <20 dBm, every few minutes, auto-restores on fiber restoration | Verify recovery sequence after simulated cut-and-restore |
| Alarm vs interlock distinction | Laser must shut down automatically — LOS alarm alone is not sufficient | Confirm output goes to zero on LOS, not just raises alarm flag |
10.3 Operational Safety
Before performing any work on fiber cables that may be carrying amplified optical signals, the amplifier must be confirmed shut down and locked out. The zero-power state must be verified with an optical power meter — visual inspection is not sufficient and is, for 1550 nm signals, completely useless. All connectors and fiber end-faces in high-power systems should be inspected with a fiber inspection scope before connection to confirm cleanliness. A contaminated ferrule in a high-power path can initiate coating heating at the connector, potentially triggering a fiber fuse.
10.4 Pre-Connection Connector Safety Protocol
In any system where per-fiber optical power exceeds approximately 17 dBm, the following protocol should be followed before connecting any fiber:
BEFORE CONNECTING:
  1. Confirm EDFA/Raman pump is shut down or locked out
     → Verify with optical power meter (not visual inspection)
     → Confirm meter reads 0 mW or below meter noise floor

  2. Inspect both connector end-faces with fiber inspection scope
     → Use IEC 61300-3-35 pass/fail criteria
     → No dust, oil, scratches, or chips on core area

  3. Clean if required
     → Dry clean first (lint-free reel or stick cleaner)
     → Wet clean if dry cleaning does not pass inspection
     → Re-inspect after cleaning — do not skip this step

  4. Check bend radius of any service loops
     → Minimum 30 mm for standard G.652 SMF
     → Minimum 15 mm for G.657.A2 bend-insensitive fiber
     → Verify no accidental tight bends or cable ties over fiber

FOR RAMAN PUMP SYSTEMS (P_fiber > 400 mW):
  5. Standard connectors are not rated for this power level
     → Use expanded-beam connectors (rated 3,000–5,000 mW) OR
     → Terminate near pump equipment with fusion splices only
     → Never connect a standard LC/SC/FC directly to a Raman pump output

AFTER CONNECTING:
  6. Restore power only after connection is confirmed secure
  7. Check for ALS alarm clearance — confirms signal continuity
  8. Monitor EDFA output power for first 30 seconds
     → Any unexpected APR trip indicates back-reflection issue
     → Disconnect and re-inspect connector if APR activates
10.5 Does This Apply to My Network? — Quick Reference
The fire hazard is not uniform across all fiber-optic deployments. The table below maps network type, typical power level, and risk tier to the safeguards required — a rapid assessment tool for engineers evaluating whether a current or planned deployment requires action.
| Network / System Type | Typical Per-Fiber Power | Fire Risk Tier | Required Safeguards |
|---|---|---|---|
| Passive optical network (PON) — no amplification | +3 to +7 dBm (2–5 mW) | Low | Standard practices; no interlock required |
| Enterprise / campus LAN, short links | 0 to +10 dBm (1–10 mW) | Low | Standard practices; observe bend radius |
| Metro DWDM without booster amplifier | +3 to +13 dBm (2–20 mW) | Low–Moderate | Bend radius compliance; connector cleanliness |
| CATV / HFC distribution with EDFA booster | +17 to +22 dBm (50–158 mW) | Moderate–High | ALS required; IEC 60825-2 compliance; G.657 at tight-bend areas; connector inspection protocol |
| Long-haul DWDM with inline / booster EDFAs | +17 to +24 dBm (50–251 mW) | High | ALS + APR mandatory; G.664 compliance; bend enforcement; FAT verification of interlock response |
| Unrepeatered systems with Raman amplification | +27 to +33 dBm (500–2,000 mW) | Very High | ALS + APR mandatory; Class 4 / 1M compliance; expanded-beam or splice-only near pump; restricted access during live operation |
| Any system — fiber break during excavation | Whatever is live at break | High–Very High if EDFA/Raman present | ALS must be implemented and verified; no reliance on human response speed |
- 20 dBm in a standard G.652 SMF produces an optical intensity of approximately 1.18 GW/m² — comparable to an industrial laser cutter, confined within a 9 µm core.
- At a tight bend below 15 mm diameter, light escapes the core and is absorbed by the acrylate coating, which can reach pyrolysis temperature (~200°C) within seconds and piloted ignition temperature (~300–400°C) within minutes under continuous optical power without ALS shutdown.
- At a complete cable break, 48 active fibers at 20 dBm release 4.8 W of continuous-wave 1550 nm infrared radiation — entirely invisible — sufficient to ignite polyethylene jacket and aramid strength members given time without ALS shutdown.
- Energy is the integral of power over time. Even modest power accumulates into damaging energy when thermal dissipation is restricted by enclosed cable environments. The interlock is the only mechanism that terminates this integral.
- Four ignition mechanisms exist: tight bend, cable break, fiber fuse, and contaminated connector. All four are addressed by the same defense: ALS, APR, connector cleanliness, and bend radius compliance.
- The hazard scales with power tier. CATV boosters at 20 dBm are manageable with proper interlocks; Raman pumps at 30 dBm exceed standard connector power ratings and require expanded-beam or splice-only terminations.
- Low-cost CATV EDFAs may not implement verified interlocks. Procurement specifications must require IEC 60825-2 compliance with documented ALS response time and FAT verification.
11. Conclusion
The question this article opened with — can fiber optics start fires — has a clear answer supported by physics, experimental standards, and at least one documented real-world incident. Yes, under specific conditions that are predictable, calculable, and preventable.
The fundamental cause is not exotic. Optical power, like any form of energy, obeys conservation laws. When a guided wave is disrupted — by a bend, a break, a fiber fuse front, or a contaminated connector — the energy that was traveling invisibly inside a glass waveguide must go somewhere. At power levels above approximately 17 dBm per fiber, that energy is sufficient to heat polymer materials to pyrolysis and, given time without an automatic shutdown, to sustained ignition. The physics is deterministic. The outcome is preventable.
The engineering response is equally clear. ALS and APR interlocks, when properly implemented, verified during acceptance testing, and maintained across the equipment's service life, reduce the fire risk to near zero. They do this not by monitoring continuously but by responding to a single trigger — loss of signal — with an action that requires no human involvement and completes within seconds. The comparison to a circuit breaker is exact: no one expects a homeowner to manually disconnect a short circuit before fire starts, and no one should expect a network operator to manually shut down an EDFA after a cable break before the jacket ignites.
The gap between engineering intention and field reality is where the risk lives. A standard that mandates ALS does not enforce it at every installation. An EDFA that includes a basic LOS alarm but no automatic laser shutdown is not compliant with IEC 60825-2. A service loop coiled tighter than the minimum bend radius because it was convenient during installation is a potential ignition point. A connector end-face not inspected before connection to a high-power output port is a potential fiber fuse initiator. None of these are theoretical concerns — the Serbia incident, documented by the FOA in March 2026, is the consequence of this gap at the field level.
The practical conclusion for engineers designing, procuring, installing, or operating amplified fiber networks is direct: treat optical power at EDFA output levels with the same discipline given to high-voltage electrical systems. Verify the safety mechanisms are real, tested, and functional — not just specified on a datasheet. Enforce bend radius compliance in every installation. Require connector inspection as a mandatory step before any high-power connection. And whenever power levels exceed 17 dBm per fiber, confirm that ALS is implemented, calibrated, and verified — not assumed.
References
Developed by MapYourTech Team
For educational purposes in Optical Networking Communications Technologies
Note: This article is based on published standards (IEC TR 62547, IEC 60825-2, ITU-T G.652), experimental findings reported in the referenced IEC technical report, and engineering principles verifiable by calculation. Power density figures, ignition temperature values, and thermal calculations are derived from first principles with conservative assumptions. Specific ignition thresholds in real deployments vary with cable geometry, material formulation, ventilation, and installation quality.
Feedback Welcome: If you have corrections or improvements, write to us at [email protected]
Related Articles on MapYourTech