
Hollow-Core, Single-Mode and Multi-Core Fiber Comparison
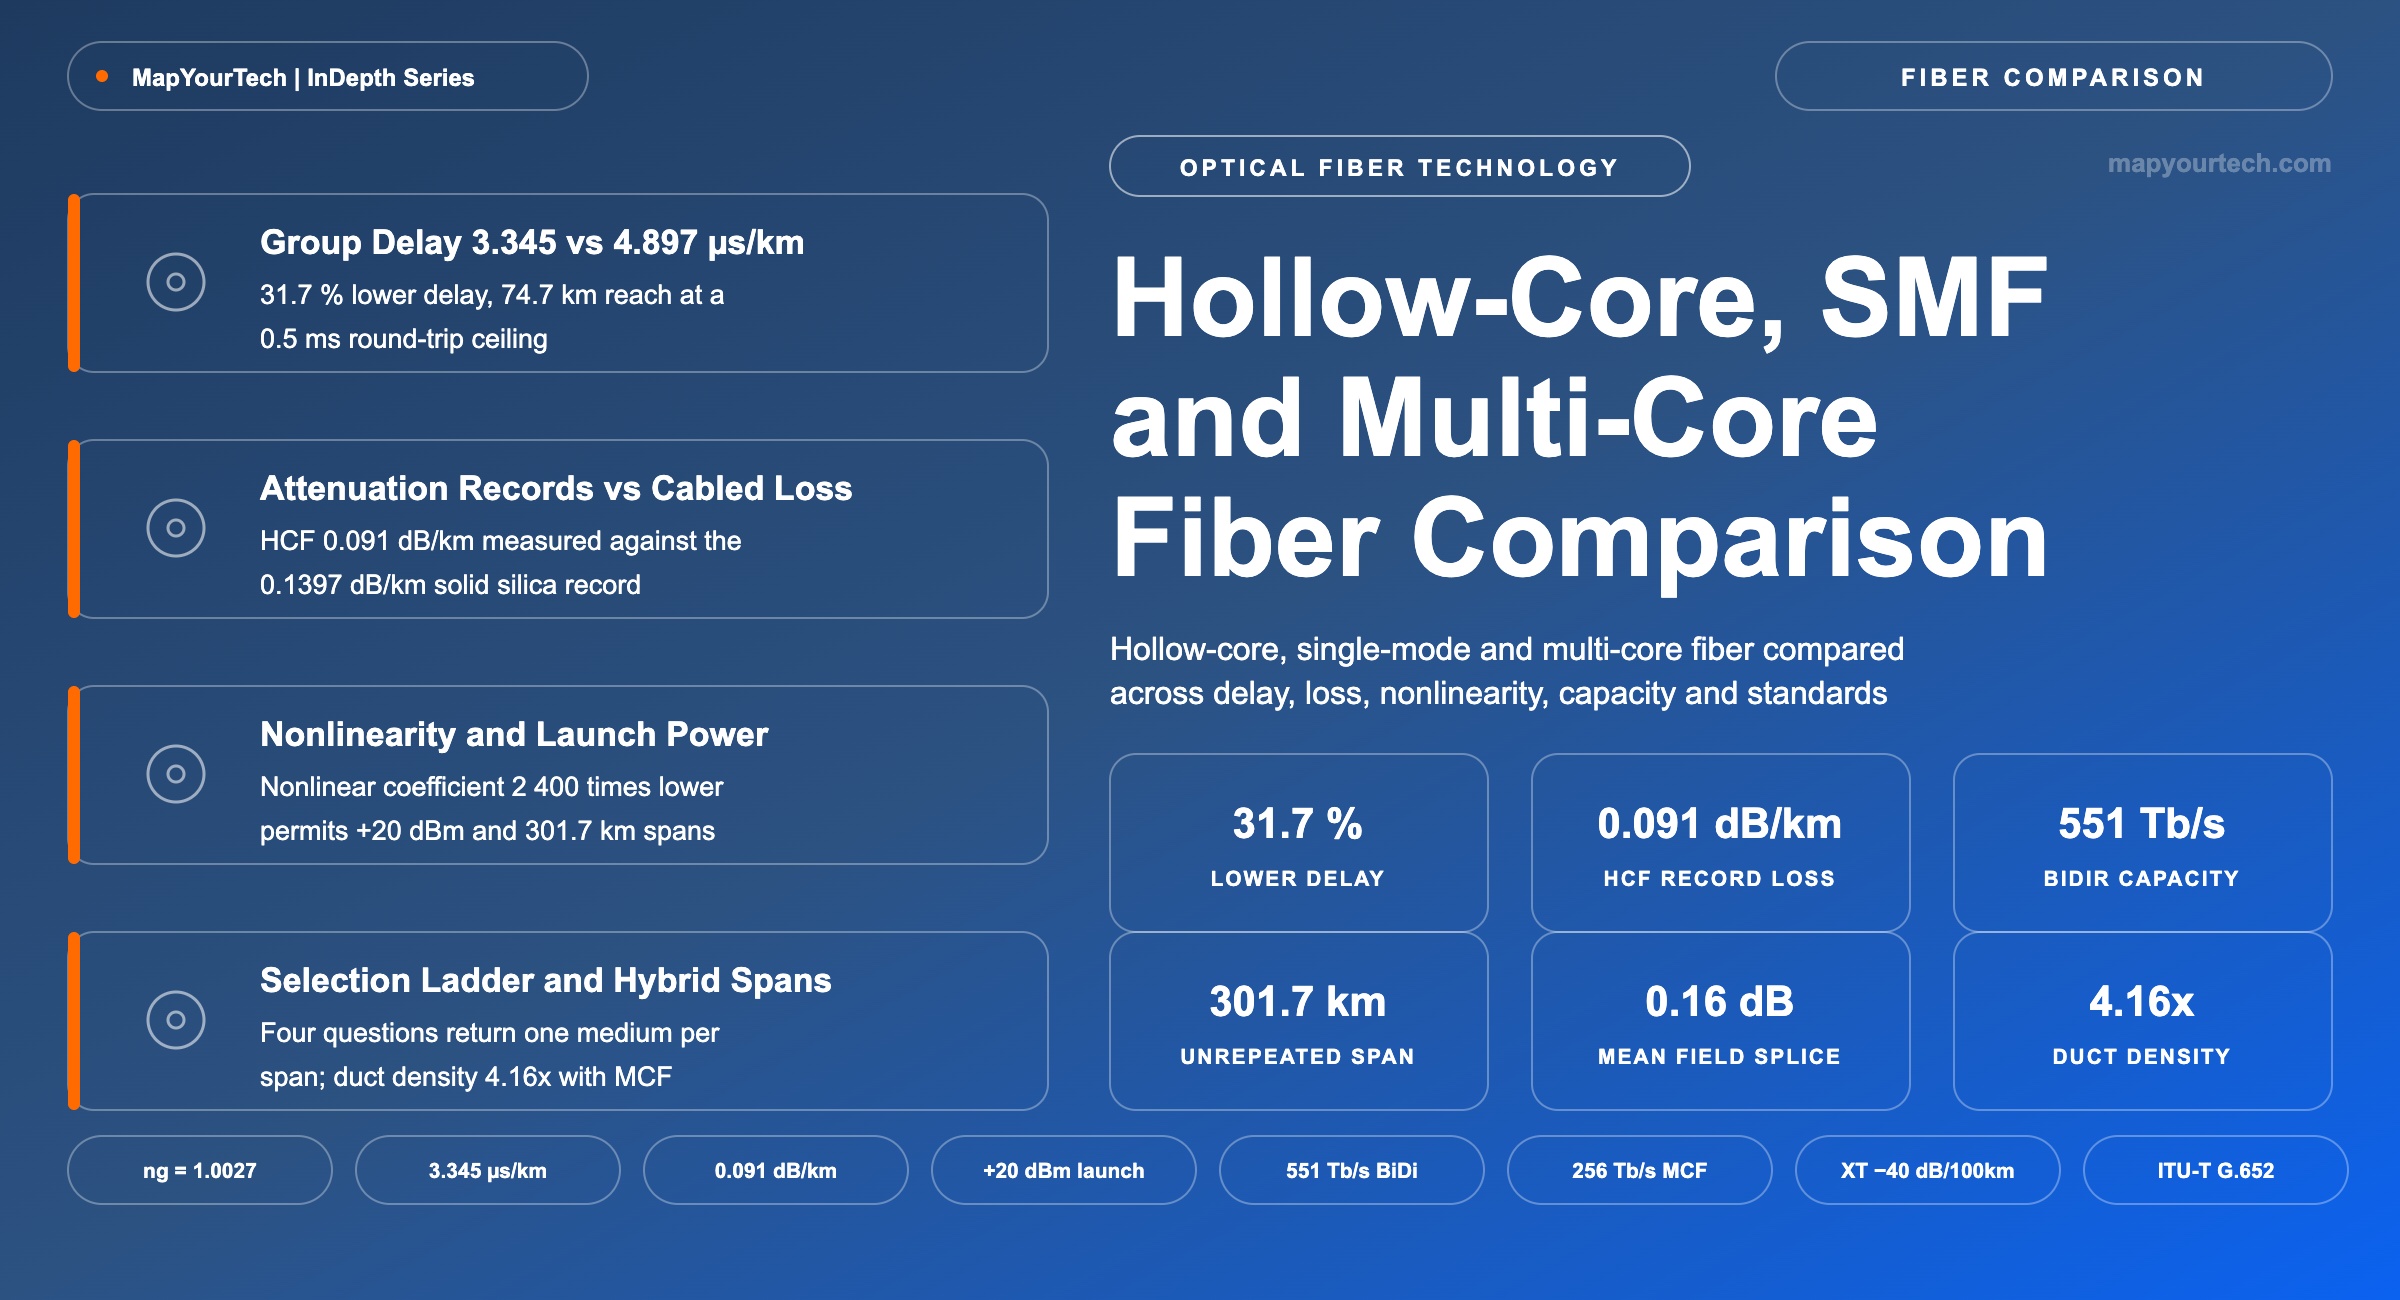
Three transmission media, eleven design axes, and the constraint each one actually relieves — loss, delay, dispersion, nonlinearity, capacity, geometry, splicing, amplification, monitoring, standards and cost.
Every optimum is the boundary between two different failures.
What You Will Learn
- Define effective group index and modal power overlap, and convert either one into propagation delay using the 3.3356 × ng µs/km relation of Section 2 and Figure 1.
- Separate the three attenuation floors that bound each medium: 0.1397 dB/km measured in silica, 0.091 dB/km measured in hollow core, and 0.18–0.22 dB/km typical per core in multi-core fiber (Section 4, Table 2).
- Quantify the launch-power headroom that a nonlinear coefficient near 5 × 10⁻⁴ W−1km−1 buys, and place the 37 dBm booster of the 301.7 km unrepeated span against the +3 dBm practical ceiling of standard fiber (Section 6).
- Build a span budget for each medium from attenuation, splice count, interface loss and amplifier noise figure, using the worked 200.5 km case of Section 6.4.
- Anchor spatial density to the cladding: capacity per 125 µm of glass, per duct and per cable, using the four-core and seven-core arithmetic of Section 8 and Table 6.
- Select a monitoring method against a backscatter coefficient 30–40 dB below silica, and read the 27 dB air-molecule and 15 dB surface-roughness split of Section 11 and Figure 13.
- Place each medium against its live standards position: ITU-T G.652 and G.654 in force, G Suppl. 87 framing weakly coupled multi-core fiber, and hollow-core specification work still in progress (Section 12).
- Read the nine-table parameter matrix of Section 14 across guidance, latency, attenuation, dispersion, nonlinearity, capacity, interfaces, operations and standards, with an evidence class on every row.
- Apply the four-question selection ladder of Section 14 — delay budget, power budget, duct budget and interface budget — to a route and return one medium per span.
1. Introduction
An anti-resonant hollow-core fiber measured at 0.091 dB/km at 1550 nm sits below the 0.1397 dB/km record held by solid silica, and both numbers are measured attenuations on drawn fiber rather than projections (measured, Nature Photonics 2025 for the hollow-core value; measured, OFC 2024 Tu2E.1 for the silica value). That single comparison is the reason a three-way media question exists at all in 2026. For four decades the selection problem was internal to one family: G.652 or G.654, larger effective area or smaller, and the answer changed the link budget by tenths of a decibel. The question now spans three physically different waveguides, and the differences between them are measured in factors rather than percentages.
Air guidance removes the glass from the optical path. The guided mode of a double-nested anti-resonant nodeless fiber overlaps the silica membranes by less than a part in a thousand, so the Kerr nonlinear coefficient falls by roughly three orders of magnitude, the group index falls to about 1.0027, and the Rayleigh scattering floor that bounds solid silica no longer applies. Standard single-mode fiber gives up all three of those advantages and returns something no laboratory result can match: several billion kilometres already in the ground, an installed base of transceivers, splicers, optical time-domain reflectometers, connectors and acceptance procedures, and a complete set of published ITU-T fiber parameter specifications that make a span buildable by two vendors who have never spoken. Uncoupled multi-core fiber answers a third constraint entirely: it multiplies the number of spatial channels inside one 125 µm cladding, which matters when the binding limit is duct cross-section rather than decibels or microseconds.
The three media are therefore not ranked. Each relieves a different binding constraint, and a route whose limit is propagation delay reaches a different answer from a route whose limit is conduit occupancy, even when both routes run between the same two buildings. A high-frequency trading link between a matching engine and a colocation cage is bounded by microseconds; a metro span between two availability zones is bounded by the distance at which the round-trip budget still permits synchronous replication; a submarine cable is bounded by the electrical power that can be fed down the copper conductor; and a hyperscale campus interconnect is frequently bounded by the number of strands that fit through an existing 7/3.5 mm microduct. Four constraints, three media, and no universal ordering between them.
Scope and Method
This article compares anti-resonant hollow-core fiber, ITU-T G.652.D standard single-mode fiber and weakly coupled uncoupled multi-core fiber across eleven axes: effective group index, attenuation, propagation delay, chromatic and polarization dispersion, nonlinearity and launch power, capacity per fiber and per cladding, cable geometry and spatial density, splicing and interface loss, amplification and line-system architecture, monitoring and fault location, standards position, and installed cost. Coupled-core multi-core fiber and few-mode fiber appear only where the contrast clarifies an uncoupled result, because both require full multiple-input multiple-output digital signal processing at the receiver and belong to a different system class. Photonic bandgap hollow-core fiber appears in the historical section and then drops out, since anti-resonant designs carry every current telecom result.
Every figure in the article carries its evidence class in the same sentence: standard-specified, measured, vendor claim or theoretical limit. That discipline matters more here than in most comparisons, because the hollow-core literature quotes laboratory attenuations on short spooled samples alongside cabled field losses that are several times higher, and reading the two as one number produces span budgets that will not close. Where a laboratory value and a field value diverge, both appear.
Attenuation is quoted in dB/km at 1550 nm unless another wavelength is named. Chromatic dispersion is in ps/(nm·km), symbol rate in GBd, and data rate in the b/s family. Effective group index is written ng and is dimensionless. Inter-core crosstalk in multi-core fiber is quoted per 100 km, which is the convention the fiber datasheets use; a per-kilometre figure differs by 20 dB.
Takeaway: air guidance, silica guidance and spatial multiplication solve three different problems. Selection follows the binding constraint on the route — delay budget, power budget or duct budget — rather than a ranking of the media themselves.
2. Effective Group Index and Modal Power Overlap
Effective group index is the dimensionless factor by which a guided optical pulse travels slower than light in vacuum, written ng and defined as the ratio of the vacuum speed of light to the group velocity of the mode. It fixes propagation delay directly, it is a property of the guided mode rather than of the core material alone, and it is measured on drawn fiber rather than calculated from a glass composition.
2.1 Distinctions From the Adjacent Quantities
Four quantities are routinely used as if they were one, and each substitution changes an answer.
Refractive index against effective index. The refractive index n of bulk silica near 1550 nm is about 1.444, and the effective index neff of the fundamental mode of a G.652.D fiber is about 1.447, because the mode samples core and cladding together weighted by its own transverse field. Neither of those is the number that belongs in a latency budget: the group index of the same mode is 1.4682, and substituting either index value for it understates delay by 1.4 to 1.7 %.
Effective index against group index. The effective index sets the phase velocity; the group index sets the velocity of the envelope, and therefore the delay of data. They differ by the material and waveguide dispersion terms, and only the group index belongs in a latency budget.
Group index against fraction of power in glass. In a hollow-core fiber the two are related but not interchangeable. A mode with less than 0.1 % of its power in the silica membranes carries a group index near 1.0027, which is what produces the delay advantage; the same overlap figure also sets the Kerr nonlinearity and the thermal coefficient of delay, which the group index alone does not describe. The overlap fraction η is the quantity that explains why one fiber wins on three separate axes at once.
Core diameter against mode field diameter. In hollow-core fiber the mode field diameter runs at roughly 70 % of the core diameter, so a 25 µm core presents an 18 µm mode field. That mismatch against the 10.4 µm mode field of standard fiber at 1550 nm is the whole of the interface problem treated in Section 9, and quoting the core diameter in its place understates the coupling loss.
2.2 Units and Conversion Arithmetic
τ = ng / c = 3.3356 × ng µs/km
Where:
- τ — one-way group delay per unit length, µs/km; typical range 3.34 to 4.90 µs/km across the three media
- ng — effective group index of the guided mode, dimensionless; typical range 1.0025 to 1.4700
- c — vacuum speed of light, 299 792.458 km/s (standard-specified, SI definition of the metre); its reciprocal is 3.3356 µs/km
The relation is exact. Everything a medium can do to propagation delay is contained in ng, and 3.3356 µs/km is the floor no waveguide reaches.
Practical Example — delay across a 40 km metro span
Take a 40 km duct route between two data centres. Over standard single-mode fiber with ng = 1.4682, one-way delay is 40 × 4.897 = 195.9 µs and the round trip is 391.8 µs. Over hollow-core fiber with ng = 1.0027, one-way delay is 40 × 3.345 = 133.8 µs and the round trip is 267.6 µs. The round-trip saving is 124.2 µs, or 31.7 %.
Read the Full Analysis with Premium
The remaining 89% of this article — the design numbers, trade-offs and field guidance — is part of MapYourTech Premium, along with the full premium library, courses and professional tools.
You May Also Like
-
Premium
-
August 27, 2026
-
Premium
-
August 27, 2026
-
Premium
-
August 27, 2026