
Latency, Capacity and Cost: Hollow-Core, Single-Mode and Multi-Core Fibre
One 80 km route held fixed, three transmission media, and the three numbers that decide between them, each carrying the evidence class of every input.
Route length is the number the map does not give you.
What You Will Learn
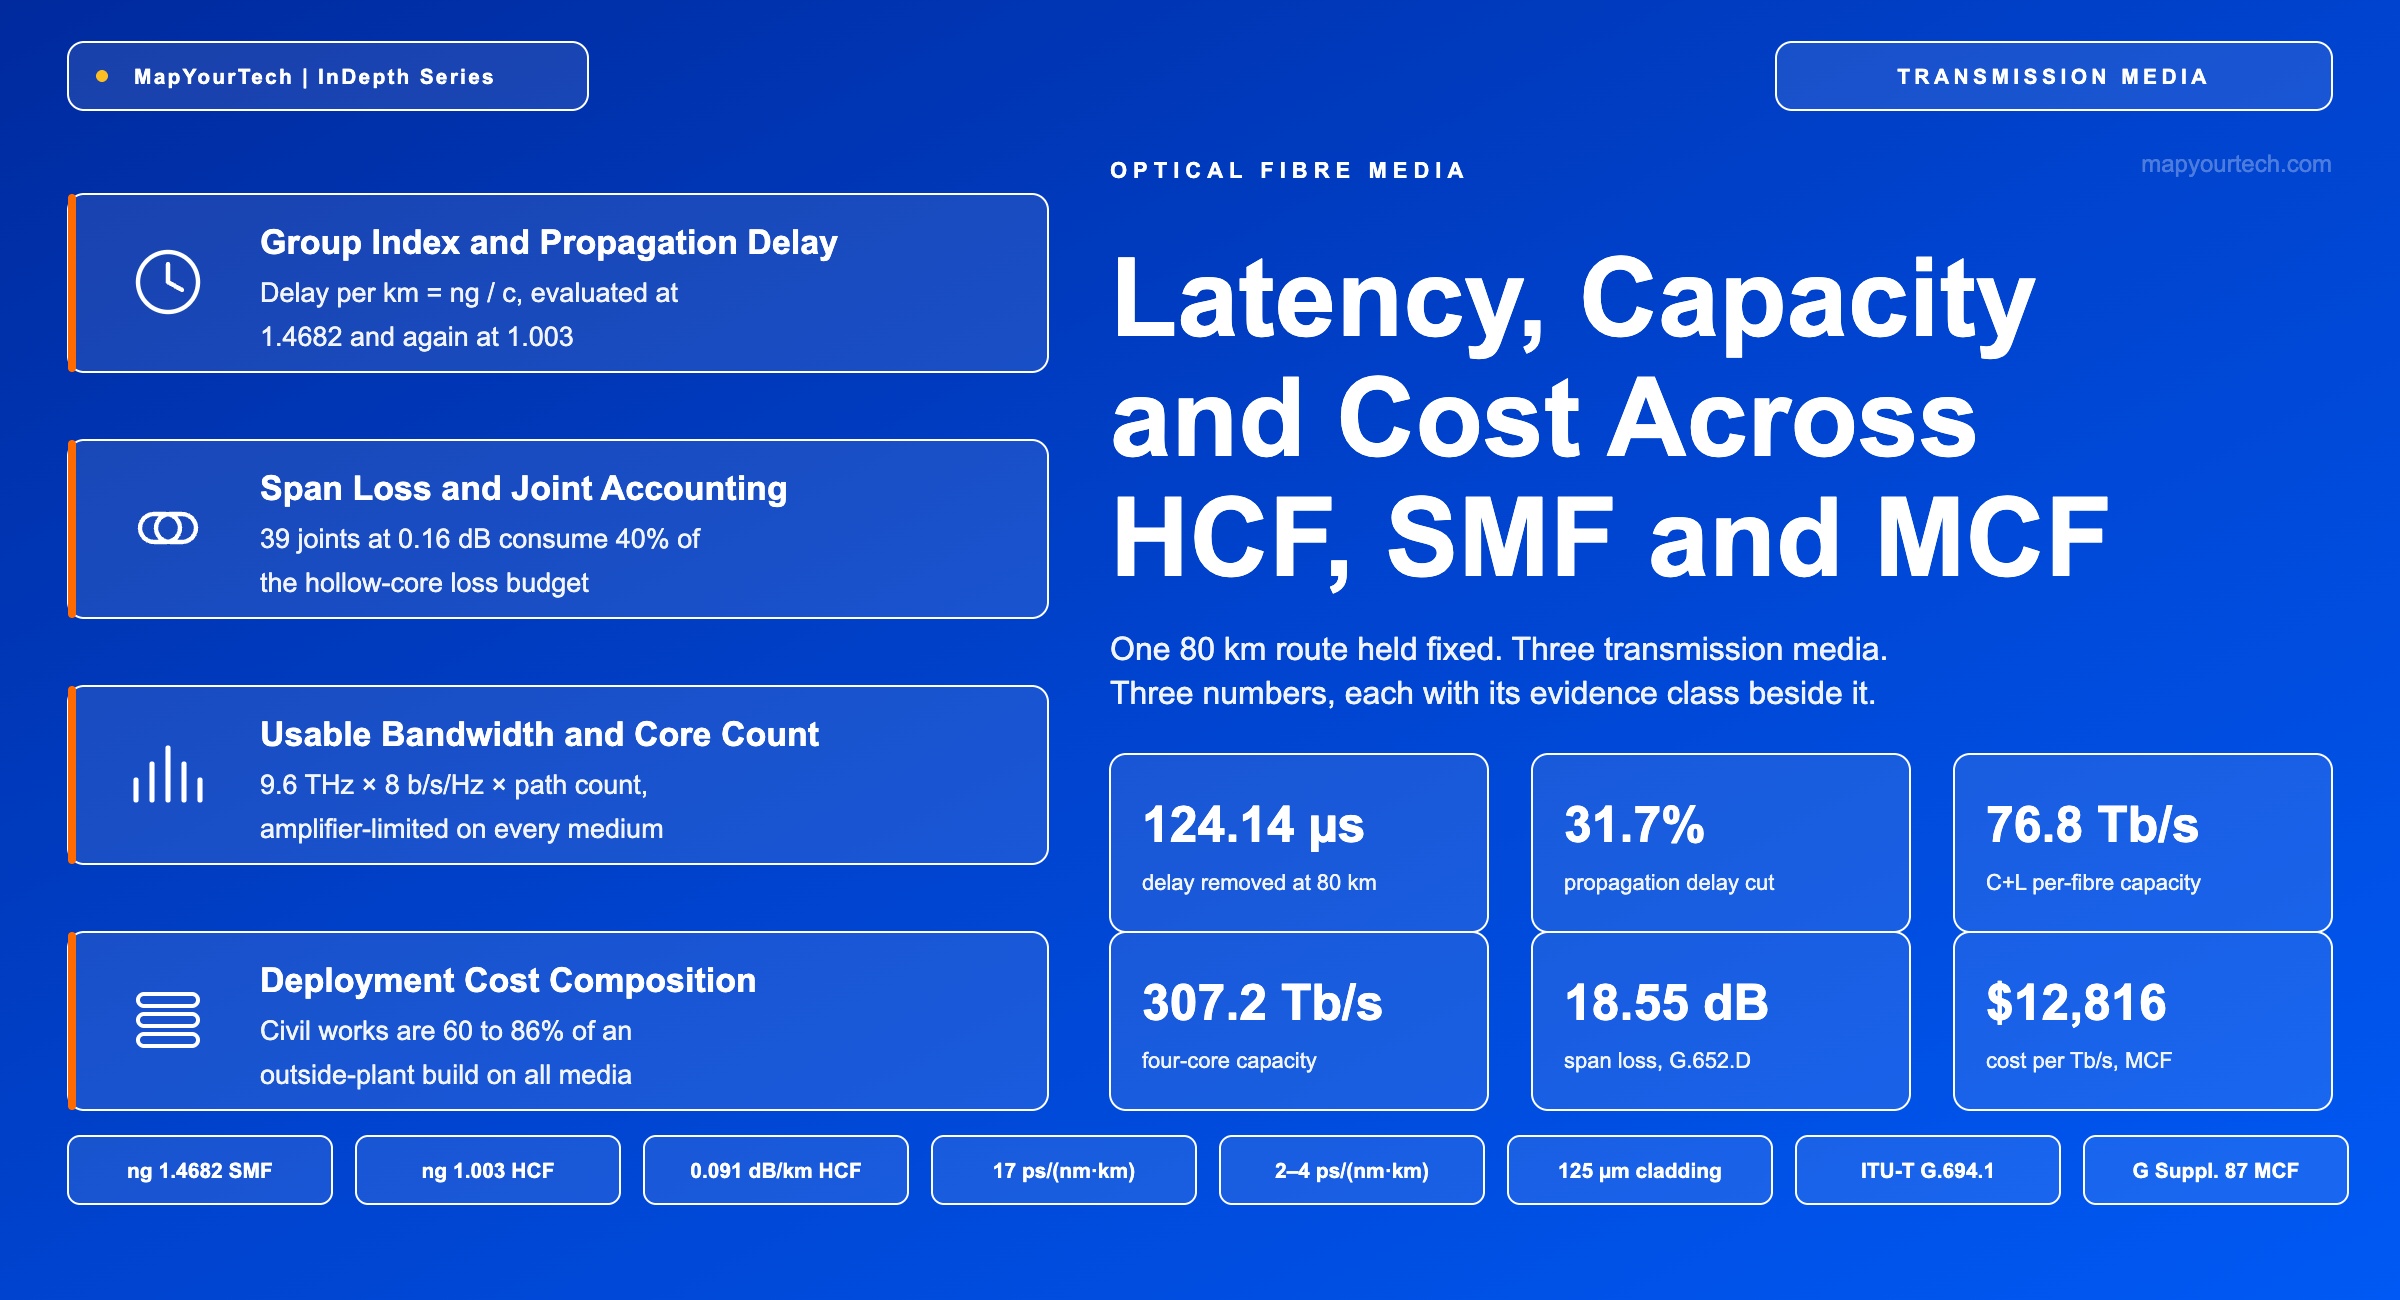
- Define the group index and separate it from the phase index, then convert 1.4682 into 4.8974 µs/km using the one-line relationship of Section 2, Figure 1.
- Place the 80 km reference route: one amplified span, 96 channels on a 100 GHz grid, 800 Gb/s per channel, held identical across all three media (Section 4, Figure 3).
- Quantify the delay difference the air core removes — 124.14 µs one way and 248.28 µs round trip at 80 km — and state why multi-core fibre removes none of it (Section 5).
- Build the span-loss budget line by line and show why 39 hollow-core splices at 0.16 dB consume 40% of that budget against 11% on single-mode fibre (Section 6, Table 3).
- Derive per-fibre capacity from usable bandwidth, spectral efficiency and core count, and separate the 76.8 Tb/s C+L result from the 307.2 Tb/s four-core result (Section 7).
- Construct the four-line deployment cost model — civil works, fibre, splicing and terminations, transceivers — for an 80 km duplex path (Section 8, Table 5).
- Convert total cost into cost per unit capacity and read the ranking: $12,816/Tb/s for four-core fibre against $52,038/Tb/s for hollow-core fibre in C+L (Section 9).
- Select a medium against a stated constraint using the decision matrix of Section 9, Table 8, rather than against a single headline figure.
1. Introduction
A metro operator specifying an 80 km route in 2026 chooses between three transmission media that share a 125 µm cladding, fit the same duct, and behave nothing alike once the link is lit. Standard single-mode fibre to ITU-T G.652.D carries one optical path through germanium-doped silica. Anti-resonant hollow-core fibre carries one optical path through air, at a group index of 1.003 rather than 1.4682. Weakly coupled multi-core fibre carries four G.652-compatible paths inside one strand. Each medium moves a different number, and none of them moves all three.
Delay follows the group index and nothing else in the fibre. Capacity follows usable bandwidth multiplied by achievable spectral efficiency multiplied by the count of independent optical paths. Cost follows four line items in a fixed order of magnitude: civil works, fibre content, splicing and terminations, and transceivers. Those three dependencies are separable, which is what makes a like-for-like comparison possible at all. Hold the route length, the channel plan, the modulation format and the terminal equipment constant, change only the glass, and every difference that appears is attributable to the medium.
The comparison has become a live procurement question rather than a research topic. Microsoft Azure reports more than 1,280 km of live hollow-core infrastructure with 0.091 dB/km operational loss and no field failures (vendor claim), euNetworks operates roughly 87 km of production hollow-core routes serving trading customers in London and Bergamo (vendor claim), and AWS has confirmed hollow-core deployment at a small number of availability-zone interconnect sites (vendor claim). On the spatial side, the SDM4 multi-source agreement between AFL, Corning, Sumitomo Electric and TeraHop is preparing a four-core specification for short-reach O-band data centre links, with publication expected within months (vendor claim). Both media are past the demonstration stage and into the stage where someone has to defend a number in a budget review.
This article fixes one 80 km metro route and produces the latency, capacity and cost figures for all three media on that route, with the evidence class beside every input. Sections 2 and 3 establish the primitives. Sections 4 to 9 carry the arithmetic. Sections 10 to 13 cover field practice, measurement, fault isolation and standards status. Amplified multi-span long-haul design sits outside the scope, because a single-span route removes the cascade behaviour that would otherwise dominate the optical signal-to-noise ratio result and obscure the medium comparison. Readers working that side of the boundary will find the cascade treated separately in the MapYourTech material on C+L band amplifier cascades and tilt management.
2. Group Index and Propagation Delay per Unit Length
The group index ng is the dimensionless ratio between the speed of light in vacuum and the speed at which a modulated pulse envelope travels inside an optical waveguide. It has no unit. Multiplying the group index by route length and dividing by the vacuum speed of light gives propagation delay directly, in seconds, and this is the only optical property of a fibre that enters a latency budget at all.
Read the Full Analysis with Premium
The remaining 88% of this article — the design numbers, trade-offs and field guidance — is part of MapYourTech Premium, along with the full premium library, courses and professional tools.
You May Also Like
-
Premium
-
August 27, 2026
-
Premium
-
August 27, 2026
-
Premium
-
August 27, 2026