
Optical Fiber Characteristics: Complete Parameter Reference
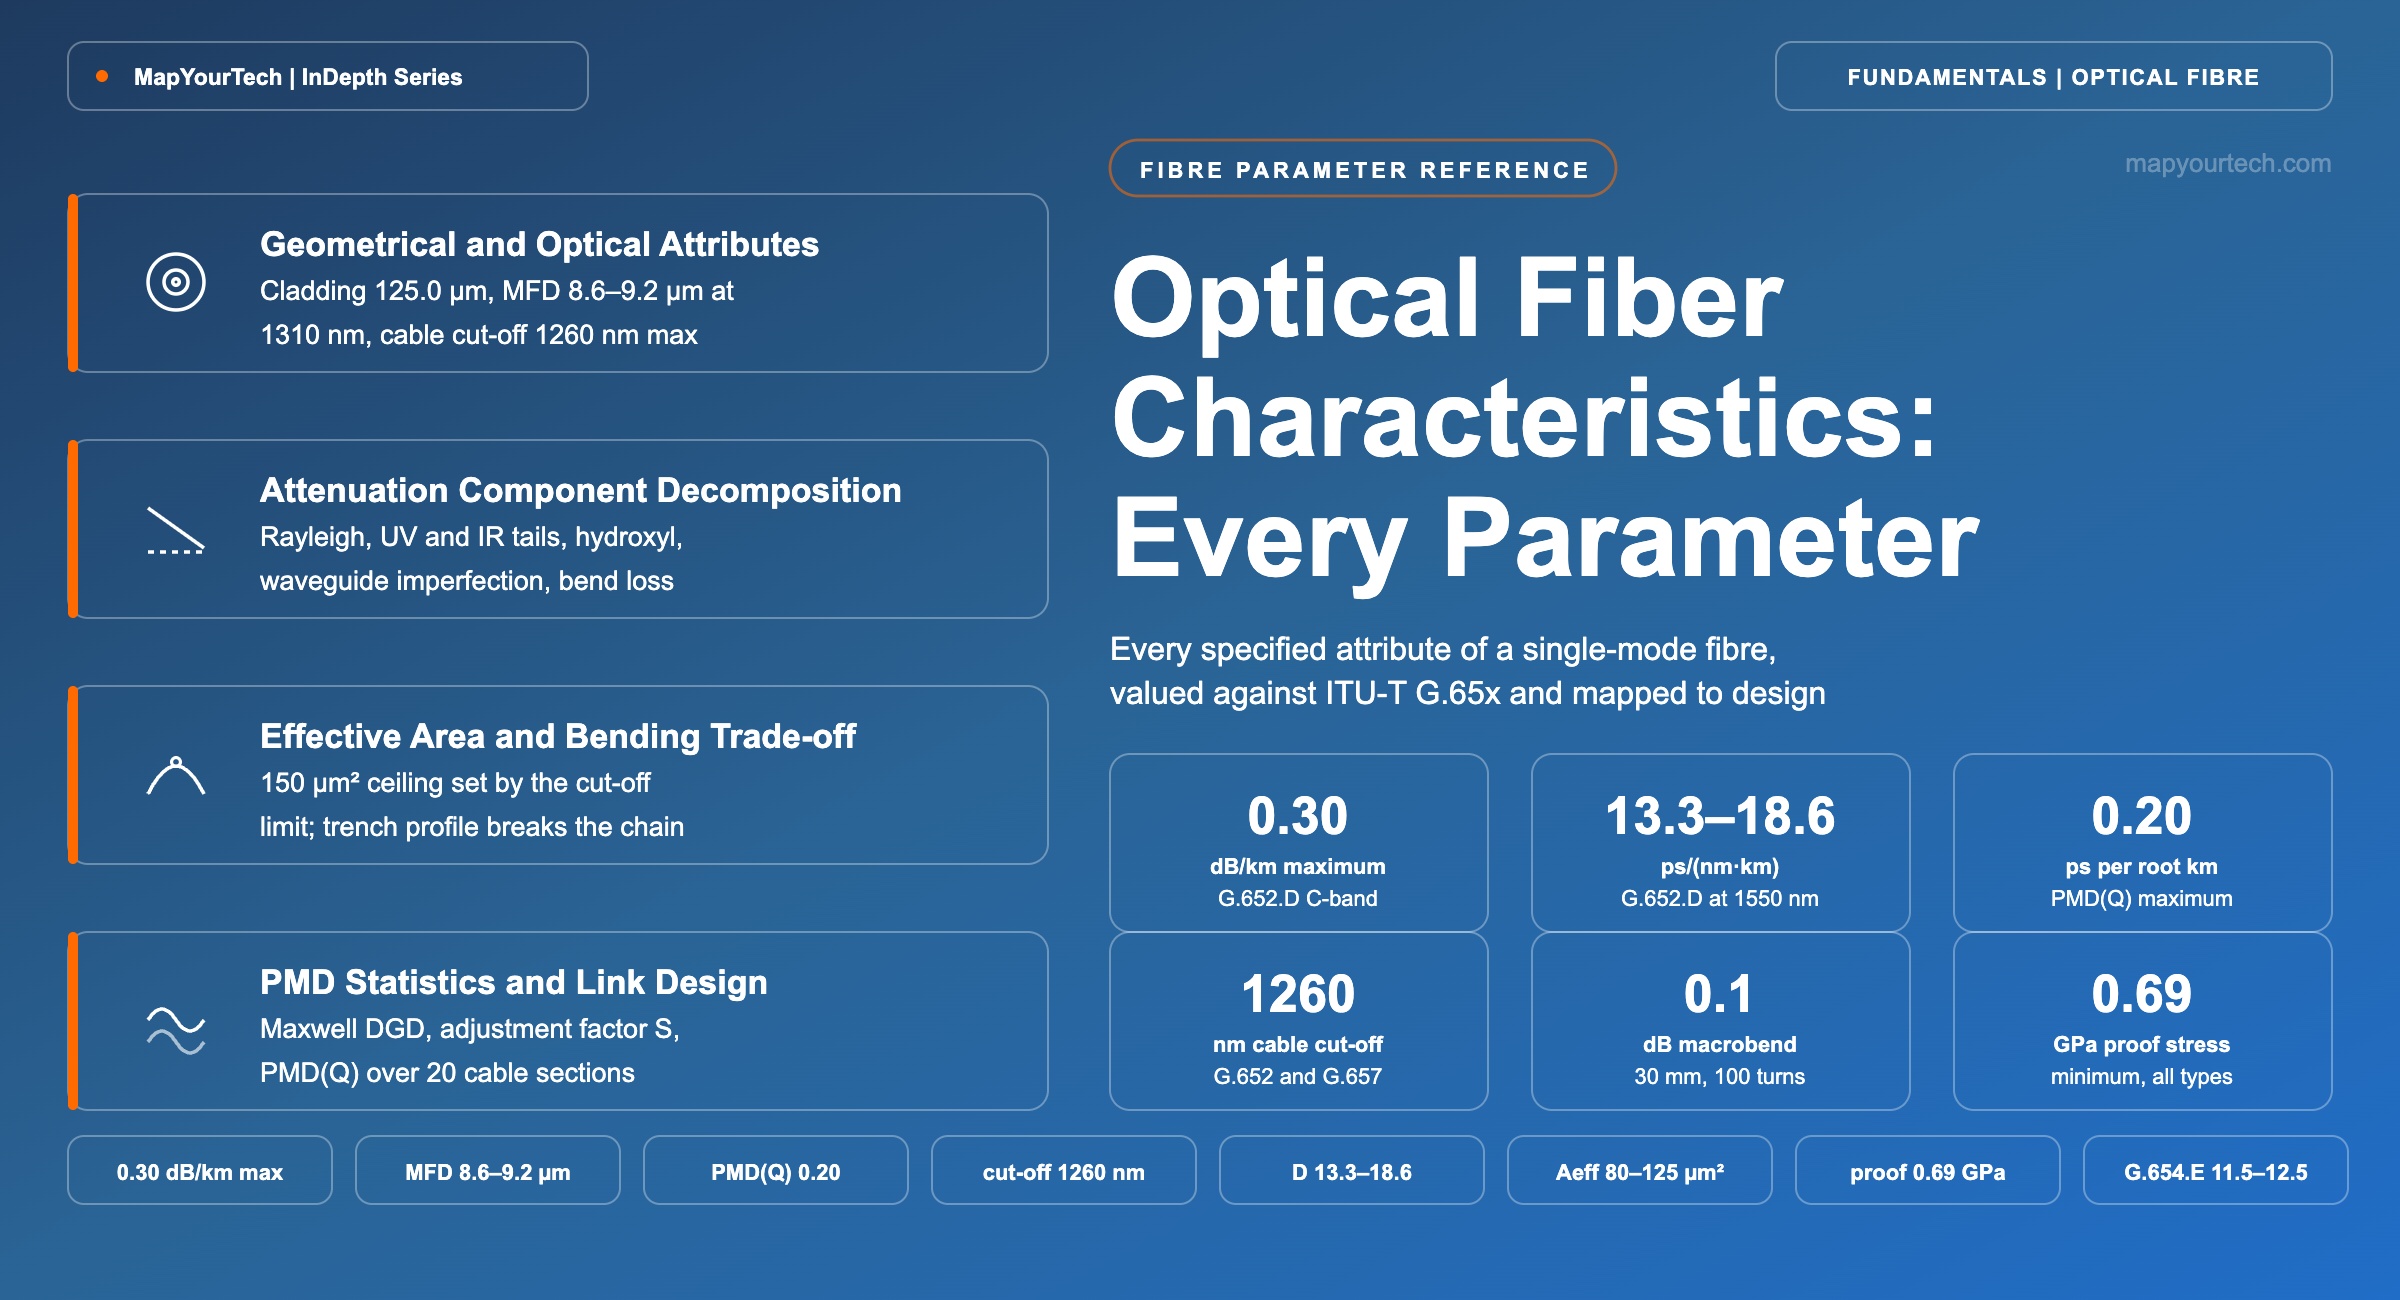
Every parameter on a single-mode fibre datasheet, defined against its ITU-T recommended value and mapped to the design decision it governs.
The true character of a fiber reveals itself under test.
What You Will Learn
- Define all twenty-one specified attributes of a single-mode fibre and place each in its fibre, cable or link attribute class per Section 3.
- Anchor the G.652.D limits used in every terrestrial budget: 0.30 dB/km across 1530–1565 nm, 13.3–18.6 ps/(nm·km) at 1550 nm, PMDQ 0.20 ps/√km.
- Quantify the four-way trade-off between effective area, cable cut-off wavelength, macrobending loss and microbending sensitivity using Figure 4.
- Compute the nonlinear coefficient γ from n2 and Aeff, and the effective length Leff for an 80 km span, using the worked values in Section 5.
- Build a link attenuation budget from the fibre coefficient, splice count and connector count, and separate worst-case from statistical design.
- Convert a PMDQ figure into a link differential group delay using the Maxwell adjustment factor table in Section 5.
- Evaluate the fibre figure of merit for a 100 km span and show why 0.15 dB/km with 150 µm² delivers about 5 dB over a 0.20 dB/km reference.
- Select a fibre category for metro, terrestrial long-haul, submarine, access and data centre builds using the matrix in Section 9.
1. Introduction
A single-mode fibre datasheet lists roughly twenty numbers. Four of them decide whether an 800 Gb/s wavelength closes over a 1,200 km route, and the rest decide whether the cable survives the duct, the splice tray and thirty years of thermal cycling. The attenuation coefficient sets how much amplifier gain the span needs; the effective area sets how much launch power the span tolerates before nonlinear interference eats the gain back; the chromatic dispersion coefficient sets the equaliser tap count in the receiver; and the polarization mode dispersion link design value sets whether a legacy route can carry a high-baud-rate signal at all. Every other parameter on the sheet exists either to protect one of those four or to make the fibre spliceable to the fibre already in the ground.
Optical fibre parameters are specified in three classes, and confusing them is the most common source of budget errors. Fibre attributes are retained through cabling and installation — mode field diameter, cladding diameter, cut-off wavelength, macrobending loss, chromatic dispersion parameters, proof stress. Cable attributes are recommended for cables as delivered — the attenuation coefficient and the PMD coefficient. Link attributes characterise concatenated cables and describe estimation methods for system interface parameters based on measurement or modelling, and they are informative rather than normative. That three-way split is stated in the scope of ITU-T G.652 and repeated in every G.65x recommendation [standard-specified, ITU-T G.652]. A planner who applies a fibre attribute where a link attribute belongs will design a span against a number the cable was never tested to hold.
1.1 The Working Parameter Subset for Coherent Systems
For a coherent line system the working subset is small. Attenuation in dB/km and span length give span loss, which sets amplifier gain and therefore amplified spontaneous emission. Effective area and the nonlinear index give the nonlinear coefficient, which with launch power and span count gives nonlinear interference power. Chromatic dispersion determines walk-off between channels, which reduces the efficiency with which nonlinear interference accumulates, and it also sets the bulk dispersion the receiver digital signal processing (DSP) must undo. PMD sets a penalty that DSP can track only if the differential group delay stays inside the equaliser memory. Everything else — cladding non-circularity, core concentricity error, coating diameter, proof stress — governs splice loss, cable performance and mechanical life rather than the optical budget directly.
Two of those parameters get treated as constants when they are not. Attenuation is a spectrum, not a number: an ITU-T G.652.D cable is specified at a maximum of 0.40 dB/km across 1310–1625 nm and a tighter 0.30 dB/km across 1530–1565 nm, while the informative typical link value used for design is 0.275 dB/km in the C-band and 0.35 dB/km in the L-band [standard-specified, ITU-T G.652]. Field measurements sit well below the maxima: reflectometer data across a core network showed 0.186 dB/km average fibre attenuation at 1551 nm for cables installed in 2003, rising to 0.194 dB/km at 1611 nm [measured, ITU-T G.Sup.39]. Design against the specification maximum and you overbuild every amplifier site; design against the measured average and the end-of-life budget fails.
Chromatic dispersion is the second. G.652.D is no longer specified by a single Sellmeier triple across the whole range. From 1260 nm to 1460 nm it is bound by three inequalities on the zero-dispersion wavelength and slope, and from 1460 nm to 1625 nm by a linear boundary pair, giving 13.3 to 18.6 ps/(nm·km) at 1550 nm and 17.2 to 23.7 ps/(nm·km) at 1625 nm [standard-specified, ITU-T G.652]. The informative typical value that appears in most link budgets, 17 ps/(nm·km), sits inside that band but is not the design limit.
Every figure below carries one of four labels in the same sentence. Standard-specified means the value appears in an ITU-T Recommendation table. Measured means field or laboratory data reported in a standards annex or peer-reviewed source. Vendor claim means a manufacturer datasheet or white paper. Theoretical limit means a physical bound rather than an achieved result. Specification maxima and typical values are distinguished throughout, because the two differ by roughly 0.1 dB/km in the C-band and that difference is the whole margin on a long span.
1.2 Coupling Between Fibre Parameters
No fibre parameter moves alone. Enlarging the effective area to reduce nonlinear interference requires a larger core radius, which raises the cut-off wavelength, which must stay below 1530 nm for a C-band fibre; holding cut-off down forces the core index difference lower, which weakens confinement and raises macrobending loss. Modelled bending loss for step-index matched-cladding profiles at 1550 nm reaches 1 dB per turn at 130 µm² effective area and 6 dB per turn at 150 µm² for a 20 mm bend diameter, while a depressed-cladding design holds the same 150 µm² fibre below 0.5 dB per turn at that diameter [modelled, fibre-design literature]. The trench is not a refinement; it is what makes large effective area deployable in a cable at all.
The same coupling runs through the mechanical parameters. Microbending sensitivity scales as the inverse sixth power of the glass cladding diameter and depends on the elastic modulus of the primary coating, so a fibre drawn to 125 µm and coated with a stiff inner primary shows an attenuation increase above roughly 115 µm² effective area, while a softer inner primary holds microbending near zero to about 135 µm² [measured, fibre-design literature]. Increasing the glass diameter to 170 µm with a 270 µm coating has been reported to reach 211 µm² effective area at 0.159 dB/km, but a thicker cladding raises the proof-test force as the cube of the diameter and lowers the minimum acceptable bend radius [measured, fibre-design literature]. Parameters that look independent on a datasheet are one design.
This article treats every specified parameter in turn: what it is, what the standard says, what it does to the system, and when it becomes the binding constraint. It runs from the geometrical attributes through the optical transmission attributes and the mechanical attributes to the statistical link attributes, then applies the whole set to fibre selection for metro, terrestrial long-haul, submarine, access and data centre builds. Readers who want the wider link context can start with the DWDM link engineering dependency framework, which shows where the fibre plant sits among amplifier, transceiver and margin parameters.
Takeaway: Fibre parameters divide into fibre, cable and link attributes, and only the first two are normative. A working coherent budget needs four of them — attenuation, effective area, chromatic dispersion and PMDQ — but all four are set by one waveguide design, so none can be improved without paying somewhere else on the sheet.
2. Development of the ITU-T G.65x Fibre Specifications
ITU-T G.652 was first approved in October 1984 and reached its tenth edition in August 2024 [standard-specified, ITU-T G.652]. Reading its change log is the fastest way to understand why the parameter set looks as it does. The 2000 edition added tables for different levels of system support. The 2003 edition introduced the reduced-water-peak categories C and D, moved the L-band upper limit to 1625 nm, added PMD requirements to all categories, and reduced the macrobending test mandrel to 30 mm radius. The 2005 edition tightened mode field diameter tolerance, reduced the maximum zero-dispersion slope, reduced the maximum core concentricity error and reduced the maximum macrobending loss. The 2016 edition replaced the G.652.D chromatic dispersion specification with a boundary-line form derived from a survey of eight fibre vendors, and the 2024 edition added statistical design guidance for O-band dispersion and for the influence of the number of concatenated cable sections on PMDQ.
Each of those changes was a response to a system requirement rather than a manufacturing improvement for its own sake. The water-peak categories exist because coarse wavelength division multiplexing needed the 1360–1460 nm E-band; the tighter dispersion boundary exists because coherent receivers need an accurate accumulated-dispersion estimate for equaliser sizing; the statistical guidance exists because worst-case concatenation of twenty cable sections produces margins that no operator will pay for.
2.1 The Six Single-Mode Fibre Types
Six single-mode fibre types are defined in the G.65x series, and a submarine systems recommendation lists them compactly: non-dispersion-shifted single-mode fibre in G.652, dispersion-shifted fibre in G.653, cut-off shifted fibre in G.654, non-zero dispersion-shifted fibre in G.655, wideband non-zero dispersion fibre in G.656, and bending-loss insensitive fibre in G.657 [standard-specified, ITU-T G.978]. The same source lists the fibre characteristics a submarine system designer needs from the cable supplier: the nonlinear coefficient n2/Aeff in W−1, the Raman gain coefficient gR in m/W, the ensemble average PMD in ps/√km, and the cable cut-off wavelength in nm — a shorter list than the terrestrial datasheet, and a good indication of which parameters carry the design.
Three of the six are effectively historical for new builds. G.653 dispersion-shifted fibre places the zero-dispersion wavelength near 1550 nm, which makes four-wave mixing phase-matched across the C-band and rules out dense channel spacing; the design that solved a 1990s single-channel problem created a worse multi-channel one. G.655 non-zero dispersion-shifted fibre corrected that by holding a small non-zero dispersion across 1530–1565 nm, and it was widely deployed before 2005, but coherent detection removed the reason to suppress dispersion in the first place. Measured reflectometer data across 216 G.655 links and 55 G.652 links from one operator's core network showed G.655 running 0.015–0.020 dB/km higher attenuation than G.652 across 1261–1341 nm and 0.016–0.021 dB/km higher across 1461–1621 nm [measured, ITU-T G.Sup.39] — a real cost with no remaining benefit once the receiver compensates dispersion electronically. The full argument is worked through in the article on dispersion-shifted fibre and the NZDSF solution.
2.2 Spectral Band Allocation and Its Parameter Consequences
The band boundaries are not arbitrary and each one traces back to a fibre parameter. The O-band starts at 1260 nm because that is the maximum cable cut-off wavelength for G.652, below which single-mode operation is not assured. It ends at 1360 nm because 1375 nm sat on the rising edge of the water absorption band peaked at 1383 nm. The E-band ends at 1460 nm because the effects of a small water peak become negligible beyond about that wavelength. The C-band runs 1530–1565 nm because that was the useful gain band of early erbium-doped fibre amplifiers. The L-band ends at 1625 nm because cabled fibre performance over the operating temperature range is adequate to that wavelength for current fibre types. The U-band, 1625–1675 nm, is reserved for maintenance and fibre operation in it is not assured [standard-specified, ITU-T G.Sup.39].
Read the Full Analysis with Premium
The remaining 89% of this article — the design numbers, trade-offs and field guidance — is part of MapYourTech Premium, along with the full premium library, courses and professional tools.
You May Also Like
-
Premium
-
September 1, 2026

-
Premium
-
September 1, 2026
-
Free
-
August 31, 2026