
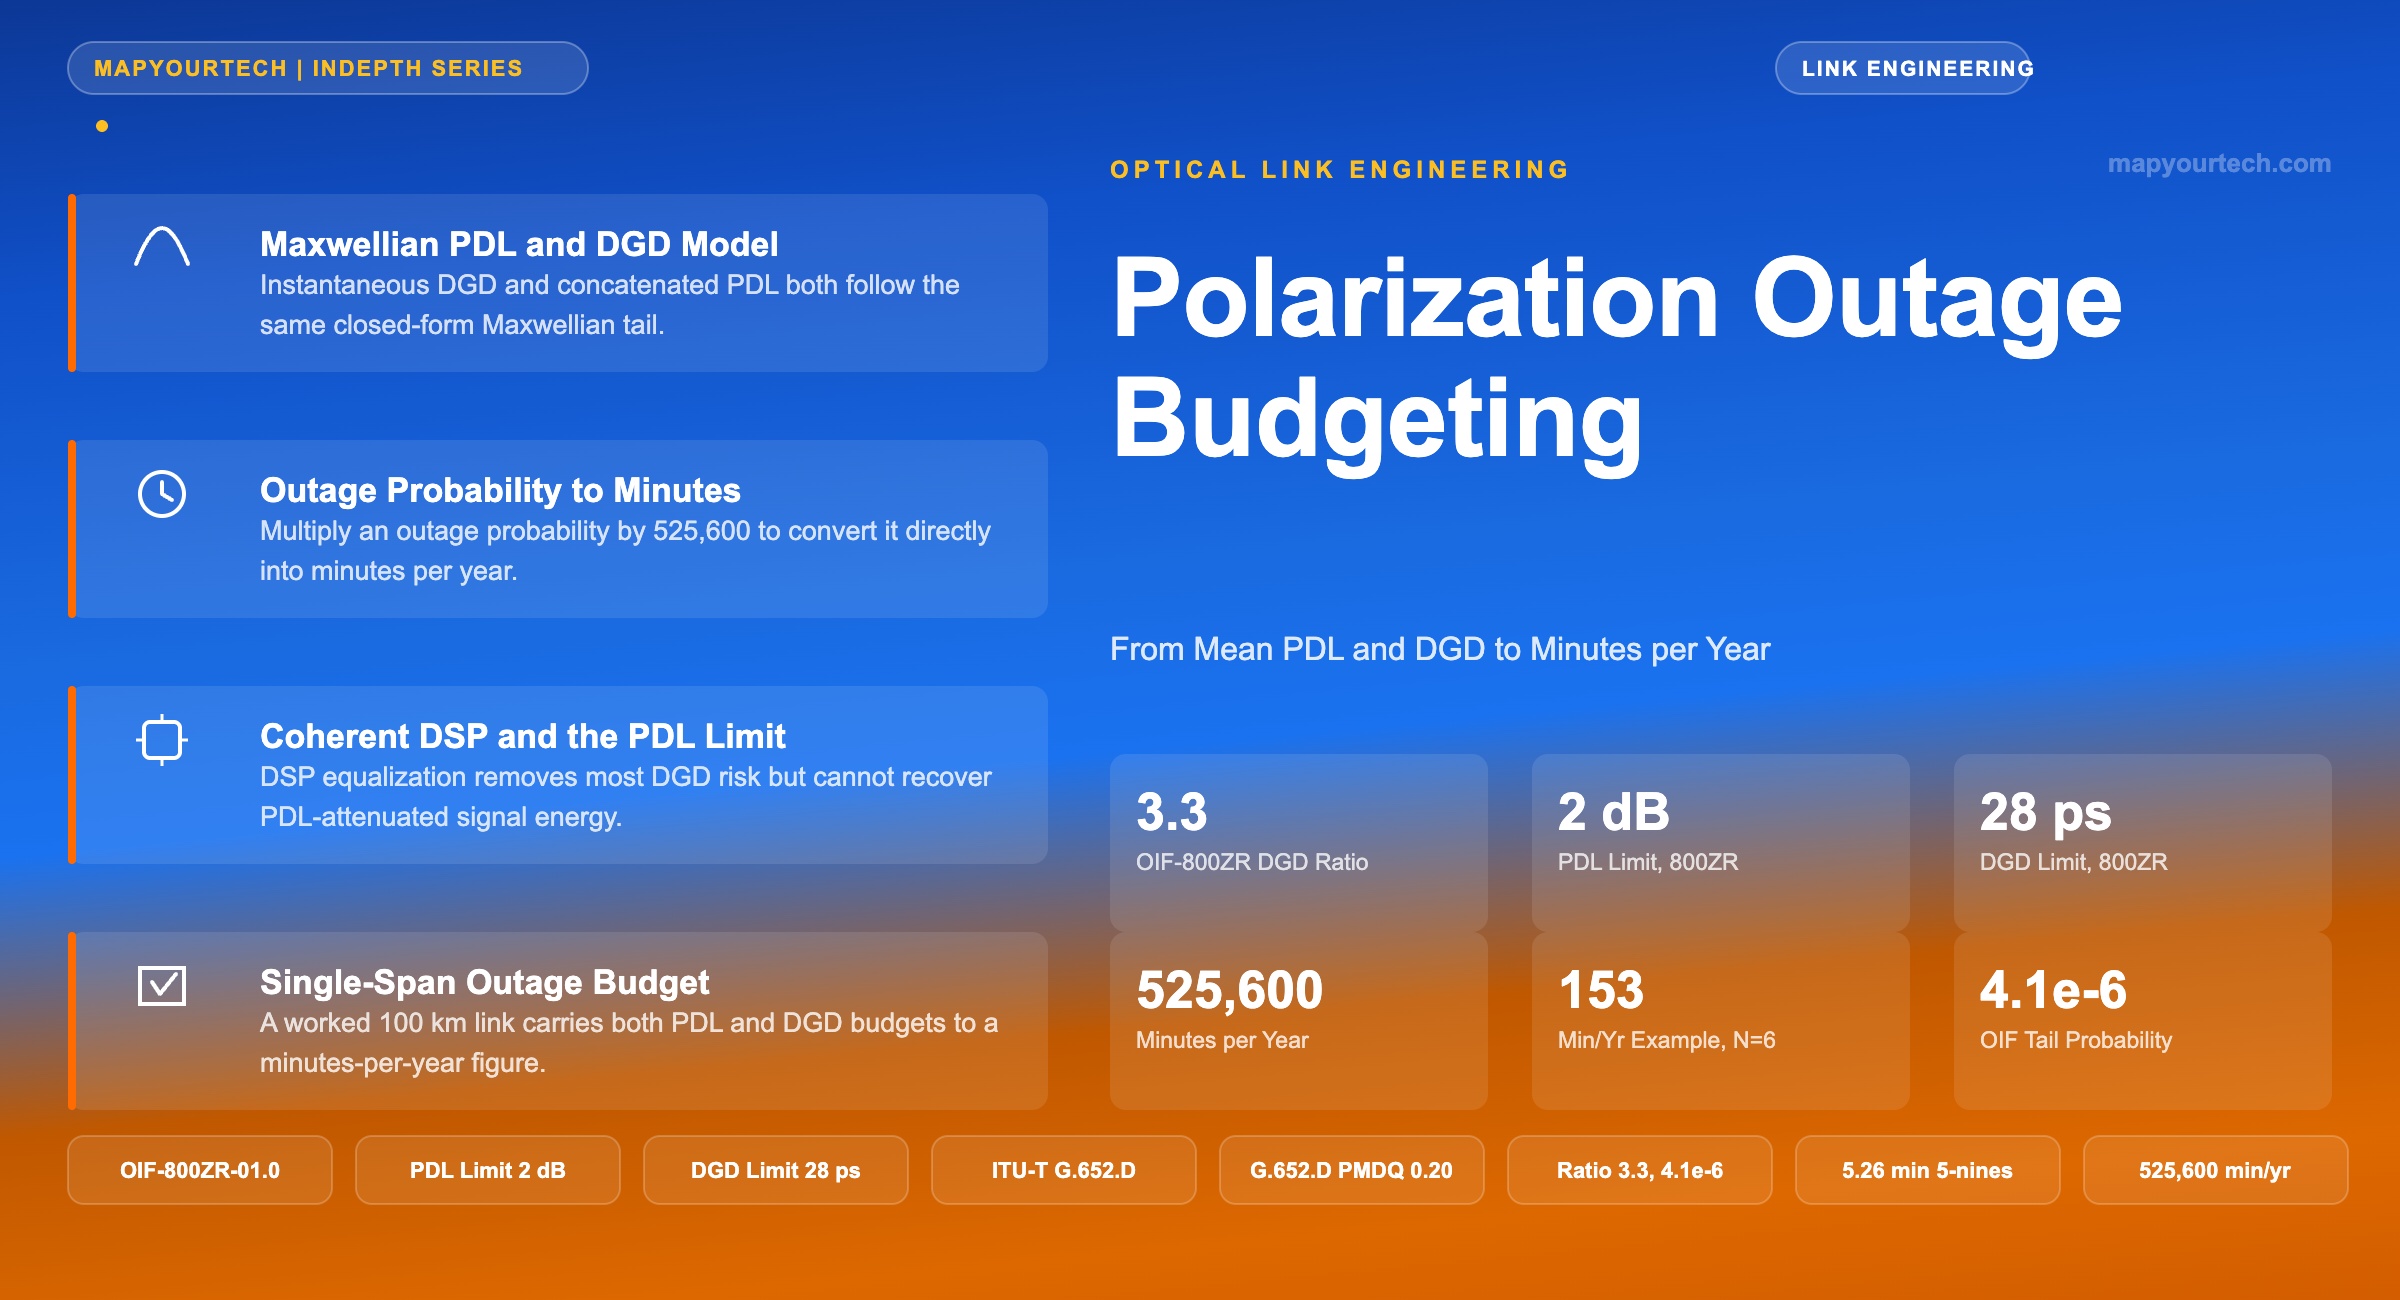
Polarization Outage Budgeting: From Mean PDL and DGD to Minutes per Year
Converting concatenated PDL and DGD statistics into the outage-minutes figure a service-level agreement needs, with the Maxwellian model verified against a published OIF tail probability.
Dispersion is deterministic, and polarization is not.
What You Will Learn
- Define PDL and DGD as the ratio and time-difference quantities ITU-T and OIF implementation agreements specify, with the units and conversion arithmetic in one line.
- State the Maxwellian probability density function that governs both quantities, verified against a published OIF-800ZR tail probability of 4.1×10⁻⁶ at a 3.3 mean-DGD ratio.
- Convert an outage probability directly into minutes and seconds per year, on the same 525,600-minute reference period the industry's UAS and five-nines figures already use.
- Distinguish the PMDQ link design value ITU-T G.652 specifies for fiber manufacturing from the instantaneous, time-varying outage probability a single deployed link carries.
- Identify why coherent DSP equalization removes most of a link's DGD risk but leaves its PDL risk largely intact.
- Build a complete polarization outage budget for a representative single-span coherent link, carrying both PDL and DGD through to a minutes-per-year figure.
- Compare the outage-probability design ratio that OIF, IEEE 802.3, and classical PMD-tolerance practice each apply.
- Apply a repeatable procedure for setting and monitoring a polarization outage budget on a new link design.
1. Introduction
A link budget that lists mean polarization dependent loss (PDL) as 0.8 dB and mean differential group delay (DGD) as 4 ps has said nothing yet about how often the link fails. Both quantities are random variables that fluctuate with temperature, mechanical stress, and the random orientation of every discrete element along the path, and the number that matters to a service-level agreement is not the mean but the probability that the instantaneous value exceeds the margin the design carries. That probability, multiplied by the number of minutes in a year, is what a customer experiences as downtime.
Concatenated PDL elements follow a Maxwellian distribution once enough of them are strung together, and so does the instantaneous DGD produced by concatenated birefringent fiber sections. The same functional form governs both quantities, which means the same tail-probability arithmetic converts a mean value and a design margin into an outage probability for either impairment, and the same 525,600-minute reference period used for unavailable-seconds (UAS) reporting under ITU-T G.8201 converts that probability into minutes per year. This article builds that chain end to end: from the physical definitions of PDL and DGD, through the Maxwellian model that describes their statistics, to a worked outage-minutes figure for a representative coherent link, cross-checked against a tail probability the Optical Internetworking Forum (OIF) has itself published.
The scope covers first-order PMD and PDL statistics for a single amplified span or a small number of concatenated spans, the outage-probability framework classical PMD-tolerance engineering already uses, and the specific case of coherent client optics where digital signal processing (DSP) changes which of the two impairments binds the design. Higher-order PMD, joint PMD-PDL statistics, and multi-span restoration scenarios are outside what a single article can carry with the same numerical care, though the closing sections point to where that further work sits in the current literature.
Read the Full Analysis with Premium
The remaining 89% of this article — the design numbers, trade-offs and field guidance — is part of MapYourTech Premium, along with the full premium library, courses and professional tools.
You May Also Like

-
Free
-
September 4, 2026

-
Premium
-
September 4, 2026

-
Premium
-
September 4, 2026