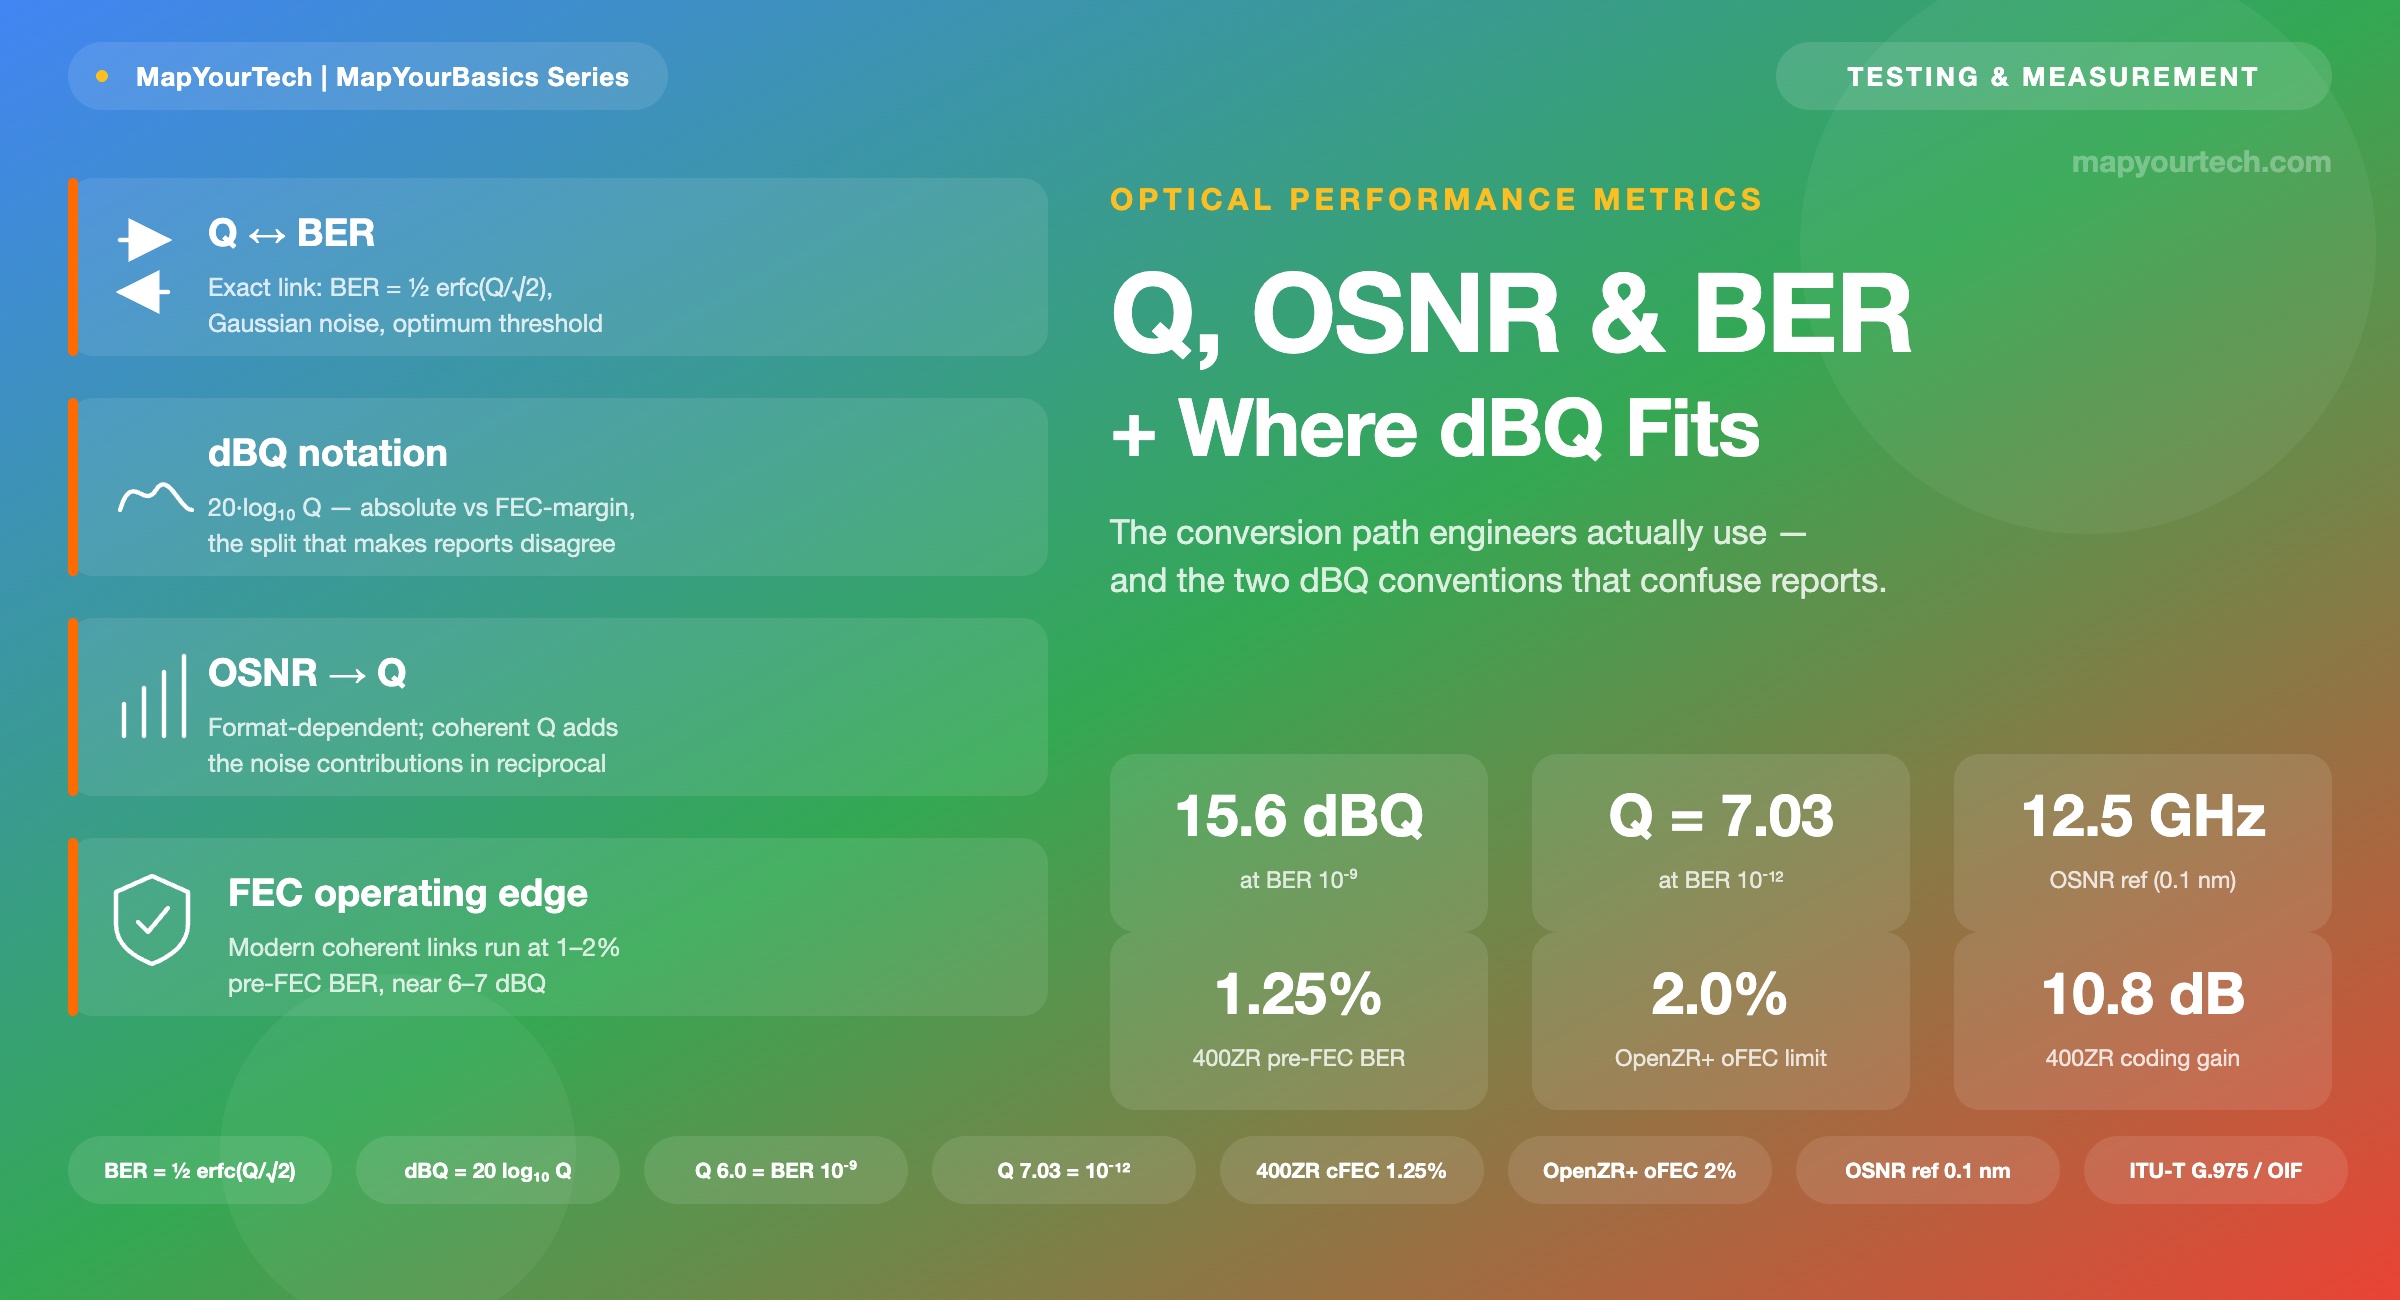
Q-Factor, OSNR, and BER: The Conversion Chain and dBQ
One decision-circuit ratio, one error probability, one optical noise measurement — and the dBQ notation that ties them together but reads differently in two vendors' test reports.
Introduction
Three numbers describe the same link at three different layers. OSNR (optical signal-to-noise ratio) lives in the optical domain, measured on a spectrum analyzer as signal power over amplified-spontaneous-emission (ASE) noise in a fixed reference bandwidth. Q-factor lives at the decision circuit, an amplitude ratio built from the mark and space distributions. BER (bit error ratio) lives in the digital domain, the fraction of bits the receiver got wrong. A field engineer reads them off different instruments, but they are bound by a short chain of equations, and moving along that chain cleanly is a daily task in commissioning and fault-finding.
The friction point is dBQ — Q-factor expressed in decibels. It appears on nearly every coherent line card's performance monitor, and two test reports can print a dBQ value for the same link that differ by several decibels without either being wrong, because the industry uses two definitions of it. This article walks the conversion path engineers actually use between Q, BER, and OSNR, states the assumption each step leans on, and pins down what a dBQ figure means so the two conventions stop being a source of confusion.
1. Three metrics, three layers
Start with where each quantity is defined, because the conversions only hold under the definition each one carries.
OSNR is the ratio of channel signal power to ASE noise power measured in a reference optical bandwidth, conventionally 0.1 nm, which is about 12.5 GHz near 1550 nm (standard-specified in the ITU-T optical-design recommendations). The reference bandwidth is a convention, not a physical property of the receiver, so an OSNR number is meaningless until the bandwidth is stated — high-baud signals are sometimes reported in 0.5 nm instead, a factor-of-five shift. For the reference-bandwidth details and how OSNR feeds link budgeting, see the MapYourTech walkthrough on OSNR, the reference bandwidth, and the Shannon limit.
Q-factor is the signal-to-noise ratio seen at the decision circuit, expressed as an amplitude ratio:
Q = (μ1 − μ0) / (σ1 + σ0)
μ1, μ0 are the mean levels of the marks (ones) and spaces (zeros); σ1, σ0 are their noise standard deviations. Q is dimensionless. Because it is built from a difference of levels over a sum of standard deviations, Q behaves like a voltage or field ratio, not a power ratio — a fact that decides how it converts to decibels.
That amplitude-ratio character is the detail most write-ups skip, and it is exactly why dBQ uses a factor of 20 rather than 10, covered in section 3. For the operational reading of Q as a receiver-margin indicator, MapYourTech's note on what Q-factor is and why it matters is a useful companion.
BER is the measured probability that a received bit is in error: erroneous bits divided by total bits. It is the ground truth, but it is slow to measure at low values — confirming a BER of 10−12 to 95% confidence needs roughly 3×10¹² error-free bits, about 20 minutes at 2.5 Gb/s (standard-specified confidence relation in ITU-T's SDH-era supplements). That measurement-time problem is the original reason Q-factor exists: Q can be inferred from the eye statistics in seconds and converted to an estimated BER, sidestepping the long count.
Takeaway: OSNR is optical and bandwidth-referenced, Q is an amplitude ratio at the decision point, and BER is the digital outcome. The conversions below only hold under those exact definitions — an OSNR without its reference bandwidth, or a Q measured through a different receiver filter than the one that carries traffic, breaks the chain.
2. Q to BER: the exact link, and its one assumption
The cleanest step in the chain is Q to BER. With the decision threshold set at the optimum point and the noise Gaussian on both rails, the relationship is exact (standard-specified in the ITU-T G-series design supplements):
BER = ½ erfc(Q / √2)
erfc is the complementary error function. For Q > 3 a common approximation is BER ≈ exp(−Q2/2) / (Q·√(2π)), accurate enough for design work and far easier to invert by hand.
Two anchors are worth memorizing because they frame every conversation about pre-forward-error-correction (pre-FEC) performance: a linear Q of 6.0 maps to a BER of 10−9, and a Q of 7.03 maps to 10−12 (both standard-specified). Those were the "error-free" targets of the pre-FEC era; modern coherent systems operate far to the left of them and lean on FEC to reach the client-side target.
The assumption doing all the work here is Gaussian noise with an optimally placed threshold. In an ASE-limited link with dominant signal–spontaneous beat noise, that assumption is close, and the measured BER tracks the Q-derived estimate. It weakens wherever the noise is not Gaussian: strong pattern dependence, non-linear phase noise, tight optical filtering, or residual dispersion all skew the mark and space distributions, so the Q-estimated BER and the counted BER drift apart. This is why standards bodies call Q a qualitative indicator of BER rather than a substitute for counting it — the formula is exact, but only for the idealized channel it assumes.
A commissioning test shows a stable Q implying BER 10−13, but the FEC counters report a pre-FEC BER an order of magnitude worse. Nothing is broken. The Q analyzer sampled the eye through its own filter and assumed Gaussian tails; the real channel had residual chromatic dispersion closing one rail asymmetrically, fattening the error tail beyond Gaussian. The FEC decoder, counting real bits through the traffic-carrying DSP path, sees the truth. Trust the counted pre-FEC BER over the eye-inferred Q whenever they disagree, and treat the gap as a distortion flag.
3. Where dBQ fits — and why reports disagree
Q spans a wide numeric range, so it is compressed to decibels for display. Because Q is an amplitude-like ratio, the conversion uses the field-quantity factor of 20, not the power factor of 10 (this follows the standard decibel convention for amplitude quantities in ITU-R V.574):
QdB = 20 · log10(Qlinear)
Equivalently 10·log10(Q2), since Q2 plays the role of an electrical SNR. A linear Q of 6 is 15.6 dBQ; a Q of 7.94 (the BER 10−15 point) is 18.0 dBQ. Using the power factor of 10 by mistake halves every figure — a frequent error when someone treats Q as a power ratio.
So far, unambiguous. The confusion enters because many coherent platforms report a second quantity, also labelled dBQ, that is a margin rather than an absolute value:
Qmargin,dB = 20 · log10(Q / Qref)
Qref is the pre-FEC Q that the FEC just corrects to the post-FEC target (typically a post-FEC BER of 10−15 under an assumed error distribution). This form reads zero at the FEC edge and rises as the link gains margin.
The two forms answer different questions. Absolute dBQ says how good the raw signal is; margin dBQ says how far the link sits above the FEC cliff — the "oil light" reading a network operations centre watches. A raw signal at 8.5 dBQ absolute might be reported as, say, 2 dB of Q-margin on a platform whose FEC edge sits near 6.5 dBQ absolute. Same physics, two numbers, and neither is wrong. The discipline that avoids the trap: never compare a dBQ value across vendors without confirming which definition each one uses, and note that some implementations reference the margin against a different post-FEC target, shifting Qref again. MapYourTech's walkthrough of Q and dBQ works through both definitions with the margin interpretation in full.
4. The conversion reference table
The table below lists the operating points engineers meet most, with linear Q and absolute dBQ derived from the Gaussian relation of section 2. The BER thresholds are standard-specified by the cited bodies; the Q and dBQ columns are computed from BER = ½ erfc(Q/√2), so they are exact for the idealized Gaussian channel and should be read as reference points, not independent measurements.
| Operating point | BER | Q (linear) | dBQ (absolute) | Source of the BER threshold |
|---|---|---|---|---|
| OpenZR+ oFEC pre-FEC limit | 2.0×10⁻² | 2.05 | 6.25 dB | OpenZR+ MSA (standard-specified) |
| 15% SD-FEC pre-FEC limit | 1.56×10⁻² | 2.16 | 6.7 dB | Soft-decision FEC class (standard-specified) |
| OIF 400ZR cFEC pre-FEC limit | 1.25×10⁻² | 2.24 | 7.0 dB | OIF 400ZR Implementation Agreement |
| 7% HD-FEC (GFEC) pre-FEC limit | 3.8×10⁻³ | 2.67 | 8.5 dB | ITU-T G.975 first-generation FEC |
| Classic "error-free" | 1×10⁻⁹ | 6.00 | 15.6 dB | Pre-FEC era design target |
| SDH receiver reference | 1×10⁻¹² | 7.03 | 16.9 dB | ITU-T SDH recommendations |
| Post-FEC error-free target | 1×10⁻¹⁵ | 7.94 | 18.0 dB | Coherent client-side target |
Read the table top to bottom and the modern shift is obvious: a 400ZR link operates error-free at the client while its raw channel sits at a pre-FEC BER of 1.25% — about 7 dBQ absolute — a point that would have been an outright link failure before soft-decision FEC. The FEC engine turns that 1–2% raw error rate into a post-FEC 10−15 (standard-specified: the OIF 400ZR concatenated FEC delivers roughly 10.8 dB net coding gain, and OpenZR+ oFEC about 11.1 dB for QPSK). For the FEC schemes behind these thresholds, see MapYourTech on open FEC (oFEC) and Reed-Solomon FEC.
Data table for Figure 2
| dBQ | BER |
|---|---|
| 6 | 2.3×10⁻² |
| 8 | 6.0×10⁻³ |
| 10 | 7.8×10⁻⁴ |
| 12 | 3.4×10⁻⁵ |
| 14 | 2.7×10⁻⁷ |
| 15.6 | 1.0×10⁻⁹ |
| 18 | 1.0×10⁻¹⁵ |
5. OSNR to Q: the format-dependent step
OSNR sits one step removed from the rest of the chain. Q, BER, and dBQ all describe the signal after the receiver has done its work, so they interconvert without knowing the modulation format. OSNR describes the signal before the receiver, so translating OSNR into Q requires a receiver model, and that model depends on the modulation format and the receiver's noise bandwidth.
Direct-detection OOK
For on–off keying with an optically pre-amplified receiver, Q rises with OSNR, but the mapping also depends on two things test reports rarely print: the ratio of optical to electrical noise bandwidth (Br/Be) and the transmitter extinction ratio. The physical reason is beat noise — the mark rail is dominated by signal–spontaneous beating, the space rail by spontaneous–spontaneous beating, so the two rails have unequal noise and Q is not a single clean function of OSNR alone. The full expression combining both beat terms and the extinction ratio is given in the ITU-T G-series optical-design supplements; the practical point is that the same OSNR yields different Q depending on the receiver's filtering and the transmitter's extinction ratio.
Coherent detection
Modern coherent links replace beat-noise bookkeeping with a cleaner structure. The linear Q is set by the reciprocal sum of the independent noise contributions:
1 / Q2 = 1/SNROSNR + 1/SNRmodem + 1/SNRpropagation
SNROSNR is the OSNR-limited term (it scales with OSNR and the ratio of reference bandwidth to symbol rate); SNRmodem is the transceiver's implementation ceiling from finite ENOB, laser linewidth, and quantization; SNRpropagation captures fibre non-linearity, PDL, and filtering. Structure per the coherent Q model in the ITU-T G-series design literature.
The reciprocal sum carries a design lesson: the worst contributor dominates Q. Pouring more OSNR into a link whose modem SNR ceiling is 18 dB buys almost nothing once the OSNR-limited term exceeds it — the 1/SNRmodem term floors Q regardless. This is why a 16QAM channel with plentiful OSNR can still miss its FEC threshold: the implementation SNR, not the optical noise, is the binding limit. Higher-order formats need more OSNR precisely because their symbols sit closer together, so a given OSNR yields a lower SNR per symbol; typical requirements run near 20 dB for NRZ, 15–20 dB for QPSK, and 25 dB or more for 16QAM (typical values, format- and rate-dependent). The interplay of format, OSNR, and reach is developed in MapYourTech on constellation diagrams for QPSK and QAM and in the overview of key DWDM link-design parameters.
Takeaway: Q, BER, and dBQ interconvert without knowing the modulation. OSNR does not — converting it to Q needs a format- and receiver-specific model. In coherent links, remember that the modem's own SNR ceiling can cap Q below what the OSNR alone would allow, so more OSNR is not always the fix.
6. Working with the chain in the field
A few habits keep the conversions honest in commissioning and fault-finding:
- Confirm the dBQ convention before comparing anything. Absolute dBQ and margin dBQ can differ by several decibels for the same link. A margin figure near zero means the link is at the FEC edge; the same link's absolute dBQ is a larger number that says nothing about proximity to the cliff on its own.
- Trust counted pre-FEC BER over eye-inferred Q when they disagree. The FEC counters see real bits through the traffic path; a Q analyzer sees an eye through its own filter under a Gaussian assumption. A persistent gap points to distortion — residual dispersion, non-linear phase noise, or tight filtering — not to a bad reading.
- Always state the OSNR reference bandwidth. An OSNR in 0.1 nm and one in 0.5 nm differ by about 7 dB for the same signal. Every OSNR-to-Q estimate silently assumes a bandwidth; get it wrong and the derived Q is off by the same margin.
- Watch the FEC edge, not the legacy 10−12 target. Modern coherent links run at 1–2% pre-FEC BER by design. A raw BER that would once have meant failure is now the normal operating point; the number that matters is the margin above the FEC threshold, in whichever dBQ form the platform reports.
- Treat Q as a fast estimator, BER as the verdict. Q exists because low BERs are slow to count. Use it to trend and to triage, and fall back to counted BER when the decision has to be certain.
Summary
The chain runs OSNR → Q → BER, with dBQ as the decibel view of Q. Q to BER is exact under a Gaussian, optimally-thresholded assumption, giving the fixed anchors Q 6 = BER 10−9 and Q 7.03 = BER 10−12. dBQ is 20·log₁₀(Q) because Q is an amplitude ratio — but it appears in two flavours, absolute and FEC-margin, and confusing them is the single most common source of cross-vendor disagreement. OSNR converts to Q only through a format- and receiver-specific model, and in coherent systems the modem's own SNR ceiling can bound Q below the OSNR limit. Today's operating point is the FEC edge near 1–2% pre-FEC BER — roughly 6–7 dBQ absolute — not the pre-FEC-era 10−12. Keep the reference bandwidth, the dBQ convention, and the Gaussian assumption in view, and the four numbers stay consistent.
- ITU-T G-series Supplement — Optical System Design and Engineering Considerations, ITU-T Study Group 15.
- ITU-T G.977 — Characteristics of Optically Amplified Optical Fibre Submarine Cable Systems, ITU-T Study Group 15.
- OIF — 400ZR Implementation Agreement, Optical Internetworking Forum.
- OpenZR+ Multi-Source Agreement — 400G Digital Coherent Optics for Multi-Haul Applications, OpenZR+ MSA Group.
- ITU-R V.574 — Use of the Decibel and the Neper in Telecommunication, ITU Radiocommunication Sector.
- Sanjay Yadav, "Optical Network Communications: An Engineer's Perspective" — Bridge the Gap Between Theory and Practice in Optical Networking.

Optical Communications & Network Automation Expert | Author of 3 Books for Optical Engineers | Founder, MapYourTech
Optical networking engineer with nearly two decades of experience across DWDM, OTN, coherent optics, submarine systems, and cloud infrastructure. Founder of MapYourTech. Read full bio →
Follow on LinkedInRelated Articles on MapYourTech