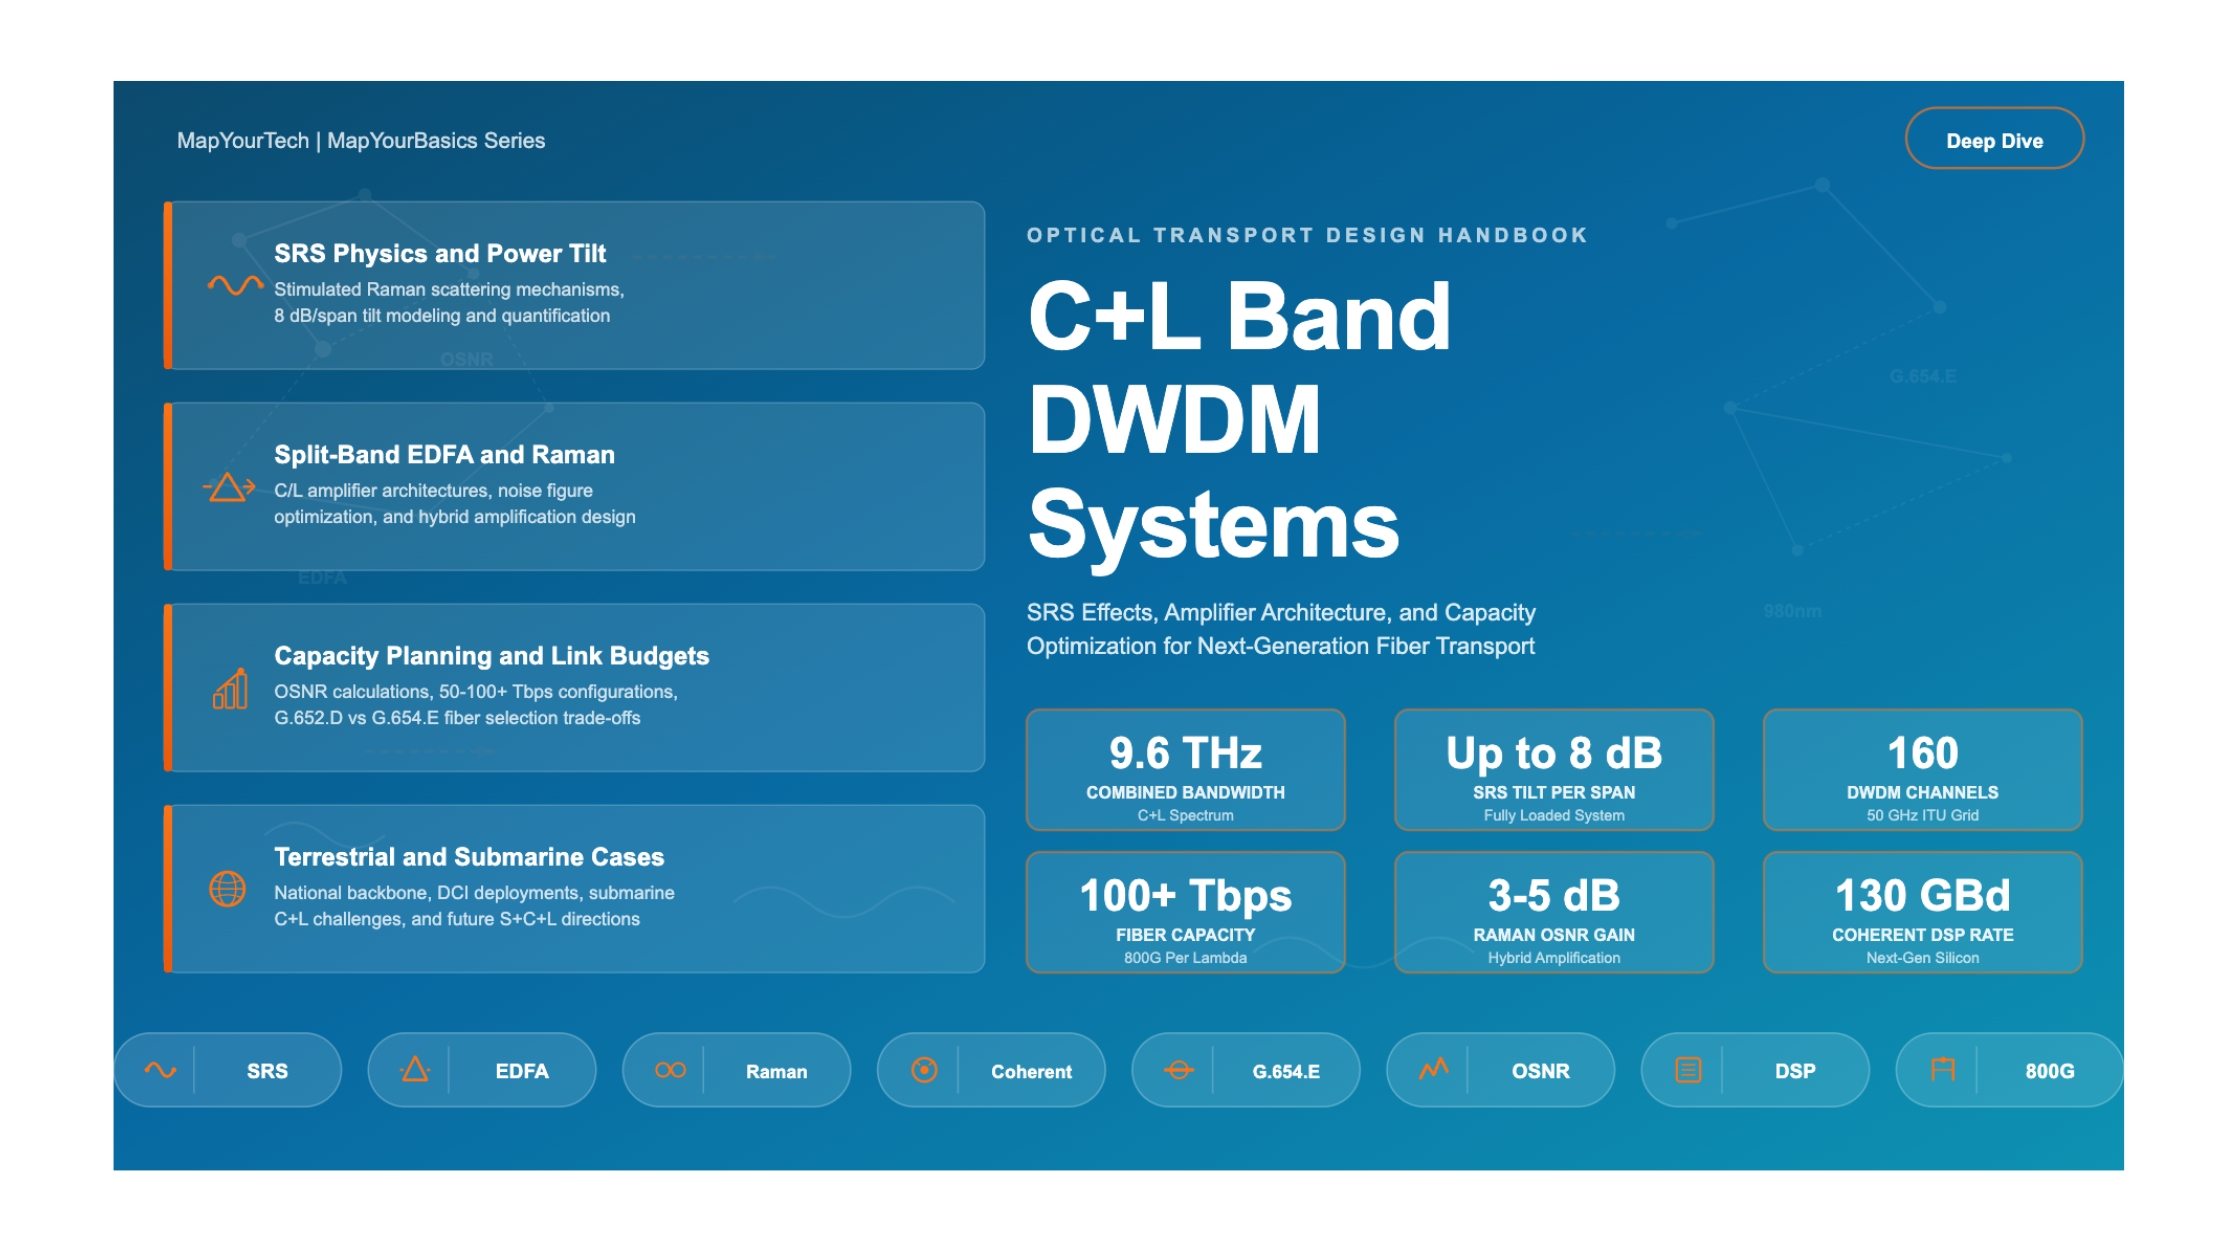
C+L Band DWDM Systems: Design Challenges, SRS Effects, and Capacity Optimization
C+L Band DWDM Systems: Design Challenges, SRS Effects, and Capacity Optimization
A comprehensive engineering guide to designing, deploying, and optimizing C+L band Dense Wavelength Division Multiplexing systems for next-generation fiber capacity beyond 50 Tbps
1. Introduction
The exponential growth of global data traffic, driven by cloud computing, artificial intelligence training and inference workloads, 5G backhaul, and video streaming, continues to place enormous pressure on optical transport networks. AI-driven data center interconnect (DCI) demand has become the primary growth driver for DWDM equipment, with annual global IP traffic now exceeding 5 zettabytes and showing no signs of slowing. Network operators face a critical challenge: how to extract maximum capacity from existing fiber infrastructure without the prohibitive cost of deploying new fiber routes.
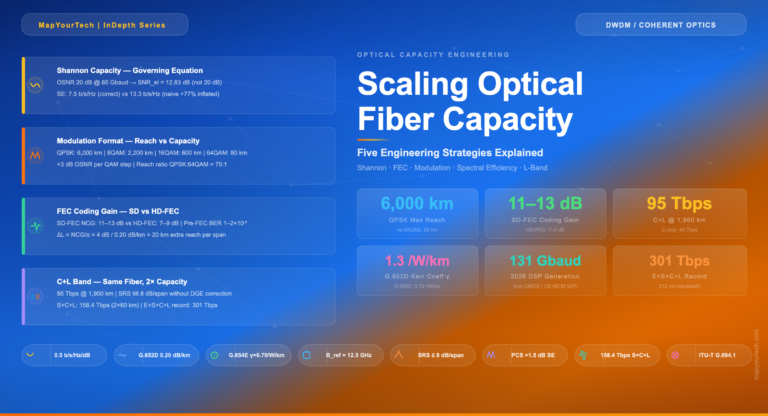
For decades, the C-band (Conventional band, 1530-1565 nm) has served as the workhorse of Dense Wavelength Division Multiplexing (DWDM) systems. Its position at the lowest-attenuation point of silica fiber, combined with the mature ecosystem of Erbium-Doped Fiber Amplifiers (EDFAs), has made it the natural first choice for optical transport. A fully loaded C-band system supports 80 channels at 50 GHz spacing. Using PM-QPSK modulation at 33 GBaud, each channel delivers 132 Gbps, for a C-band total of approximately 10.56 Tbps. With higher-order modulation and modern coherent DSP, C-band capacities reach 24 Tbps (16-QAM) to 36 Tbps (64-QAM). Sixth-generation coherent DSP technology operating at 130-200 GBaud now enables single-wavelength rates of 800G to 1.6 Tbps in commercial deployments.
Yet even these impressive figures are becoming insufficient. The answer to this capacity demand lies in expanding the usable optical spectrum beyond the C-band into the L-band (Long-wavelength band, 1565-1625 nm). Together, the C+L band provides approximately 9.6 THz of usable optical bandwidth, effectively doubling the spectral resources available for DWDM transmission. By adding another 80 channels in the L-band at 50 GHz spacing, operators can double the channel count to 160 and double the total capacity. C+L band systems achieve 24 Tbps with QPSK (4,800 km reach), 48 Tbps with 16-QAM (700 km reach), and up to 72 Tbps with 64-QAM (60 km reach). With modern coherent DSP pushing per-wavelength rates to 800G and beyond, these capacities continue to grow as the technology matures.
However, C+L band operation is far from a simple matter of "turning on" additional wavelengths. The simultaneous transmission of signals across this broad 95 nm spectral window introduces a complex set of design challenges that must be carefully addressed. The most significant of these is Stimulated Raman Scattering (SRS), a nonlinear optical effect that transfers energy from shorter-wavelength C-band channels to longer-wavelength L-band channels, creating a power tilt of up to 8 dB per fiber span. This article provides a comprehensive engineering analysis of C+L band system design, covering the physics of SRS, amplifier architectures, link budget methodologies, transient management strategies, and practical deployment considerations for both terrestrial and submarine applications.
"C+L band technology has become one of the most actively discussed topics among data center interconnect (DCI) operators, service providers, and network architects evaluating Managed Optical Fiber Network (MOFN) service models and next-generation transport architectures. Whether the conversation is about scaling an existing backbone, planning a new DCI corridor, or evaluating open line system options, C+L band invariably comes up as a critical design decision point. Based on our experience working across these discussions, we have curated this article as a practical knowledge handbook — a single reference that network architects can use when designing C+L band systems, validating vendor proposals, or preparing technical discussion points for design reviews. The goal is to equip engineers with the right questions to ask, the right parameters to verify, and a solid understanding of the trade-offs involved, so they can approach C+L band deployments with confidence rather than relying solely on vendor claims."
— MapYourTech
2. C-Band and L-Band Fundamentals
2.1 Spectral Definitions and ITU Grid
The International Telecommunication Union (ITU) defines the optical communication bands based on wavelength ranges within the low-loss window of silica fiber. The C-band and L-band occupy adjacent portions of this window, positioned at or near the global attenuation minimum around 1550 nm.
Table 1: ITU-T Optical Band Definitions for DWDM Systems
Parameter
C-Band
L-Band
Combined C+L
Wavelength Range
1530 - 1565 nm
1565 - 1625 nm
1530 - 1625 nm
Frequency Range
191.56 - 195.94 THz
184.49 - 191.56 THz
184.49 - 195.94 THz
Bandwidth
~4.8 THz (Extended C)
~4.8 THz
~9.6 THz
Channels (50 GHz)
~80
~80
~160
Channels (75 GHz)
~64
~64
~128
Channels (100 GHz)
~48
~48
~96
Channels (150 GHz)
~32
~32
~64
Channels (200 GHz)
~24
~24
~48
Typical Fiber Loss
0.19-0.20 dB/km
0.20-0.23 dB/km
0.19-0.23 dB/km
Chromatic Dispersion (SMF)
16-18 ps/nm/km
18-22 ps/nm/km
16-22 ps/nm/km
EDFA Noise Figure
4.5-5.5 dB
5.0-6.5 dB
4.5-6.5 dB
2.2 Physical Properties Comparison
Understanding the fundamental differences between C-band and L-band propagation is critical for system design. While both bands sit within the low-loss window of silica fiber, several key parameters shift meaningfully across the ~95 nm combined spectral width.
Fiber Attenuation: Standard single-mode fiber (G.652.D) exhibits slightly higher attenuation in the L-band compared to the C-band. At 1550 nm (center of C-band), typical loss is 0.19-0.20 dB/km, while at 1590 nm (center of L-band), it increases to approximately 0.21-0.22 dB/km. Modern ultra-low-loss fibers such as G.654.E can reduce these values to 0.16 dB/km and 0.18 dB/km respectively. Over an 80 km span, this 0.02 dB/km difference translates to an additional 1.6 dB of loss for L-band channels, a meaningful penalty that must be accounted for in link budget calculations.
Chromatic Dispersion: Both bands experience positive chromatic dispersion on standard SMF, but the dispersion coefficient is higher in the L-band (approximately 20 ps/nm/km at 1590 nm versus 17 ps/nm/km at 1550 nm). For modern coherent systems with DSP-based dispersion compensation, this higher dispersion actually provides a benefit: it more rapidly de-correlates WDM channels during propagation, which reduces the efficiency of inter-channel nonlinear interactions such as Four-Wave Mixing (FWM) and Cross-Phase Modulation (XPM).
Nonlinear Effects: The effective area of standard SMF increases slightly at longer wavelengths, and the nonlinear refractive index decreases. Combined with the higher local dispersion, L-band channels generally experience lower nonlinear penalties from Kerr-effect-based impairments (SPM, XPM, FWM) compared to C-band channels at equivalent launch powers. This is an important advantage that partially offsets the L-band's higher loss and noise figure.
2.3 Why L-Band as the Second Choice
The L-band's position as the "second band" after C-band is driven by several technical and economic factors. First, the C-band sits at the global attenuation minimum and benefits from the most mature and cost-effective EDFA technology. Second, L-band EDFAs require longer erbium-doped fiber lengths and operate at a different average inversion level than their C-band counterparts, making them inherently more expensive and slightly less power-efficient. Third, the component ecosystem for L-band, including multiplexers, demultiplexers, and transceivers, has historically been less mature and more expensive than C-band equivalents.
Despite these challenges, the technical case for L-band expansion is strong. Adding L-band capability to an existing C-band system effectively doubles the available spectrum without requiring new fiber deployment. Since the fiber itself and its associated civil infrastructure (ducts, conduit, rights-of-way) represent the largest portion of network build cost, using the same fiber for twice the capacity is a far more efficient path to capacity expansion than deploying new routes.
Industry Trend: Major equipment vendors have accelerated C+L band platform availability. Ciena's WaveLogic 6 Extreme (WL6e) achieves commercial 1.6 Tbps single-carrier transmission on 3nm DSP technology operating at 200 GBaud. Nokia's PSE-6s engine operates at 130 GBaud on 5nm process with CSTAR silicon photonics, delivering up to 1.2 Tbps per wavelength (single DSP) or 2.4 Tbps per line card (dual DSP with chip-to-chip interface). Ribbon Communications offers Apollo modular C+L band with patented Fast SRS Suppression technology, enabling operators to seamlessly expand to L-band without service interruption. Real-world deployments include Sparkle's 38.4 Tbps per fiber pair across 12,465 km of European routes using Infinera and Nokia C+L technology. Ciena's WL6e has powered first-ever 1.6 Tbps records across AT&T's long-haul network (Newark to Philadelphia, 296 km), Telstra's 736 km Australian route, and euNetworks' first 1.6 Tbps wavelength in Europe (Amsterdam to Dusseldorf, 281 km).
3. Stimulated Raman Scattering: The Physics
3.1 Raman Scattering Fundamentals
Stimulated Raman Scattering (SRS) is the dominant nonlinear effect that distinguishes C+L band system design from single-band systems. SRS is an inelastic scattering process in which photons interact with the molecular vibrations (optical phonons) of the silica glass matrix in the fiber. When a high-energy photon (pump) interacts with a molecular vibration, it transfers a portion of its energy to the vibrational mode, producing a lower-energy photon (Stokes wave) at a longer wavelength. The frequency difference between the pump and Stokes photons corresponds to the vibrational frequency of the silica molecule, typically peaking at a frequency offset of approximately 13.2 THz.
In a DWDM context, every shorter-wavelength channel acts as a Raman "pump" for every longer-wavelength channel within the Raman gain bandwidth (~15 THz in silica). In C-band-only systems, SRS effects are relatively modest because the spectral width is only about 4.4 THz, well within the linear portion of the Raman gain profile. However, when both C-band and L-band are loaded, the frequency separation between the shortest C-band channel (~1530 nm, ~195.9 THz) and the longest L-band channel (~1625 nm, ~184.5 THz) spans approximately 11.4 THz. This wide spectral separation falls close to the peak of the Raman gain spectrum, resulting in very efficient energy transfer from C-band to L-band channels.
3.2 SRS Mechanism in C+L Band Systems
The SRS process in C+L band systems operates as follows. As all channels co-propagate through the fiber, C-band channels continuously transfer energy to L-band channels through the Raman interaction. This transfer is cumulative along the fiber length (within the effective length) and results in a characteristic spectral tilt: C-band channels lose power while L-band channels gain power. The resulting power profile at the output of a fiber span shows a nearly linear tilt (in dB) across the combined C+L spectrum.
The severity of this tilt depends on several factors: the total optical power launched into the fiber, the number and distribution of channels across the spectrum, the fiber effective area, the fiber effective length, and the total bandwidth occupied by the signals. For a typical fully loaded C+L band system with 160 channels at 50 GHz spacing (80 per band) and a total launch power of +20 to +23 dBm, the SRS-induced tilt can reach 6 to 8 dB per 80 km span.
Continue Reading This Article
Sign in with a free account to unlock the full article and access the complete MapYourTech knowledge base.
The Raman gain in silica fiber is characterized by the Raman gain coefficient gR, which has a broad spectral profile peaking at a frequency offset of approximately 13.2 THz from the pump wavelength. For standard SMF at 1550 nm, the peak Raman gain coefficient is approximately 1 x 10-13 m/W. The gain coefficient scales inversely with the fiber effective area (Aeff), so large-effective-area fibers (such as G.654.E with Aeff > 110 um2) exhibit lower Raman interaction strength per unit power.
Where: β = Raman tilt proportionality coefficient, approximately 4.24 x 10⁻⁵ (mW km THz)-1 for Aeff = 55 um2 Ptot,in = Total optical power at fiber input (mW) Leff = Effective fiber length = (1 - e-αL) / α BW = Total signal bandwidth (THz) α = Fiber attenuation coefficient (Neper/km)
Worked Example: Consider a 75 km span of fiber with an effective area of 110 um2 and attenuation of 0.155 dB/km. The effective length is approximately 26.1 km. For a C+L band signal spanning 9.6 THz with +20 dBm total input power (100 mW), the SRS tilt coefficient scales inversely with effective area. For Aeff = 110 um2, β = approximately 2.12 x 10⁻⁵ (mW km THz)-1. The resulting tilt = 4.343 x 2.12 x 10-5 x 100 x 26.1 x 9.6 = approximately 2.3 dB. At a more typical total launch power of +23 dBm (200 mW), the tilt doubles to approximately 4.6 dB. For lower effective area fibers like standard G.652 (Aeff = 80 um2), the tilt increases proportionally, potentially reaching 6-8 dB per span.
3.4 Loading Dependency and Transient Effects
The SRS tilt is directly proportional to the total optical power in the fiber, which means it depends on the number of active channels and their power levels. This creates a dynamic challenge: when channels are added or removed from the system, the SRS tilt changes, causing transient power fluctuations across all remaining channels. A single channel addition or removal can shift the power balance between bands, and the amplifier control loops must respond quickly to maintain stable operation.
In extreme scenarios, such as a fiber cut that drops all channels on one path of a protection scheme, the SRS tilt can change by several dB in milliseconds. If the amplifiers' gain and tilt control loops are not fast enough, this can cause temporary OSNR degradation and potentially bit errors on surviving channels. Managing these transients is one of the key operational challenges in C+L band networks, addressed through orchestrated traffic management and fast amplifier control algorithms.
Key Takeaways: SRS Physics
SRS transfers energy from shorter (C-band) to longer (L-band) wavelengths, creating a power tilt of up to 8 dB per span in fully loaded C+L systems
The tilt magnitude is proportional to total power, effective length, and occupied bandwidth -- making it inherently load-dependent
Large effective area fibers (G.654.E) reduce SRS tilt by lowering the power density in the fiber core
Dynamic traffic changes cause SRS transients that require fast amplifier response and orchestrated channel management
The SRS tilt is well-approximated as linear (in dB) across the spectrum, simplifying compensation strategies
4. SRS Power Tilt: Quantitative Analysis and Modeling
4.1 Channel-by-Channel Power Evolution
To understand SRS impact at the system level, it is useful to examine the power evolution of individual channels. In a fully loaded C+L system with N channels uniformly distributed across both bands, the power of the i-th channel at the end of a fiber span of length L can be expressed relative to its input power using the Raman coupling equations. For practical system design, a simplified closed-form model captures the essential behavior.
The power tilt across the entire C+L spectrum can be modeled as a linear function of frequency (in dB), where the channel at the spectral center experiences approximately zero net Raman exchange, channels at the short-wavelength edge (C-band) lose power, and channels at the long-wavelength edge (L-band) gain power. The tilt per channel pair is proportional to their frequency separation, the total system power, and the fiber Raman efficiency.
Channel Power at Span Output (Simplified Raman Model)
Pi,out(dBm) =Pi,in(dBm) -α.L+ΔPSRS,i
Where the SRS contribution for channel i:
ΔPSRS,i=Tilttotalx (fi-fcenter) / BWtotal-- Channels above center frequency: negative (power loss)-- Channels below center frequency: positive (power gain)
Pi,in = Input power of channel i (dBm) α = Fiber attenuation (dB/km) at channel i wavelength L = Span length (km) ΔPSRS,i = SRS power change for channel i (dB) fi = Frequency of channel i (THz) fcenter = Center frequency of the C+L spectrum BWtotal = Total occupied bandwidth (THz)
4.2 Multi-Span Tilt Accumulation
In a multi-span link with inline amplifiers, the SRS tilt accumulates differently depending on the amplifier tilt compensation strategy. If amplifiers fully compensate the tilt at each span boundary (the ideal case), then the tilt experienced by each channel within any given span remains bounded. However, if tilt compensation is imperfect, residual tilt accumulates span by span, leading to progressively larger power excursions across the spectrum.
For a submarine system with 130 amplifiers spanning approximately 6,500 km (50 km spans), even a small residual tilt error of 0.1 dB per amplifier can accumulate to 13 dB, completely overwhelming the system margin. This highlights why tilt control precision is a critical design parameter for C+L band systems, especially in long-haul and submarine applications.
SRS Tilt vs. Total Launch Power for Different Fiber Types
4.3 Impact on OSNR and System Margin
The SRS tilt has asymmetric effects on the C-band and L-band channels. C-band channels lose power to the SRS process, which directly reduces their received power and degrades their OSNR. For the shortest-wavelength C-band channel, the OSNR penalty can be 3-4 dB relative to a C-band-only system at the same launch power. L-band channels gain power from SRS, which improves their received power but can also push them closer to the nonlinear threshold if the amplifier design does not properly manage the excess power.
The net effect on system capacity depends on the balance between these competing factors. Effective tilt compensation through the amplifier chain can largely restore the flat power profile, but the ASE noise contribution from higher-gain amplifier stages (needed for tilt compensation) introduces its own OSNR penalty. In practice, well-designed C+L band systems incur approximately 1-2 dB of OSNR penalty for L-band channels relative to C-band channels operating alone, primarily due to the higher EDFA noise figure in the L-band and the insertion loss of the C/L band splitter.
5. Amplifier Design for C+L Band Systems
5.1 Split-Band Architecture
In C+L band systems, the C-band and L-band cannot be amplified simultaneously in the same erbium-doped fiber. This is because the optimal average inversion level for C-band amplification (approximately 0.7) differs significantly from the L-band optimum (approximately 0.4). Operating at a compromise inversion level would result in poor gain flatness and high noise figures for both bands.
The standard C+L amplifier architecture therefore uses a split-band approach: the incoming C+L signal is separated by a C/L band splitter (a wavelength-selective device, typically contributing approximately 0.5 dB of insertion loss), amplified in separate C-band and L-band EDFAs, and then recombined by a C/L band combiner. Each EDFA is independently optimized for its respective band in terms of erbium-doped fiber length, pump wavelength, and gain flattening filter design.
5.2 EDFA Design Differences: C-Band vs. L-Band
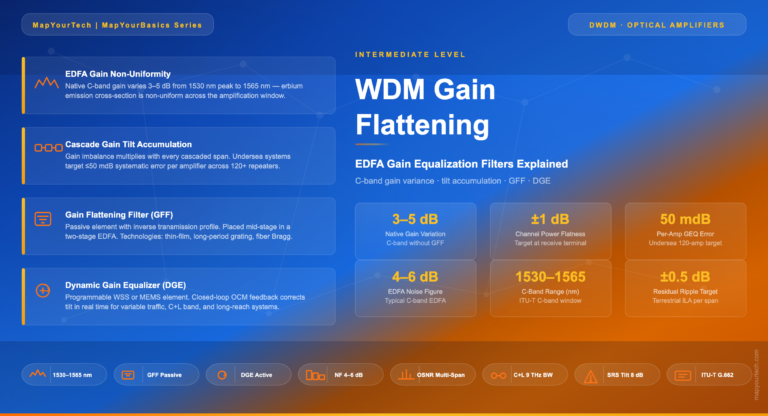
The fundamental reason for the split-band architecture is visible in the EDFA gain spectrum itself. As shown in Figure 4, erbium-doped fiber produces two distinct gain regions separated by a deep gain dip around 1565-1570 nm. The conventional C-band (1530-1565 nm) and the long-wavelength L-band (1570-1610 nm) each provide approximately 4.5 THz of usable optical bandwidth, but the gain dip between them makes it impossible to achieve flat amplification across both bands simultaneously in a single EDF stage. This is the physical basis for the split-band EDFA architecture.
The C-band and L-band EDFAs differ in several important design aspects. C-band EDFAs operate at a higher average inversion level (0.6-0.7), which produces a gain spectrum spanning 1530-1565 nm with a characteristic peak near 1532 nm that must be flattened by a Gain Flattening Filter (GFF). They typically achieve noise figures of 4.5-5.5 dB with standard 980 nm forward-pumping configurations.
L-band EDFAs operate at a lower average inversion level (0.3-0.4) and require significantly longer erbium-doped fiber lengths (often 2-3 times longer than C-band EDFAs) to achieve the required gain. This is because the emission cross-section in the L-band is smaller than in the C-band, necessitating more doped fiber to accumulate the same total gain. The longer fiber length, combined with the lower inversion level, results in noise figures that are typically 0.5-1.0 dB higher than C-band EDFAs (approximately 5.0-6.5 dB). Additionally, L-band EDFAs exhibit more temperature sensitivity in their gain profile, which requires more sophisticated gain equalization and temperature compensation mechanisms.
5.3 Raman Amplification for C+L Systems
Raman amplifiers play a critical complementary role in C+L band systems. Unlike EDFAs, which provide lumped amplification at discrete sites, Raman amplifiers provide distributed gain throughout the transmission fiber itself. This distributed gain characteristic offers two key advantages for C+L systems.
First, distributed Raman amplification improves the OSNR by amplifying the signal before it is significantly attenuated, effectively reducing the noise figure of the amplification chain. A backward-pumped Raman pre-amplifier can achieve effective noise figures of 0 dB or even negative values (in the distributed sense), providing a 3-5 dB improvement in OSNR compared to EDFA-only amplification.
Second, by selecting appropriate Raman pump wavelengths and powers, the Raman gain profile can be shaped to partially compensate for the SRS tilt. This is because the Raman gain itself is wavelength-dependent and can be designed to provide more gain to the shorter-wavelength (C-band) channels that suffer from SRS depletion. However, this tilt-compensating Raman design requires careful optimization, as the Raman pump wavelengths that provide gain in the C-band may also interact with L-band signals through their own SRS process.
Table 2: Amplifier Technology Comparison for C+L Band Systems
Parameter
C-Band EDFA
L-Band EDFA
Raman (Distributed)
Hybrid Raman+EDFA
Noise Figure
4.5-5.5 dB
5.0-6.5 dB
0 to -3 dB (eff.)
3.0-4.5 dB (eff.)
Typical Gain
20-28 dB
22-30 dB
10-15 dB
25-35 dB
Pump Power
200-800 mW
300-1000 mW
500 mW - 2 W
Combined
Tilt Correction
GFF + VOA
GFF + VOA
Pump shaping
Both methods
OSNR Improvement
Baseline
-0.5 to -1.0 dB
+3 to +5 dB
+3 to +5 dB
Best Application
Metro, Regional
Metro, Regional
Long-haul, Submarine
Ultra-long-haul
6. Fiber Selection and Nonlinear Impairment Management
6.1 Fiber Types for C+L Band Systems
The choice of fiber has a profound impact on C+L band system performance. The key fiber parameters affecting system design are attenuation, effective area, chromatic dispersion, and the dispersion slope.
G.652.D (Standard SMF): The most widely deployed fiber type. With a typical effective area of 80 um2, attenuation of 0.19-0.20 dB/km, and chromatic dispersion of 17 ps/nm/km at 1550 nm, standard SMF is suitable for C+L band systems but produces relatively high SRS tilt due to its moderate effective area. The low water peak specification ensures consistent performance across the E-band region between C and L bands.
G.654.E (Ultra-Low-Loss, Large Effective Area): This fiber type represents the state-of-the-art for new C+L band deployments. With effective areas exceeding 110 um2 and attenuation as low as 0.16 dB/km, G.654.E fiber significantly reduces both SRS tilt (by approximately 30-40% relative to G.652.D) and total span loss. The reduced loss allows for longer spans or higher OSNR at the amplifier input, while the larger effective area reduces all nonlinear interactions including SRS, SPM, XPM, and FWM.
Table 3: Fiber Type Comparison for C+L Band DWDM
Fiber Type
Aeff (um2)
Loss (dB/km)
CD at 1550nm
SRS Tilt (relative)
Best Use Case
G.652.D (SMF)
80
0.19-0.20
17 ps/nm/km
1.0x (baseline)
Existing networks
G.654.E (ULL/LA)
110-150
0.16-0.17
20-22 ps/nm/km
0.55-0.73x
New long-haul builds
G.655 (NZDSF)
55-72
0.20-0.22
4-8 ps/nm/km
1.1-1.45x
Legacy networks
Submarine (custom)
110
0.15-0.16
20+ ps/nm/km
0.73x
Submarine cables
6.2 Managing Kerr Nonlinearities in C+L Band
While SRS is the dominant new impairment in C+L systems, the Kerr nonlinear effects (SPM, XPM, FWM) remain important and their management changes in a combined-band context. The optimal per-channel launch power in a C+L system must account for the increased total power (which drives SRS) while maintaining adequate OSNR.
The optimal launch power per channel for a C+L system is typically 1-2 dB lower than for a C-band-only system, to reduce SRS tilt while keeping the OSNR above the modulation format's threshold. For QPSK modulation requiring approximately 13-15 dB OSNR, and 16-QAM requiring 21-23 dB, this launch power reduction translates to a modest reach penalty of 10-20% for C+L systems relative to C-band-only operation at the same modulation format.
Design Rule of Thumb: For C+L band systems on G.652.D fiber with 80 km spans, the typical per-channel launch power is -2 to 0 dBm (compared to -1 to +1 dBm for C-band only). On G.654.E fiber, per-channel launch powers of -1 to +1 dBm are feasible thanks to the larger effective area and lower SRS tilt.
7. Traffic Orchestration and Transient Management
7.1 The Transient Challenge
The load-dependent nature of SRS tilt creates a significant operational challenge: any change in the number of active channels on the fiber changes the SRS tilt, which in turn affects the power and OSNR of all remaining channels. In a static, fully loaded system, the tilt is predictable and can be compensated by fixed amplifier settings. In a dynamic network with ongoing channel additions and removals, the tilt changes continuously.
Consider a C+L band system with 160 channels (80 per band), with a total launch power of +20 dBm. If 48 L-band channels are simultaneously added (for example, activating a new traffic group), the SRS tilt increases by approximately 2 dB, causing existing C-band channels to lose approximately 1 dB of power within milliseconds. If the amplifier control loops take 100 ms to respond, this transient can cause temporary BER degradation on affected channels.
7.2 Orchestrated Channel Turn-Up/Turn-Down
To manage SRS transients, C+L band systems implement orchestrated traffic management. Rather than allowing channels to be added or removed at arbitrary times and in arbitrary order, the system coordinates channel changes through an automation layer that controls the sequence and timing of turn-up and turn-down operations. Key strategies include controlled ramp-up of new channels, gradual power increases rather than instant activation, coordinated add/drop across both bands to maintain power balance, pre-compensation of amplifier tilt settings before channel activation, and real-time monitoring with fast feedback loops (sub-millisecond response times for critical transients).
7.3 Amplifier Control Requirements
The amplifier control system for C+L band operation must provide fast gain and tilt adjustment, per-channel power monitoring, automatic tilt tracking, and coordinated inter-band control. Modern C+L line systems achieve tilt correction response times of less than 10 ms for small perturbations and less than 100 ms for large traffic changes (e.g., protection switching events). The tilt correction range must cover the full SRS tilt variation from empty to fully loaded conditions, typically requiring ±4 to ±6 dB of adjustable tilt per amplifier site.
8. Capacity Planning and Link Budget Calculations
8.1 C+L Band Capacity Examples
The capacity achievable on a C+L band system depends on the channel count, modulation format, baud rate, and FEC overhead. The following table provides representative capacity calculations for common deployment configurations.
Table 4: C+L Band System Capacity for Various Configurations
Configuration
Channels
Modulation
Baud Rate
Per-Channel Rate
Total Capacity
Typical Reach
C+L, 50 GHz, 100G
160
DP-QPSK
33 GBaud
132 Gbps
21.1 Tbps
3,000+ km
C+L, 50 GHz, 200G
160
DP-16QAM
33 GBaud
264 Gbps
42.2 Tbps
800-1,500 km
C+L, 75 GHz, 400G
128
DP-16QAM
64 GBaud
400 Gbps
51.2 Tbps
500-1,000 km
C+L, 150 GHz, 800G
64
DP-16QAM+PCS
130 GBaud
800 Gbps
51.2 Tbps
300-600 km
C+L, 75 GHz, 400G
128
DP-QPSK
64 GBaud
400 Gbps
51.2 Tbps
2,000+ km
C+L, 150 GHz, 1.2T
64
DP-16QAM+PCS
138 GBaud
1.2 Tbps
76.8 Tbps
300-800 km
C+L, 225 GHz, 1.6T
42
DP-64QAM+PCS
200 GBaud
1.6 Tbps
67.2 Tbps
Metro/DCI (<500 km)
8.2 Link Budget Methodology
A C+L band link budget must account for several additional factors compared to a C-band-only budget. The fundamental OSNR equation for a cascaded amplifier chain remains the starting point, but the following C+L-specific adjustments must be included.
8.2.1 Derivation in Linear Domain
The OSNR derivation starts from the physical noise generated by a single optical amplifier. An EDFA generates Amplified Spontaneous Emission (ASE) noise with a spectral power density given by:
Step 1: ASE Noise Power from a Single Amplifier
PASE=NFxGxhxvxBref(watts, linear)
NF = Noise figure of the amplifier (linear ratio, not dB) G = Amplifier gain (linear ratio) h = Planck's constant = 6.626 x 10⁻³⁴ J.s v = Optical frequency (Hz), approximately 193.4 THz at 1550 nm Bref = Reference noise bandwidth = 12.5 GHz (equivalent to 0.1 nm at 1550 nm)
The OSNR at the output of a single amplifier is the ratio of the signal power to the ASE noise power within the reference bandwidth. In a system where the amplifier gain exactly compensates the span loss (G = Lspan), the signal power at the amplifier output equals the channel launch power Pch. Therefore:
Since G = Lspan (gain compensates loss), the signal input to each amplifier is Pch/Lspan, and the output is Pch.
Substituting G = Lspan:
OSNR1 span = Pch / (NF x Lspan x h x v x Bref)
For a cascade of N identical amplifiers, each contributing independent ASE noise, the total noise power adds linearly. The signal power remains Pch (each amplifier restores it), but the noise accumulates:
This is the fundamental linear OSNR equation for a chain of identical amplified spans.
All quantities are in linear (watts, ratios) — not dB.
8.2.2 Conversion to dB Domain
Now we convert each term to dB by taking 10.log10 of the linear OSNR expression:
Step 4: Apply 10.log10 to Both Sides
OSNRdB= 10.log10(Pch) - 10.log10(N) - 10.log10(NF) - 10.log10(Lspan) - 10.log10(h.v.Bref)
-- Now identify each term:-- 10.log10(P_ch) in watts = P_ch,dBm - 30 (converting W to mW: dBm = dBW + 30)-- BUT if P_ch is already in mW, then 10.log10(P_ch_mW) = P_ch,dBm-- 10.log10(NF) = NF_dB-- 10.log10(L_span) = L_span,dB-- 10.log10(N) = 10.log10(N_spans)-- 10.log10(h.v.B_ref) = a constant we must evaluate
The key constant term requires evaluating h.v.Bref:
Step 5: Evaluate the Constant 10.log10(h.v.Bref)
h= 6.626 x 10⁻³⁴ J.s
v= 193.4 x 10¹² Hz (at 1550 nm)Bref= 12.5 x 10⁹ Hz (0.1 nm at 1550 nm)h.v.Bref= 6.626 x 10-34x 193.4 x 1012x 12.5 x 109= 6.626 x 193.4 x 12.5 x 10(-34+12+9)= 16,005.95 x 10-13= 1.6006 x 10⁻⁹ mW (converting W to mW: multiply by 103)= 1.6006 x 10⁻⁶ mW ... wait, let us redo carefully:-- In watts:h.v.Bref= 6.626e-34 x 1.934e14 x 1.25e10
= 6.626 x 1.934 x 1.25 x 10(-34+14+10)= 16.006 x 10⁻¹⁰ W
= 1.6006 x 10⁻⁹ W
-- Convert to dBm (dBm = 10.log10(P_mW) where P_mW = P_W x 10^3):h.v.Bref= 1.6006 x 10⁻⁶ mW
10.log10(1.6006 x 10⁻⁶) = 10 x [log10(1.6006) + log10(10-6)]
= 10 x [0.2042 + (-6)]
= 10 x (-5.7958)
=-57.96 dBm≈-58 dBm
Therefore: -10.log10(h.v.Bref) = +58 dBm
This is the origin of the "58" constant. It represents the inverse of the quantum noise floor (h.v.Bref) expressed in dBm at 1550 nm with 0.1 nm reference bandwidth.
Substituting all terms back into the dB equation:
Step 6: Final OSNR Formula in dB (Standard C-Band)
OSNRdB, 0.1nm=58+Pch,out(dBm) -NF(dB) -Lspan(dB) -10.log10(N)-- This is the classical "58+ formula" for OSNR in cascaded amplifier chains.-- It assumes: identical spans, G = L_span, same NF at each amplifier.
8.2.3 C+L Band Extensions
For C+L band systems, two additional penalty terms must be added to account for impairments that do not exist in single-band systems:
Step 7: OSNR for Multi-Span C+L System (Per Channel) — Final
━━━ LINEAR DOMAIN ━━━From Step 3, the baseline OSNR for N identical spans is:OSNRlinear=Pch / (NxNFxLspanxhxvxBref)
For C+L band, two additional loss mechanisms reduce the signal
power at each amplifier input:(a) C/L band splitter insertion loss (L_splitter ≈ 1.122, i.e. 0.5 dB)
— sits before the EDFA at each node, attenuates signal,
ASE noise from EDFA is unchanged → OSNR degrades.(b) SRS depletion factor (L_SRS,i for channel i)
— C-band channels lose power to L-band via Raman scattering,
so signal arriving at the amplifier input is weaker than
L_span alone predicts → OSNR degrades.
— L-band channels gain SRS power, but tilt correction (VOA/GFF)
attenuates the excess, and inter-band noise transfer adds penalty.Including both factors, the effective span loss seen by the signal becomes:Leff,i=LspanxLsplitterxLSRS,iThe C+L OSNR in linear domain therefore becomes:
┌─────────────────────────────────────────────────────────────────┐
│ │
│ OSNRch,i=Pch │
│ ───────────────────────────────────────────────────── │
│ NxNFbandxLspanxLsplitterxLSRS,ixh.v.Bref │
│ │
│ All quantities in linear (watts, ratios) │
│ │
└─────────────────────────────────────────────────────────────────┘
━━━ dB DOMAIN ━━━Taking 10.log₁₀ of the linear expression above:OSNRdB= 10.log10(Pch) - 10.log10(N) - 10.log10(NFband) - 10.log10(Lspan)
- 10.log10(Lsplitter) - 10.log10(LSRS,i) - 10.log10(h.v.Bref)
Substituting: 10.log₁₀(P_ch) = P_ch,out (dBm) -10.log₁₀(h.v.B_ref) = +58 (as derived in Step 5) 10.log₁₀(NF_band) = NF_band (dB) 10.log₁₀(L_span) = L_span (dB) 10.log₁₀(L_splitter) = ΔOSNR_splitter (dB) 10.log₁₀(L_SRS,i) = ΔOSNR_SRS (dB)
┌─────────────────────────────────────────────────────────────────┐
│ │
│ OSNRch=58+Pch,out-NFband-Lspan- 10.log10(N) │
│ -ΔOSNRSRS-ΔOSNRsplitter │
│ │
│ All values in dB/dBm, referenced to 0.1 nm bandwidth │
│ │
└─────────────────────────────────────────────────────────────────┘
Pch,out = Per-channel output power from amplifier (dBm) NFband = Noise figure for the relevant band (dB) — C-band: ~5 dB, L-band: ~6 dB Lspan = Span loss (dB) — includes fiber loss + connector/splice loss N = Number of amplified spans ΔOSNRSRS = 10.log10(LSRS,i) — SRS-induced OSNR penalty for channel i (0 to 3 dB; worst for shortest C-band wavelengths where SRS depletes signal power before amplification) ΔOSNRsplitter = 10.log10(Lsplitter) — C/L band splitter insertion loss (~0.5 dB; signal attenuated before EDFA, ASE unchanged) 58 = -10.log10(h.v.Bref) in dBm at 1550 nm, 0.1 nm bandwidth (as derived in Step 5)
Physical justification of C+L penalty terms:
Both ΔOSNRSRS and ΔOSNRsplitter originate from the same mechanism: they reduce the signal power at the amplifier input without reducing the ASE noise generated by the EDFA. In the linear domain, they appear as multiplicative loss factors (Lsplitter, LSRS,i) in the denominator. In the dB domain, multiplication becomes addition, so they subtract from the OSNR.
8.2.4 Worked Example: 6,400 km Submarine C+L Link
Applying the formula to a trans-oceanic C+L link:
Worked Example: Trans-Oceanic C+L OSNR Calculation
-- Given:Cable length= 6,400 km
Span length= 80 km
Nspans= 6,400 / 80 = 80 amplifiersFiber loss= 0.15 dB/km
Lspan= 0.15 x 80 = 12 dBTOP (total output) = +18 dBm
Channels= 100
Pch,out= 18 - 10.log10(100) = 18 - 20 = -2 dBmNF= 4.5 dB
10.log10(80)= 19.0 dB
-- C-band only OSNR (no SRS or splitter penalty):OSNR= 58 + (-2) - 4.5 - 12 - 19
= 58 - 2 - 4.5 - 12 - 19
=20.5 dB (per 0.1 nm)
-- With C+L band penalties (L-band worst case):NFL-band= 6.0 dB (instead of 4.5)ΔOSNRSRS= 1.5 dB (L-band channels gain power but C-band loses)ΔOSNRsplitter= 0.5 dB (C/L splitter insertion loss)OSNRL-band= 58 + (-2) - 6.0 - 12 - 19 - 1.5 - 0.5
=17.0 dB(3.5 dB worse than C-band only)-- This 17.0 dB is sufficient for DP-QPSK (requires ~13-15 dB)-- but marginal for DP-16QAM (requires ~21-23 dB)
9. Real-World Deployment Case Studies
9.1 Terrestrial Long-Haul: National Backbone Upgrade
Scenario: A national carrier operates a 2,400 km backbone route with existing C-band DWDM equipment at 80 km amplifier spacing on G.652.D fiber. The C-band system is fully loaded with 80 channels at 50 GHz spacing, running 200G DP-16QAM (33 GBaud), providing 10.56 Tbps total C-band capacity. Traffic projections indicate a need for 20+ Tbps within 18 months.
Solution: The operator upgrades to a C+L band line system by adding L-band EDFA cards at each amplifier site, installing C/L band splitters/combiners, and activating 80 additional L-band channels. Due to the 2,400 km distance and OSNR limitations of DP-16QAM in the L-band over this reach, the L-band channels are configured with DP-QPSK at 64 GBaud, providing 200G per wavelength.
Result: C-band: 80 channels x 200G = 16 Tbps; L-band: 80 channels x 200G = 16 Tbps. Total: 32 Tbps — effectively tripling the original C-band capacity. The C-band channels retain their original modulation while the L-band channels use a more robust modulation format to account for the higher noise figure and SRS penalties. Raman pre-amplifiers are deployed at every third amplifier site to boost L-band OSNR on the longest spans.
9.2 Metro/DCI: Data Center Interconnect
Scenario: A cloud service provider needs 100+ Tbps of capacity between two data center campuses separated by 120 km. The route has 4 dark fiber pairs available.
Solution: Using C+L band with 128 channels at 75 GHz spacing and 800G DP-16QAM with probabilistic constellation shaping (PCS) at 130 GBaud per wavelength, each fiber achieves 102.4 Tbps. Over the short 120 km distance (single span or two-span with one inline amplifier), the OSNR budget is very comfortable even with L-band penalties.
Result: A single fiber pair delivers over 100 Tbps, leaving three fiber pairs as growth capacity or protection. The total potential capacity across all four fiber pairs exceeds 400 Tbps.
Capacity Reference: C+L band coherent systems deliver 24 Tbps (QPSK, 4,800 km reach), 48 Tbps (16-QAM, 700 km reach), and up to 72 Tbps (64-QAM, 60 km reach). With modern 800G per-wavelength technology on 75 GHz flex-grid spacing, aggregate C+L capacities are increasing further. The capacity formula N x B (where N = number of wavelengths, B = bit rate per wavelength) scales directly with coherent DSP generation advances.
9.3 Industry Landscape and Market Drivers (2025-2026)
The optical transport industry is experiencing a technology-driven transformation as AI infrastructure demand accelerates the adoption of C+L band systems. Disaggregated WDM architectures, which decouple transponders from optical line systems, are reshaping how operators build and scale their networks. Open line systems now enable independent sourcing of coherent modules, amplifiers, and ROADMs, giving operators flexibility to deploy best-of-breed technology at each layer. The transition from 400G to 800G and 1.6T coherent pluggable modules is accelerating, with ZR and ZR+ form factors bringing DWDM capabilities directly into router line cards.
The vendor landscape features several major technology providers. Ciena's WaveLogic 6 Extreme (WL6e) platform operates at 200 GBaud on 3nm process technology, delivering 1.6 Tbps single-carrier performance with DP-64QAM and probabilistic constellation shaping. Nokia, which integrated Infinera's indium phosphide photonic integrated circuit (PIC) technology into its optical portfolio, offers both silicon photonics and InP coherent approaches through its PSE-6s and successor platforms. Nokia Bell Labs has demonstrated 800 Gbps over 7,865 km and 41 Tbps unrepeated C-band transmission over 291 km. The combined Nokia-Infinera portfolio provides design flexibility across both PIC platforms.
Ribbon Communications showcased its Apollo 9408 and 9458 platforms at OFC 2025, delivering an industry-highest 25.6T line capacity in a 2RU form factor. In November 2025, Ribbon demonstrated 20 Tbps optical transmission over 10,000 km on the JUNO trans-Pacific submarine cable using its Apollo 9408 transponder (5nm, 140 GBaud) and Apollo 9608 submarine-grade line system. JUNO is planned as a 20-fiber-pair system with over 350 Tbps total capacity between Japan and the United States. In March 2025, NTT West and Cisco completed the world's first field verification of C+L band coherent pluggable optics over 60 km in Osaka, demonstrating C+L viability for metro and national backbone routes using IP-optical converged (Routed Optical Networking) architecture. Cisco's Acacia-based coherent pluggable modules have also seen strong adoption, with all major hyperscalers now among the customer base.
Disaggregated WDM architectures have become a dominant deployment model, particularly among hyperscale cloud providers. Microsoft, Amazon, and Google have driven widespread adoption of 400ZR coherent pluggable modules, with the transition to 800G ZR/ZR+ now accelerating. Nokia, Ciena, and Cisco all ship 800G pluggable coherent products, and the industry roadmap points toward standardized 1.6T ZR+ modules. Cisco's Acacia-based coherent pluggable portfolio, built on silicon photonics, supports IP-optical convergence through Routed Optical Networking (RON) architecture, bringing DWDM directly into router platforms.
10. Submarine C+L Band Systems
10.1 Unique Challenges for Submarine Applications
Submarine cable systems present the most extreme test for C+L band technology. With cable lengths reaching 6,000-16,000 km and hundreds of inline amplifiers (repeaters), the cumulative effects of SRS tilt, gain flattening errors, and noise accumulation are dramatically amplified compared to terrestrial systems.
In a submarine C+L system with 130 repeaters (typical for a 6,500 km trans-oceanic link), the SRS tilt is compensated at each repeater. However, the C/L band splitter at each repeater introduces approximately 0.5 dB of additional insertion loss, and the L-band EDFA contributes approximately 0.5 dB higher noise figure compared to a C-band-only system. The cumulative OSNR impact is significant: L-band channels in a C+L submarine system typically have 1.0-1.5 dB worse OSNR than C-band channels in a C-band-only system of equivalent length.
Furthermore, the interaction between bands through SRS creates tight requirements for gain equalization. Laboratory measurements on a 6,600 km C+L submarine link with 130 amplifiers showed that a mere 1 dB change in the output power of one band caused measurable power variations in the other band after propagation through the full amplifier chain. This inter-band coupling requires coordinated control of both C-band and L-band amplifiers across the entire cable length, a significantly more complex problem than managing a single-band system.
10.2 C+L vs. SDM for Submarine Capacity
For submarine cable operators, the decision between C+L band expansion and Space Division Multiplexing (SDM, using additional fiber pairs or multi-core fiber) is a critical strategic choice. C+L band doubles the capacity per fiber pair but introduces the complexity and OSNR penalties described above. SDM scales capacity by adding parallel fiber paths, each operating in the C-band with proven technology, but requires more physical space in the cable and more amplifiers per repeater.
The submarine cable industry predominantly uses SDM (increasing from 4 to 8, 12, 16, or even 20+ fiber pairs per cable) for new builds, while C+L band remains essential for capacity upgrades on existing cables. The JUNO trans-Pacific cable, currently under construction between Japan and the United States, exemplifies the state of the art: planned as a 20-fiber-pair system with over 350 Tbps total capacity. In November 2025, Ribbon Communications demonstrated 20 Tbps optical transmission over 10,000 km on the JUNO cable using its Apollo 9408 transponder (5nm process, 140 GBaud) and Apollo 9608 submarine-grade line system, achieving per-wavelength rates from 400 Gbps to 1.2 Tbps with flexible modulation. Lumen Technologies was selected to provide the terrestrial backhaul connectivity for JUNO's U.S. landing.
Nokia's PSE-6s coherent engine delivers up to 1.2 Tbps per wavelength (130 GBaud, single DSP) or 2.4 Tbps per line card (dual DSP) for submarine landing terminal equipment (SLTE), with its combined Nokia-Infinera optical portfolio now offering both silicon photonics and indium phosphide approaches. Nokia Bell Labs has demonstrated 800 Gbps over a single wavelength at 7,865 km (approximately Tokyo-to-Seattle distance) and 41 Tbps over 291 km on unrepeated C-band transmission. The Pacific Light Cable Network (PLCN) was among the first submarine cables to use C+L band commercially, supporting 240 channels of 100 Gbps, and Sparkle has deployed C+L technology on its BlueMed submarine system. For upgrade scenarios on existing fiber pairs with fixed infrastructure, C+L band expansion remains the most practical and cost-effective option, providing near-2x capacity without the expense of new cable installation.
11. Future Directions: Beyond C+L
11.1 S+C+L Band Extension and Beyond
Research efforts are extending the usable optical spectrum well beyond C+L. The S-band (1460-1530 nm) would add approximately 4.8 THz of bandwidth, bringing the S+C+L total to approximately 14.4 THz (3x over C-band-only). S-band amplification is more challenging than L-band, as standard erbium-doped fibers cannot provide gain in this region. Thulium-Doped Fiber Amplifiers (TDFAs), semiconductor optical amplifiers (SOAs), and multi-pump Raman amplification are being explored as S-band amplification candidates.
At OFC 2025, NICT and Sumitomo Electric set a new world record: 1.02 petabits per second transmission over 1,808 km using a 19-core randomly coupled multi-core fiber with standard 0.125 mm cladding diameter. This achieved a capacity-distance product of 1.86 exabits per second-km, the highest ever recorded, using C+L band amplification across all 19 cores. In August 2025, NTT demonstrated 160 Tbps long-haul transmission over more than 1,000 km by opening a new ultra-long-wavelength region called the "X band" (around 1,700 nm). Using a novel ultra-broadband optical repeater based on PPLN wavelength band conversion technology, NTT expanded the total signal bandwidth to 27 THz (6.7x greater than conventional C-band systems), employing stimulated Raman scattering itself as a beneficial mechanism to extend the low-loss transmission window.
At ECOC 2025, NICT and 11 international partners demonstrated 430 Tbps on a single standard-compliant G.654 fiber (ITU-T) over 10 km, surpassing their own 2024 record of 402 Tbps with nearly 20% less overall bandwidth. The breakthrough exploited few-mode transmission in the O-band alongside single-mode E/S/C/L-band transmission, tripling the O-band capacity. Similarly, a field deployment of anti-resonant hollow-core fibers (AR-HCF) achieved 114.9 Tbps over 137 km across S+C+L bands, demonstrating terabit-scale real-time coherent transmission on novel fiber types.
11.2 Sixth-Generation Coherent DSP: 1.6 Tbps and Beyond
Sixth-generation coherent DSPs have fundamentally changed C+L band system capabilities. Ciena's WaveLogic 6 Extreme (WL6e), built on 3nm process technology and operating at 200 GBaud, is the industry's first 1.6 Tbps single-carrier coherent solution. WL6e delivers 1.6 Tbps single-carrier wavelengths for metro and short-haul ROADM deployments and 800 Gbps over the longest terrestrial links, with 50% reduction in space and power per bit versus the previous generation.
Key deployment milestones include AT&T setting a 1.6 Tbps long-distance record between Newark and Philadelphia (296 km), Telstra achieving 1.6 Tbps over 736 km in Australia, euNetworks deploying the first 1.6 Tbps wavelength in Europe, and Colt completing 1.2 Tbps transatlantic transmission on the Grace Hopper cable.
Nokia's combined PSE-7 and ICE-8 development programs (from the Nokia and Infinera legacy portfolios respectively) target 1.6 Tbps-class single-carrier performance, challenging Ciena's current lead. Both companies bring different PIC technologies: Nokia contributes silicon photonics while Infinera adds indium phosphide expertise, giving the combined entity design flexibility similar to Ciena's "technology agnostic" approach. Cisco's Acacia-based pluggable coherent portfolio has seen rapid adoption, with CEO Chuck Robbins noting that all major hyperscalers are now customers. Ribbon Communications' Apollo platform supports integrated and modular C+L band approaches with its patented Fast SRS Suppression technology. Looking ahead, the industry roadmap points toward 3.2 Tbps single-carrier capacity within the next generation, using 256QAM and symbol rates exceeding 200 GBaud.
11.3 Machine Learning-Assisted SRS Management
Next-generation coherent DSP engines are being designed with explicit C+L band awareness. Machine learning algorithms can predict SRS tilt changes based on traffic patterns and pre-adjust amplifier settings before transients occur. Ciena's WL6e DSP processes 1,600 tera operations per second, capable of supporting sampling rates as fast as 1 microsecond for in-service streaming telemetry, enabling real-time detection of external events such as lightning, earthquakes, or fiber intrusion attempts. Additionally, advanced nonlinear compensation techniques (such as digital back-propagation extended across both bands) can partially mitigate the inter-band Raman interaction at the receiver, recovering some of the OSNR lost to SRS.
11.4 Multi-Core Fiber with C+L Band
The combination of multi-core fiber (MCF) with C+L band operation represents the ultimate capacity scaling path, already demonstrating petabit-per-second fiber capacities in laboratory settings. At OFC 2025, NICT and Sumitomo Electric achieved 1.02 Pbps over 1,808 km using a 19-core randomly coupled MCF with standard 0.125 mm cladding diameter, operating across C+L bands. Earlier, the same team demonstrated 1.7 Pbps over 63.5 km using the same fiber type, transmitting 381 wavelength channels across 19 cores with 64QAM modulation. These results represent more than an order of magnitude higher capacity than current operational single-mode fiber systems, which are limited to approximately 250 Tbps per fiber.
The practical challenges of inter-core crosstalk, per-core amplification, and SRS management across all cores and bands remain active research areas. However, the fact that standard cladding diameter (0.125 mm) MCF can be spliced and handled with existing cable infrastructure makes this technology a realistic path to deployment. Coupled MCF designs deliberately allow controlled signal mixing between cores, then use MIMO digital signal processing at the receiver to separate the signals. This approach reduces the per-core space requirements, enabling higher core counts within the standard cladding. As C+L band technology and multi-core fiber converge with advanced DSP, petabit-per-second commercial systems within the next decade appear increasingly achievable.
12. Conclusion and Recommendations
C+L band DWDM technology represents the most capital-efficient path to doubling the capacity of existing fiber infrastructure. By extending DWDM operation from the C-band into the L-band, operators can access approximately 9.6 THz of usable optical bandwidth, supporting 160 channels at 50 GHz spacing (80 per band). C+L band systems achieve total capacities from 21.1 Tbps (DP-QPSK at 33 GBaud, 132 Gbps per channel) to 48 Tbps (16-QAM) and up to 72 Tbps (64-QAM) based on the modulation format and reach requirements. With sixth-generation coherent DSPs now delivering 800G to 1.2 Tbps per wavelength, these aggregate capacities continue to scale as AI infrastructure demand drives rapid technology advancement.
The engineering challenges of C+L band design center on managing Stimulated Raman Scattering, which transfers energy from C-band to L-band channels and creates a power tilt of up to 8 dB per fiber span. Successful C+L deployment requires split-band EDFA architectures with precise tilt compensation, orchestrated traffic management to handle dynamic SRS transients, careful fiber selection (with G.654.E offering significant advantages for new builds), and hybrid Raman+EDFA amplification for long-haul applications where OSNR margins are tight.
For network operators evaluating capacity expansion options, the following recommendations apply. For terrestrial networks with existing fiber, C+L band upgrade provides the most efficient capacity doubling path, leveraging existing fiber infrastructure without new route construction. For new greenfield builds, specifying G.654.E fiber maximizes C+L band performance through reduced SRS tilt and lower attenuation. For submarine systems, SDM (increased fiber pair counts, up to 20+ pairs on new cables like JUNO) is favored for new builds, with C+L band remaining essential for capacity upgrades on existing infrastructure. The PLCN (Pacific Light Cable Network) remains the only transoceanic cable deployed with C+L band EDFA technology to date. For data center interconnects, C+L band with sixth-generation coherent transceivers at 800G per wavelength on flex-grid spacing can deliver very high aggregate capacities over typical DCI distances of 50-200 km, where OSNR budgets are comfortable even with L-band penalties.
The optical networking industry is advancing rapidly, driven by the convergence of AI-driven bandwidth demand, sixth-generation coherent optics (Ciena WL6e, Nokia PSE-7/ICE-8, Cisco/Acacia pluggables), modular C+L solutions (Ribbon Apollo), and advanced fiber technology. C+L band deployment is now both technically mature and widely available. Disaggregated WDM architectures with open line systems enable operators to independently source transponders, amplifiers, and ROADMs. Research breakthroughs at 430 Tbps per single fiber (NICT, ECOC 2025), 1.02 Pbps over 1,808 km on multi-core fiber (OFC 2025), and NTT's 160 Tbps over 1,000+ km using the new X-band demonstrate that the technology trajectory extends far beyond C+L into multi-band, multi-mode, and multi-core dimensions. Understanding the design principles, impairment management techniques, and capacity planning methodologies presented in this article is essential for optical network engineers building the next generation of high-capacity transport infrastructure.
Summary Recommendations
Deploy C+L band systems when C-band capacity is exhausted or approaching limits; it effectively doubles the available spectrum without new fiber deployment
Specify G.654.E fiber for new routes to minimize SRS tilt (30-40% reduction) and maximize OSNR through lower attenuation (0.16 dB/km)
Use hybrid Raman+EDFA amplification for routes exceeding 1,500 km to compensate for the higher L-band noise figure and SRS penalties
Implement orchestrated traffic management with sub-10ms amplifier response times for stable operation under dynamic traffic conditions; solutions such as Ribbon's patented Fast SRS Suppression technology enable equalization to within 1 dB in under 60 milliseconds
Plan link budgets with 1-2 dB additional OSNR margin for L-band channels relative to C-band to account for higher noise figure and SRS effects
Evaluate sixth-generation coherent platforms (Ciena WL6e, Nokia PSE-7/ICE-8, Cisco/Acacia pluggables) for new line system deployments, as 1.2-1.6 Tbps per wavelength dramatically improves per-fiber economics and reduces power per bit by up to 50%
Adopt disaggregated WDM architectures where possible: open line systems enable independent sourcing of transponders and optical line systems, future-proofing for pluggable 800G/1.6T ZR+ modules
References
[1] ITU-T Recommendation G.694.1 -- Spectral grids for WDM applications: DWDM frequency grid.
[2] ITU-T Recommendation G.652 -- Characteristics of a single-mode optical fibre and cable.
[3] ITU-T Recommendation G.654 -- Characteristics of a cut-off shifted single-mode optical fibre and cable.
[4] IEEE/OSA Journal of Lightwave Technology -- "Raman Effect in Wideband WDM Transmission Systems."
[5] J.-C. Antona et al., "Ultralong-haul transmission in submarine open cables," in Undersea Fiber Communication Systems, Elsevier.
[6] P. Poggiolini et al., "The GN-Model of Fiber Non-Linear Propagation and its Applications," IEEE/OSA Journal of Lightwave Technology.
[10] Ribbon Communications, "Apollo 9408/9458 Compact Modular Transport and OLS Platforms" -- SRS Suppression and Modular C+L Deployment.
[11] NICT/Sumitomo Electric, "1.02 Petabit/s Transmission Over 1,808 km in a 19-Core Randomly-Coupled Multicore Fiber," OFC 2025 Post-Deadline Paper.
[12] NICT et al., "430 Tb/s GMI data rate over a standard G.654 fiber using few-mode O-band and single-mode ESCL-band transmission," ECOC 2025 Post-Deadline Paper.
[13] NTT, "27-THz ISRS-Supported Transmission Over 1040 km in S+C+L+U and Extreme Longer-Wavelength Band," OFC 2025 Post-Deadline Paper.
[14] NTT West and Cisco, "World's First Field Connectivity Test Using C+L Band Coherent Pluggable Optics" -- Press Release, March 2025.
[15] Sanjay Yadav, "Optical Network Communications: An Engineer's Perspective" -- Bridge the Gap Between Theory and Practice in Optical Networking.
Developed by MapYourTech Team
For educational purposes in Optical Networking Communications Technologies
Note: This guide is based on industry standards, best practices, and real-world implementation experiences. Specific implementations may vary based on equipment vendors, network topology, and regulatory requirements. Always consult with qualified network engineers and follow vendor documentation for actual deployments.
Feedback Welcome: If you have any suggestions, corrections, or improvements to propose, please feel free to write to us at [email protected]
Optical networking engineer with nearly two decades of experience across DWDM, OTN, coherent optics, submarine systems, and cloud infrastructure. Founder of MapYourTech.
Read full bio →
Everything you enjoy here — now fits right in your pocket. Whether you're on the commute, waiting at the lab, or unwinding on the couch — keep learning on the go.