
Generic selectors
Exact matches only
Search in title
Search in content
Post Type Selectors
Articles
lp_course
lp_lesson
Back
HomeCoherent OpticsC-Band vs. L-Band vs. S-Band:Optical Transmission Windows
C-Band vs. L-Band vs. S-Band:Optical Transmission Windows

C-Band vs. L-Band vs. S-Band:Optical Transmission Windows

Last Updated: April 2, 2026
30 min read
88
C-Band vs. L-Band vs. S-Band: Optical Transmission Windows | MapYourTech

C-Band vs. L-Band vs. S-Band:
Optical Transmission Windows

A comprehensive engineering reference covering spectral band definitions, amplification technologies, C+L band system design, S-band emerging research, and practical deployment considerations for modern DWDM networks.

Summary

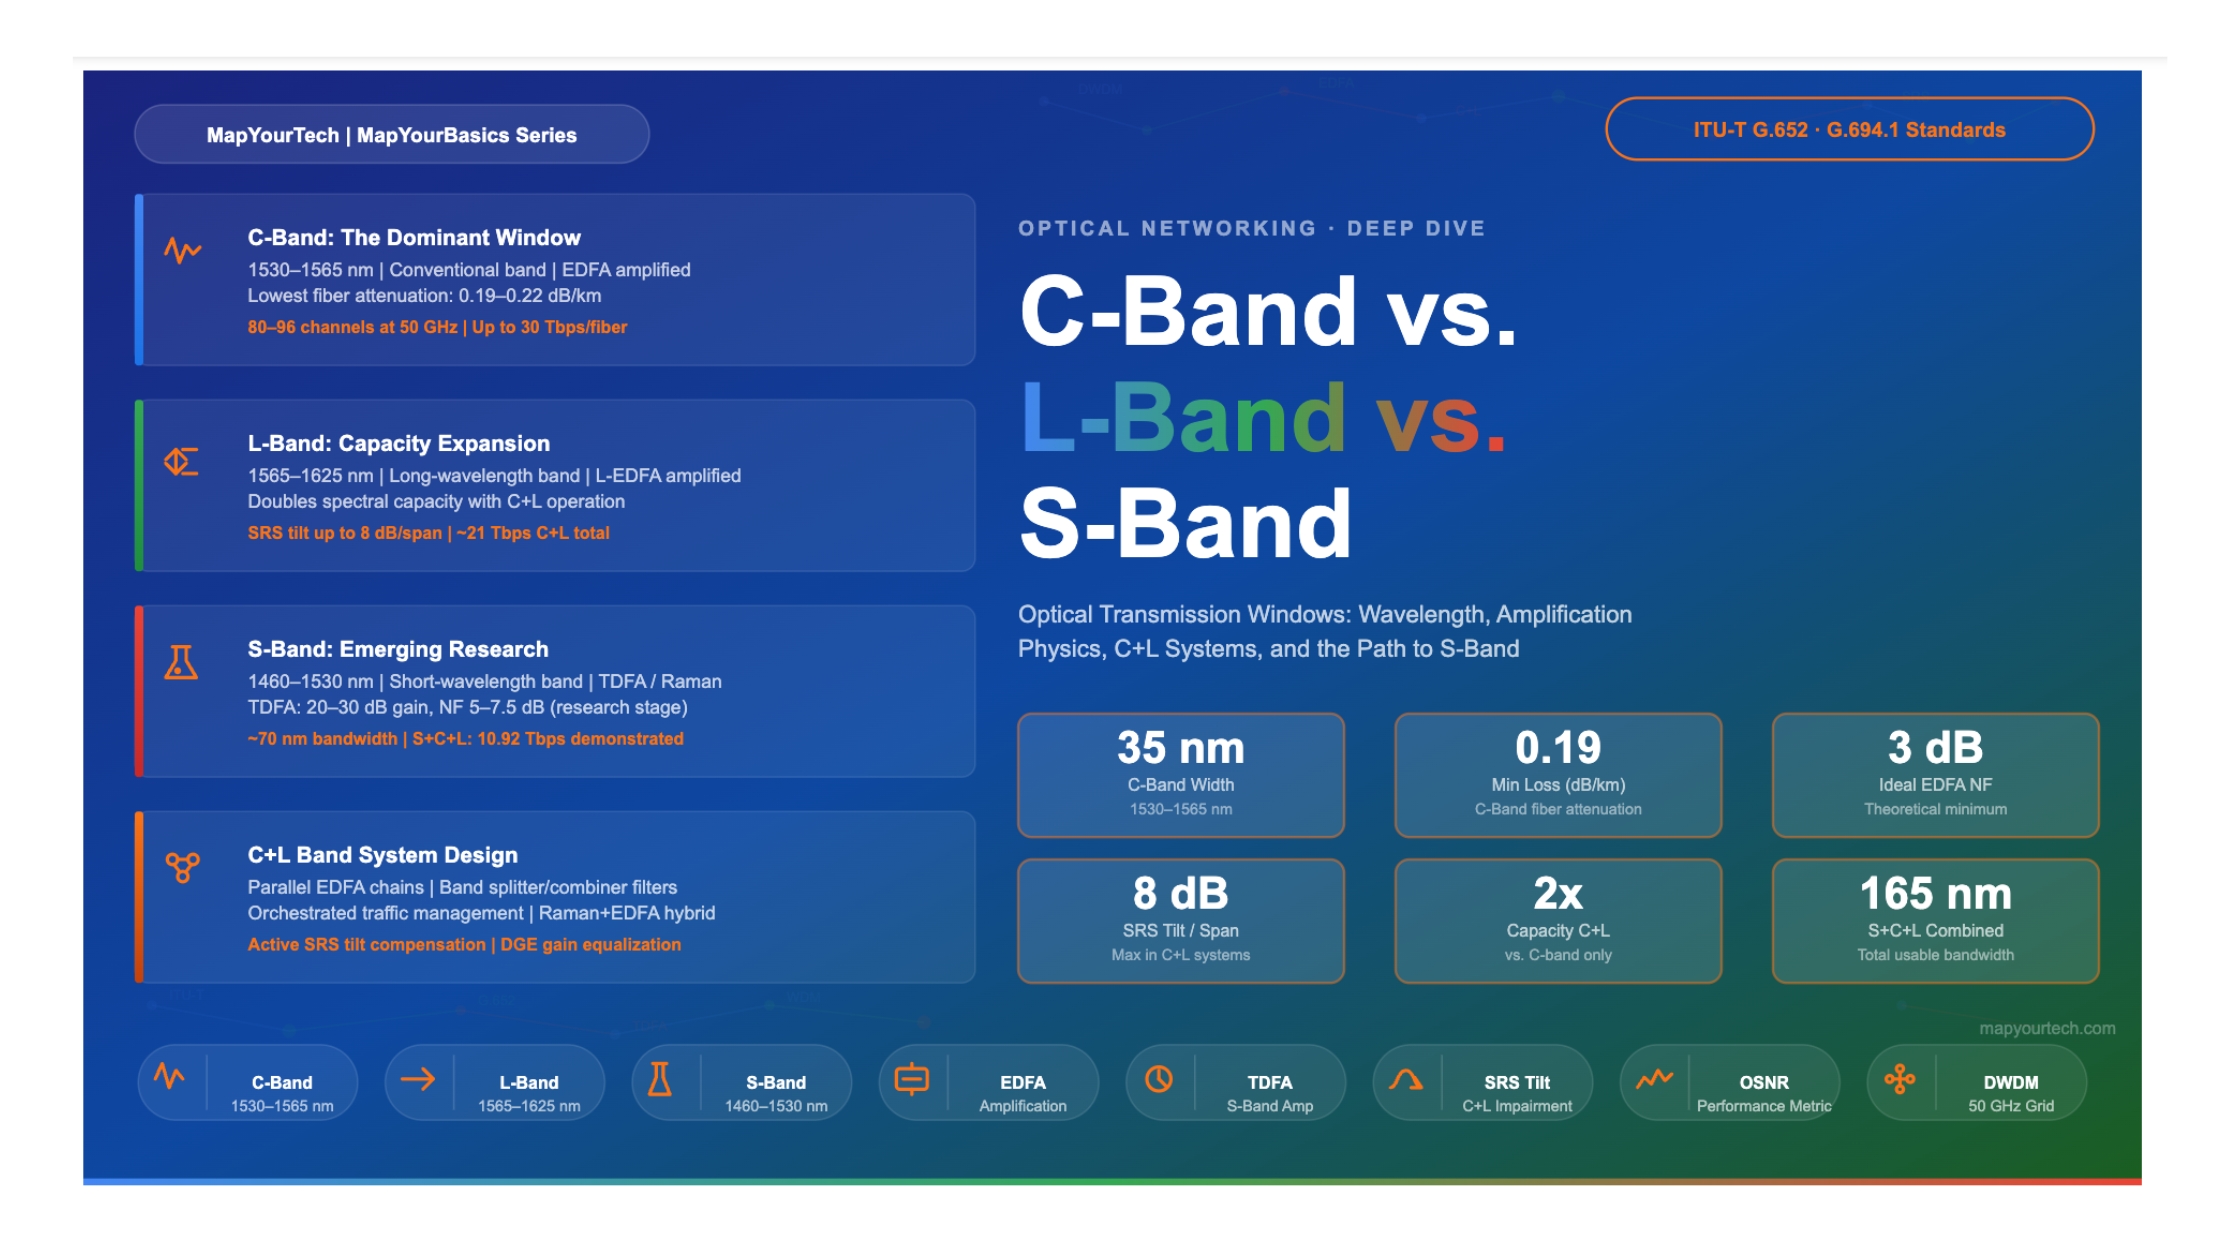
Optical fiber communication depends on matching wavelength windows to the physical properties of silica glass. Three bands dominate commercial and research deployments: the C-band (1530–1565 nm), the L-band (1565–1625 nm), and the S-band (1460–1530 nm). Each is shaped by a specific combination of fiber attenuation, chromatic dispersion behavior, and the availability of practical optical amplifiers.

The C-band has been the foundation of Dense Wavelength Division Multiplexing (DWDM) since the 1990s, driven by the erbium-doped fiber amplifier (EDFA) and the lowest fiber attenuation region in standard single-mode fiber. As traffic demand continues to grow, the L-band provides a natural capacity expansion path, effectively doubling available spectrum without new fiber deployments. C+L band systems are now deployed commercially, requiring careful management of inter-band effects such as Stimulated Raman Scattering (SRS).

The S-band, while the most challenging from an amplification standpoint, is the subject of active research using thulium-doped fiber amplifiers (TDFAs) and Raman techniques. Combined S+C+L operation promises a further leap in spectral capacity for future high-bandwidth networks. This article provides a thorough engineering reference for all three bands, covering physics, amplifier technology, system design, and practical trade-offs.

Section 1Introduction

The history of fiber optic communication is, in many ways, the history of learning to exploit the full potential of silica glass. When light travels through an optical fiber, it experiences different levels of attenuation, dispersion, and nonlinear interaction depending on the wavelength. This wavelength-dependent behavior is not uniform — it creates distinct transmission windows where long-distance, high-capacity communication is practical.

The International Telecommunication Union — Telecommunication Standardization Sector (ITU-T) formally defines six spectral bands for single-mode fiber systems, ranging from the O-band (1260–1360 nm) to the U-band (1625–1675 nm). Of these, three bands carry almost all commercial DWDM traffic and drive the most active research: the Conventional band (C-band), the Long-wavelength band (L-band), and the Short-wavelength band (S-band).

Each band represents a different trade-off between fiber physics, available amplifier technology, component ecosystem maturity, and system cost. Understanding these trade-offs — not just at a conceptual level, but with the quantitative detail that informs engineering decisions — is essential for anyone designing or operating modern optical networks. This article provides that foundation, drawing on ITU-T standards, deployed system architectures, and current research directions.

Section 2Optical Band Definitions per ITU-T

ITU-T standards define spectral bands based on fiber physical properties and practical system considerations. The boundaries are not arbitrary — each reflects a combination of fiber attenuation characteristics, the availability of amplifiers, and the need to separate transmission from maintenance functions. The following table reproduces the ITU-T band definitions as specified in the TR-OFCS Chapter 6 framework for single-mode fiber systems.

Band Name Wavelength Range (nm) Frequency Range (THz) Key Notes
O-band Original 1260 – 1360 221 – 238 Legacy PON, zero-dispersion near 1310 nm
E-band Extended 1360 – 1460 205 – 221 Water peak region; used for CWDM on low-water-peak fiber
S-band Short wavelength 1460 – 1530 196 – 205 PON downstream; emerging DWDM research; TDFA/Raman amplification
C-band Conventional 1530 – 1565 191 – 196 Dominant DWDM band; lowest fiber loss; EDFA optimized
L-band Long wavelength 1565 – 1625 184 – 191 Capacity expansion; L-band EDFA; higher dispersion
U-band Ultra-long wavelength 1625 – 1675 179 – 184 Reserved for maintenance (OTDR, fiber identification); no traffic

Table 1: ITU-T spectral band definitions for single-mode fiber systems (per TR-OFCS Chapter 6)

Optical Fiber Spectral Bands — Wavelength Overview O-Band 1260–1360 nm E-Band 1360–1460 nm S-Band 1460–1530 nm ~70 nm C Band 1530–1565 35 nm L-Band 1565–1625 nm ~60 nm U-Band 1625–1675 nm 1260 1360 1460 1530 1565 1625 1675 Wavelength (nm) Fiber Loss (schematic) ~0.19 dB/km Water peak ~1383 nm Low High

Figure 1: ITU-T optical spectral bands for single-mode fiber, with schematic fiber attenuation profile. The C-band sits at the minimum loss region of approximately 0.19–0.22 dB/km.

The C-band's dominance stems from a convergence of favorable physics. It sits near the minimum of silica fiber attenuation, which for standard single-mode fiber (ITU-T G.652) reaches approximately 0.19–0.22 dB/km. Crucially, the erbium-doped fiber amplifier, first demonstrated in 1987 and commercially deployed in the early 1990s, provides efficient optical gain precisely in this 1530–1565 nm window. This alignment of low loss and practical amplification created the conditions for the DWDM revolution.

Section 3C-Band: The Conventional Window

3.1 Physical Characteristics

The C-band, spanning 1530 to 1565 nm (approximately 191 to 196 THz), holds a unique position in optical communication. The name "Conventional" reflects the historical reality: this was the band where practical long-haul optical amplification first became possible, and the entire infrastructure of modern DWDM — from transceivers to multiplexers to ROADMs — was built around it.

From a fiber physics standpoint, the C-band benefits from several coinciding factors. Single-mode fiber manufactured to ITU-T G.652 specifications exhibits its lowest attenuation in this region, with typical values of 0.19 to 0.22 dB/km at 1550 nm. Chromatic dispersion in standard G.652 fiber falls in the range of approximately 15 to 18 ps/(nm·km) across the C-band — high enough to suppress four-wave mixing (FWM) and cross-phase modulation (XPM) between channels, yet low enough to be manageable with dispersion compensation or digital signal processing (DSP) equalization in coherent systems.

C-Band
1530 – 1565 nm
Frequency: 191 – 196 THz
Bandwidth: ~35 nm / ~4.8 THz
Fiber attenuation: 0.19–0.22 dB/km
Dispersion (G.652): 15–18 ps/(nm·km)
Amplifier: EDFA (980 nm / 1480 nm pump)
50 GHz channels: Up to ~96 channels
Maturity: Fully commercial, dominant

The foundation of all modern DWDM networks. Supported by the most mature ecosystem of components, amplifiers, and coherent transceiver technology.

L-Band
1565 – 1625 nm
Frequency: 184 – 191 THz
Bandwidth: ~60 nm / ~6.3 THz
Fiber attenuation: 0.20–0.24 dB/km
Dispersion (G.652): 18–22 ps/(nm·km)
Amplifier: L-band EDFA (longer EDF)
50 GHz channels: Up to ~96 channels
Maturity: Commercially deployed (C+L systems)

The primary capacity expansion path. Combined with C-band in C+L systems, roughly doubling available spectrum. Requires SRS tilt management between bands.

S-Band
1460 – 1530 nm
Frequency: 196 – 205 THz
Bandwidth: ~70 nm / ~6.7 THz
Fiber attenuation: 0.21–0.24 dB/km
Dispersion (G.652): 8–12 ps/(nm·km)
Amplifier: TDFA or Raman amplifier
Maturity: Research / early trials

Active area of research for next-generation capacity. Amplification is more complex than C or L band, but the physics are favorable. TDFA research is advancing steadily.

3.2 The EDFA and C-Band Dominance

The Erbium-Doped Fiber Amplifier (EDFA) is the technology that made C-band the dominant transmission window. It operates by exciting erbium ions (Er³⁺) in a silica fiber doped with erbium to a higher energy state using a pump laser — typically at 980 nm or 1480 nm. When an incoming signal photon at C-band wavelengths passes through the erbium-doped region, it stimulates the emission of an identical photon, amplifying the signal without optical-to-electrical conversion.

The EDFA gain G is the ratio of output power to input power:

/* EDFA Fundamental Gain Model */

G = P_out / P_in           /* Linear gain ratio */

G = exp(σ_e × N₂ × L)    /* Exponential gain model */

Where:
  σ_e  = emission cross-section of erbium ions
  N₂   = population density of excited erbium ions
  L    = length of erbium-doped fiber

/* Noise Figure */
NF  2n_sp

Where:
  n_sp = spontaneous emission factor (population inversion factor)
  Ideal EDFA: NF  3 dB (fully inverted; n_sp = 1)
  Practical EDFA: NF typically 3 – 6 dB
Premium Article — Free 21% Preview

Read the Full Analysis with Premium

The remaining 79% of this article — the design numbers, trade-offs and field guidance — is part of MapYourTech Premium, along with the full premium library, courses and professional tools.

Instant access · Cancel anytime · 48-hour trial available
Sanjay Yadav

Optical Communications & Network Automation Expert | Author of 3 Books for Optical Engineers | Founder, MapYourTech

Optical networking engineer with nearly two decades of experience across DWDM, OTN, coherent optics, submarine systems, and cloud infrastructure. Founder of MapYourTech.

Follow on LinkedIn

You May Also Like

52 min read 13 0 Like The Submarine Cable Stack: Open Cables, GSNR, SDM and Power Skip to main content...
  • Free
  • July 10, 2026
32 min read 10 0 Like Coherent DSP Architecture: From ADC Samples to Client Bits MAPYOURTECH | COHERENT OPTICS DEEP...
  • Free
  • July 10, 2026
42 min read 14 0 Like Building an Optical NOC Dashboard with OpenConfig Telemetry Skip to main content MapYourTech |...
  • Free
  • July 10, 2026

Course Title

Course description and key highlights

Course Content

Course Details