
C+L Band, Extended C+L Band and Super C+L Band: Usable Spectrum, Capacity and Multivendor Analysis
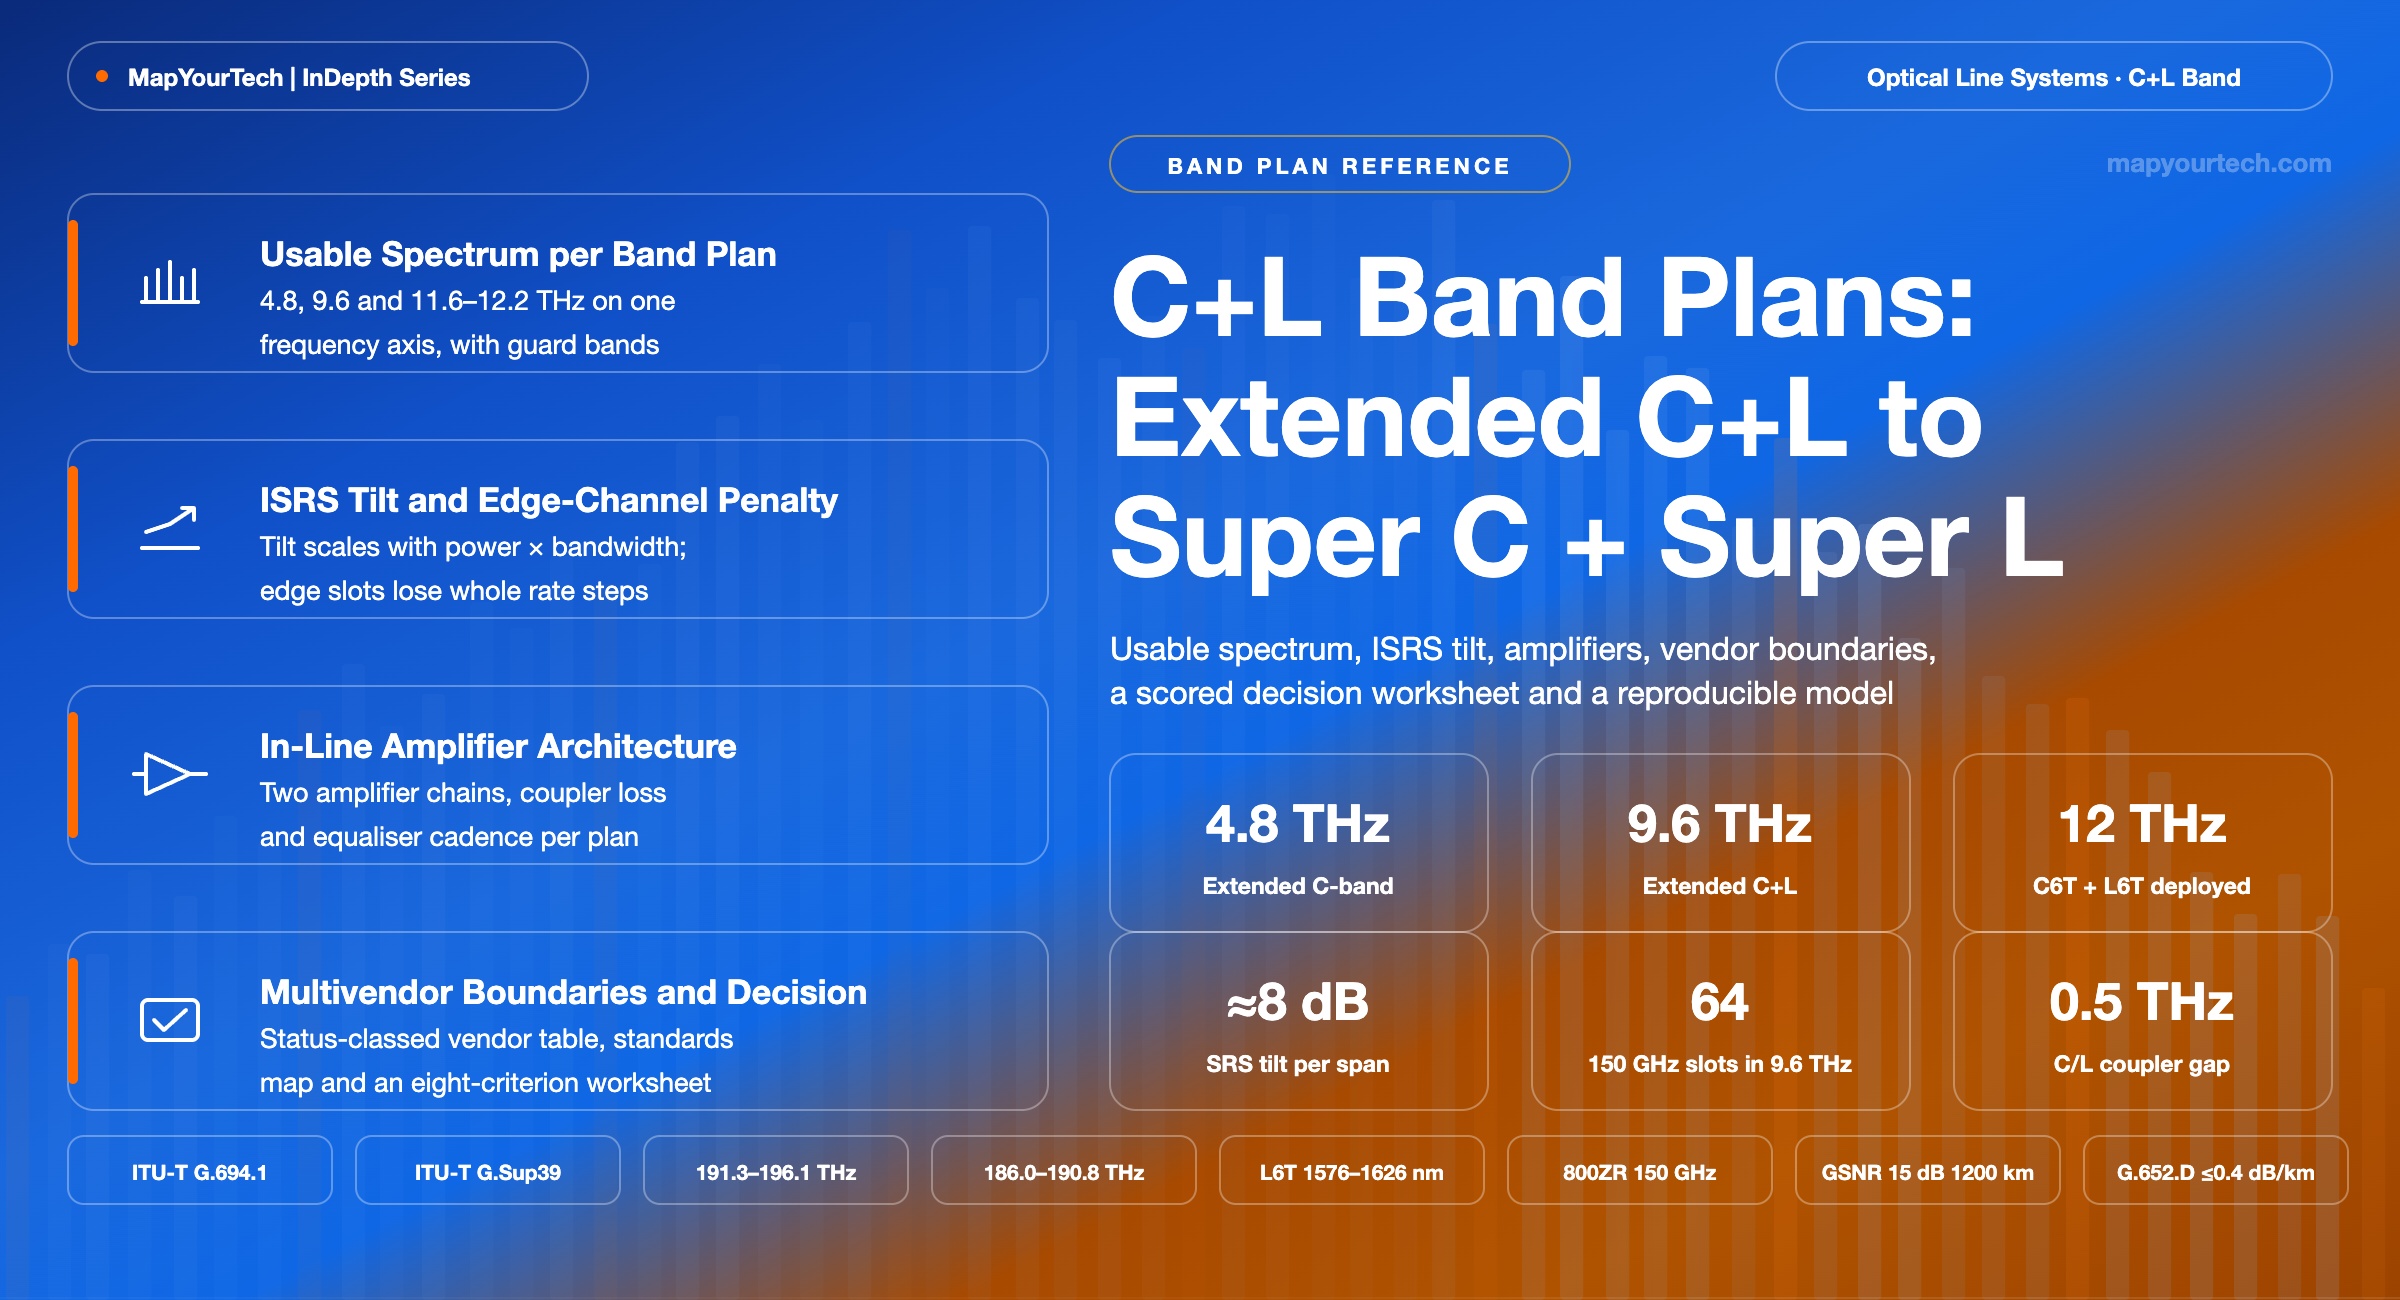
Every C-band and C+L band plan from the 40-channel C-band to super C plus super L, compared on the numbers that decide a design: THz delivered, channels per slot width, capacity the edge channels can still carry, the hardware each in-line site gains, the transient behaviour each plan introduces, and the interoperability boundaries that decide whether a second vendor can ever share the line.
Terahertz added at a band edge arrive with the loss and noise of that edge.
What You Will Learn
- Define usable optical spectrum as a line-system property and place the three plans on one frequency axis: 4.8 THz extended C, 9.6 THz extended C+L with its 0.5 THz inter-band gap, and 11.6–12.2 THz super C plus super L, using Figure 1 and Section 2.
- Map the sixteen ITU-T texts of Table A to the quantity each fixes, and state why no Recommendation defines a super C or super L band edge, so that a specification written as frequencies rather than band names can be answered by any vendor (Section 3).
- Convert usable spectrum to channel count and fill capacity at 75, 100 and 150 GHz slots — 64 slots of 150 GHz in 9.6 THz — and read the published fills of Table 2a against their conditions: arithmetic, vendor claim, field trial or desktop simulation (Section 5).
- Quantify inter-channel stimulated Raman scattering tilt from the first-order model of Section 6.1 — 5.6 dB per 80 km span for 192 channels at +1 dBm on G.652 — and trace why tilt scales with total power times total bandwidth.
- Derive capacity-equivalent bandwidth per plan from the design-case model of Section 6.2: 4.69 THz for extended C, 8.64 THz for extended C+L and 10.26 THz for super C+L at 1,200 km, with the model's simplifications and the direction of each error stated in Section 6.4.
- Count what a second band adds at an in-line amplifier site — a second amplifier chain, splitter and combiner losses of about 1 dB per site, and the equaliser cadence — and compare the 8 RU and 17 RU site designs of Figure 7 and Section 7.
- Read the commitment-status table of Table 1a — deployed 12 THz C6T + L6T long-haul cores, product options at 11.6–12.2 THz, a modelled 10.8 THz plan and 9.6 THz elsewhere — and apply the status classes to any vendor claim (Sections 5 and 13).
- Select a band plan with the eight-criterion worksheet of Table 9 and the three scored archetypes of Table 10, and write the specification, architecture, pre-award test, planning-model, operations and contract rules of Section 13 into an RFP.
1. Introduction
A single-mode fiber lit across the extended C-band carries 4.8 THz of usable spectrum, and every operator whose C-band is full faces the same three routes to more: add the L-band for a total of 9.6 THz, widen the C-band alone to a super C-band of about 6.1 THz, or widen both bands to a super C plus super L plan of 11.6 to 12.2 THz. The industry names for these options overlap in ways that cause specification errors, because one vendor's "extended C" is another vendor's "super C", and a request for "C+L" without a stated width can be quoted against three different amplifier designs. This article fixes the terms first, then compares the three plans on usable spectrum, channel count, fill capacity, edge-channel performance, in-line amplifier hardware, transient behaviour, multivendor interoperability and cost for terrestrial and data center interconnect (DCI) line systems on ITU-T G.652 and G.654 fiber, closing with selection guidance by network application; submarine C+L design follows different power and repeater constraints and is covered in the companion article on C+L submarine line design and SRS-induced tilt control.
Published vendor engineering material from Ciena, Nokia (including the former Infinera portfolio), Cisco, Ribbon and Huawei supplies the band widths, edge wavelengths and the modelled capacity figures that each vendor is prepared to state publicly, and every such figure is labelled as a vendor claim where it appears. Unpublished operator modelling from a three-vendor request for proposal (RFP) on North American long-haul corridors of 500 to 4,000 km, referenced here as operator modelling, supplies the field-side view: what a C+L system delivered relative to the C-band-only system it replaced, how much rack space each vendor's equalisation site needed, and which vendors could ship L-band on day one.
2. Usable Optical Spectrum Definition and Band Boundaries
Usable optical spectrum is the contiguous frequency range over which a line system delivers its specified gain, gain flatness and noise figure at every amplifier site, less guard bands consumed by band splitters and filter edges; it is a line-system property, not a fiber property. The fiber transmits from 1260 nm to 1625 nm, but only the range the amplifiers and wavelength selective switches (WSS) pass at specification is usable, and it is measured in terahertz.
Four adjacent quantities get conflated with usable spectrum, and each conflation produces a different planning error. The ITU-T wavelength band (C-band 1530–1565 nm, L-band 1565–1625 nm, standard-specified in ITU-T G.Sup39) names a region of the fiber's transmission window and says nothing about what a given amplifier delivers; the 1565–1625 nm L-band definition spans 7.07 THz, yet no deployed L-band amplifier delivers more than about 6 THz of it. The amplifier gain bandwidth is the range over which an erbium-doped fiber amplifier (EDFA) delivers gain at all, wider than the flat region the system can use; a C-band EDFA has measurable gain past 1570 nm, but its specified flat-gain region ends where the gain-flattening filter (GFF) design ends. The lit spectrum is the subset of usable spectrum currently occupied by channels or by amplified spontaneous emission (ASE) loading, and it changes with every add or drop. The occupied bandwidth of one channel is the symbol rate times one plus the roll-off factor, the width one carrier fills inside its allocated slot per ITU-T G.694.1 fixed and flexible grids.
Wavelength-to-frequency conversion and channel count
Δf = c · Δλ / λ2 Nch = ⌊ Busable / Sslot ⌋
Where:
- Δf is the frequency span in THz; c is 299,792.458 km/s; Δλ is the wavelength span in nm; λ is the centre wavelength in nm (a 35 nm span centred on 1548 nm converts to 4.38 THz; the same 35 nm centred on 1595 nm converts to 4.13 THz, because the conversion factor falls with the square of wavelength)
- Busable is the usable spectrum in GHz (4,800 for the extended C-band, 6,100 for a 6.1 THz super C-band)
- Sslot is the flexible-grid slot width in GHz, a multiple of 12.5 GHz per ITU-T G.694.1 (75 GHz for a 64 GBd 400G carrier, 150 GHz for a 118 GBd 800ZR-class carrier)
One worked instantiation threads the rest of the article. An extended C-band of 4.8 THz holds 4,800 / 150 = 32 slots of 150 GHz; an 800 Gb/s carrier in each slot gives 32 × 0.8 = 25.6 Tb/s per band, and an extended C plus extended L plan gives 51.2 Tb/s per fiber, which is the fill figure Nokia publishes for its C+L line system with 800G transceivers (vendor figure). A 6.1 THz super C-band holds 6,100 / 150 = 40 slots, or 32.0 Tb/s at the same rate, before any edge-channel penalty is applied.
Takeaway: Usable spectrum is what the amplifier chain delivers at specification, in THz, after guard bands; the ITU-T band name, the amplifier gain bandwidth and the lit spectrum are three different quantities, and a band plan is specified correctly only when its frequency edges and its guard band are both stated.
3. ITU-T Recommendation Framework for Band Plan Design
ITU-T Study Group 15 publishes the texts that fix what a band plan may claim and how its performance is measured, and every comparison in this article rests on one or more of them. No single Recommendation specifies a C+L or super C+L system; the framework is a set of texts that fix the grid, the fiber, the amplifier parameters, the nonlinear mechanisms, the monitoring points, the safety procedures and the single-channel interfaces, and the band plan is what a designer assembles inside those constraints. Table A lists each text with the quantity it governs and the section of this article that depends on it, so that a specification or an acceptance test can cite the source rather than the vendor.
Table A: ITU-T Recommendations and Supplements governing band plan design, with the quantity each fixes and where it enters the comparison — table
| ITU-T text | Title (short) | What it fixes for a band plan | Where it enters |
|---|---|---|---|
| G.694.1 | Spectral grids for WDM applications: DWDM frequency grid | Nominal centre frequencies on fixed 12.5/25/50/100 GHz grids anchored at 193.1 THz, and the flexible grid with 6.25 GHz centre granularity and 12.5 GHz slot-width granularity, across the S-, C- and L-bands; it does not fix which frequencies a system delivers | Sections 2, 5, 9 |
| G.Sup39 | Optical system design and engineering considerations | Spectral band descriptors (O 1260–1360, E 1360–1460, S 1460–1530, C 1530–1565, L 1565–1625, U 1625–1675 nm), stated as descriptors and not specifications; OSNR and Q relationships; treatment of SPM, XPM, FWM and SRS; reference bandwidth for OSNR | Sections 2, 4, 6 |
| G.Sup42 | Guide on the use of ITU-T Recommendations related to optical technology | Classification of fiber nonlinearities into scattering (SBS, SRS) and Kerr effects, the parameters that govern their severity (dispersion, effective area, channel count and spacing, length, power) and the measurement methods for installed sections | Sections 6, 11 |
| G.652 | Characteristics of a single-mode optical fibre and cable | Attenuation coefficient limits at 1310, 1550 and 1625 nm (G.652.D maximum 0.4 dB/km at 1625 nm), chromatic dispersion and PMD limits, cable cut-off; the spectral attenuation slope that sets the L-band loss penalty | Sections 6, 11 |
| G.654 | Characteristics of a cut-off shifted single-mode optical fibre and cable | Low-loss, large-effective-area fibre classes (G.654.C submarine, G.654.E terrestrial) with attenuation and effective-area limits that lower both span loss and nonlinear interference for wide-band systems | Sections 6, 11 |
| G.655 / G.656 | Non-zero dispersion-shifted fibre / wideband non-zero dispersion fibre | Dispersion ranges across 1530–1565 nm (G.655) and 1460–1625 nm (G.656) that decide whether a plan's C-band edge is FWM-limited and whether the L-band is usable on installed plant | Sections 11, 12 |
| G.661 / G.662 / G.663 | Optical amplifier definitions, generic characteristics and application aspects | Gain, gain flatness, gain tilt, noise figure, saturated output power and transient parameters of optical fibre amplifiers, and the application-related treatment of SRS, FWM and XPM in amplified multichannel systems | Sections 7, 11 |
| G.665 | Generic characteristics of Raman amplifiers and Raman amplified subsystems | Type codes, reference models, on-off gain, effective noise figure, double Rayleigh scattering and pump RIN parameters for distributed and lumped Raman amplification | Sections 7, 11 |
| G.664 | Optical safety procedures and requirements for optical transmission systems | Automatic power reduction and restart procedures for amplified DWDM and Raman-pumped systems against IEC 60825 hazard levels, including the requirement to reduce backward Raman pump power on loss of continuity | Sections 7, 11 |
| G.671 | Transmission characteristics of optical components and subsystems | Parameters of WDM filters, band splitters and combiners, dynamic channel equalizers and WSS modules: insertion loss, passband, isolation and attenuation range | Sections 7, 9 |
| G.680 | Physical transfer functions of optical network elements | How ripple, tilt, filter narrowing and noise accumulate through a cascade of amplifiers and ROADMs, the basis for per-site equalisation cadence | Sections 6, 7 |
| G.697 | Optical monitoring for DWDM systems | Monitoring points and parameters (per-channel power, OSNR, wavelength) at amplifier and ROADM sites, the basis for the OCM and transient measurements in acceptance | Sections 8, 13 |
| G.698.2 | Amplified multichannel DWDM applications with single-channel optical interfaces | The black-link method: application codes and reference points at which a single-channel interface from one vendor is specified independently of the line system, in the C-band | Sections 9, 13 |
| G.959.1 | Optical transport network physical layer interfaces | Multichannel inter-domain interface application codes and operating wavelength ranges; the model for band-specific interface codes that L-band and super spectrum lack | Sections 9, 13 |
| G.977 / G.977.1 / G.978 / G.Sup41 | Submarine cable systems: characteristics, open cable, cable, design guidelines | Open-cable interface parameters (GSNR, gain flatness, nominal signal powers per band), design-guideline treatment of SRS as a broadband effect in wide-band systems, and the design-life and repair margins that terrestrial C+L procurement can copy | Sections 9, 13 |
| G.7701 / G.7702 | Common control aspects / architecture for SDN control of transport networks | Control-plane architecture within which per-band amplifier and equaliser objects are exposed to a controller through management interfaces | Sections 9, 13 |
Read the Full Analysis with Premium
The remaining 88% of this article — the design numbers, trade-offs and field guidance — is part of MapYourTech Premium, along with the full premium library, courses and professional tools.
You May Also Like
-
Premium
-
September 1, 2026
-
Premium
-
September 1, 2026
-
Free
-
August 31, 2026