
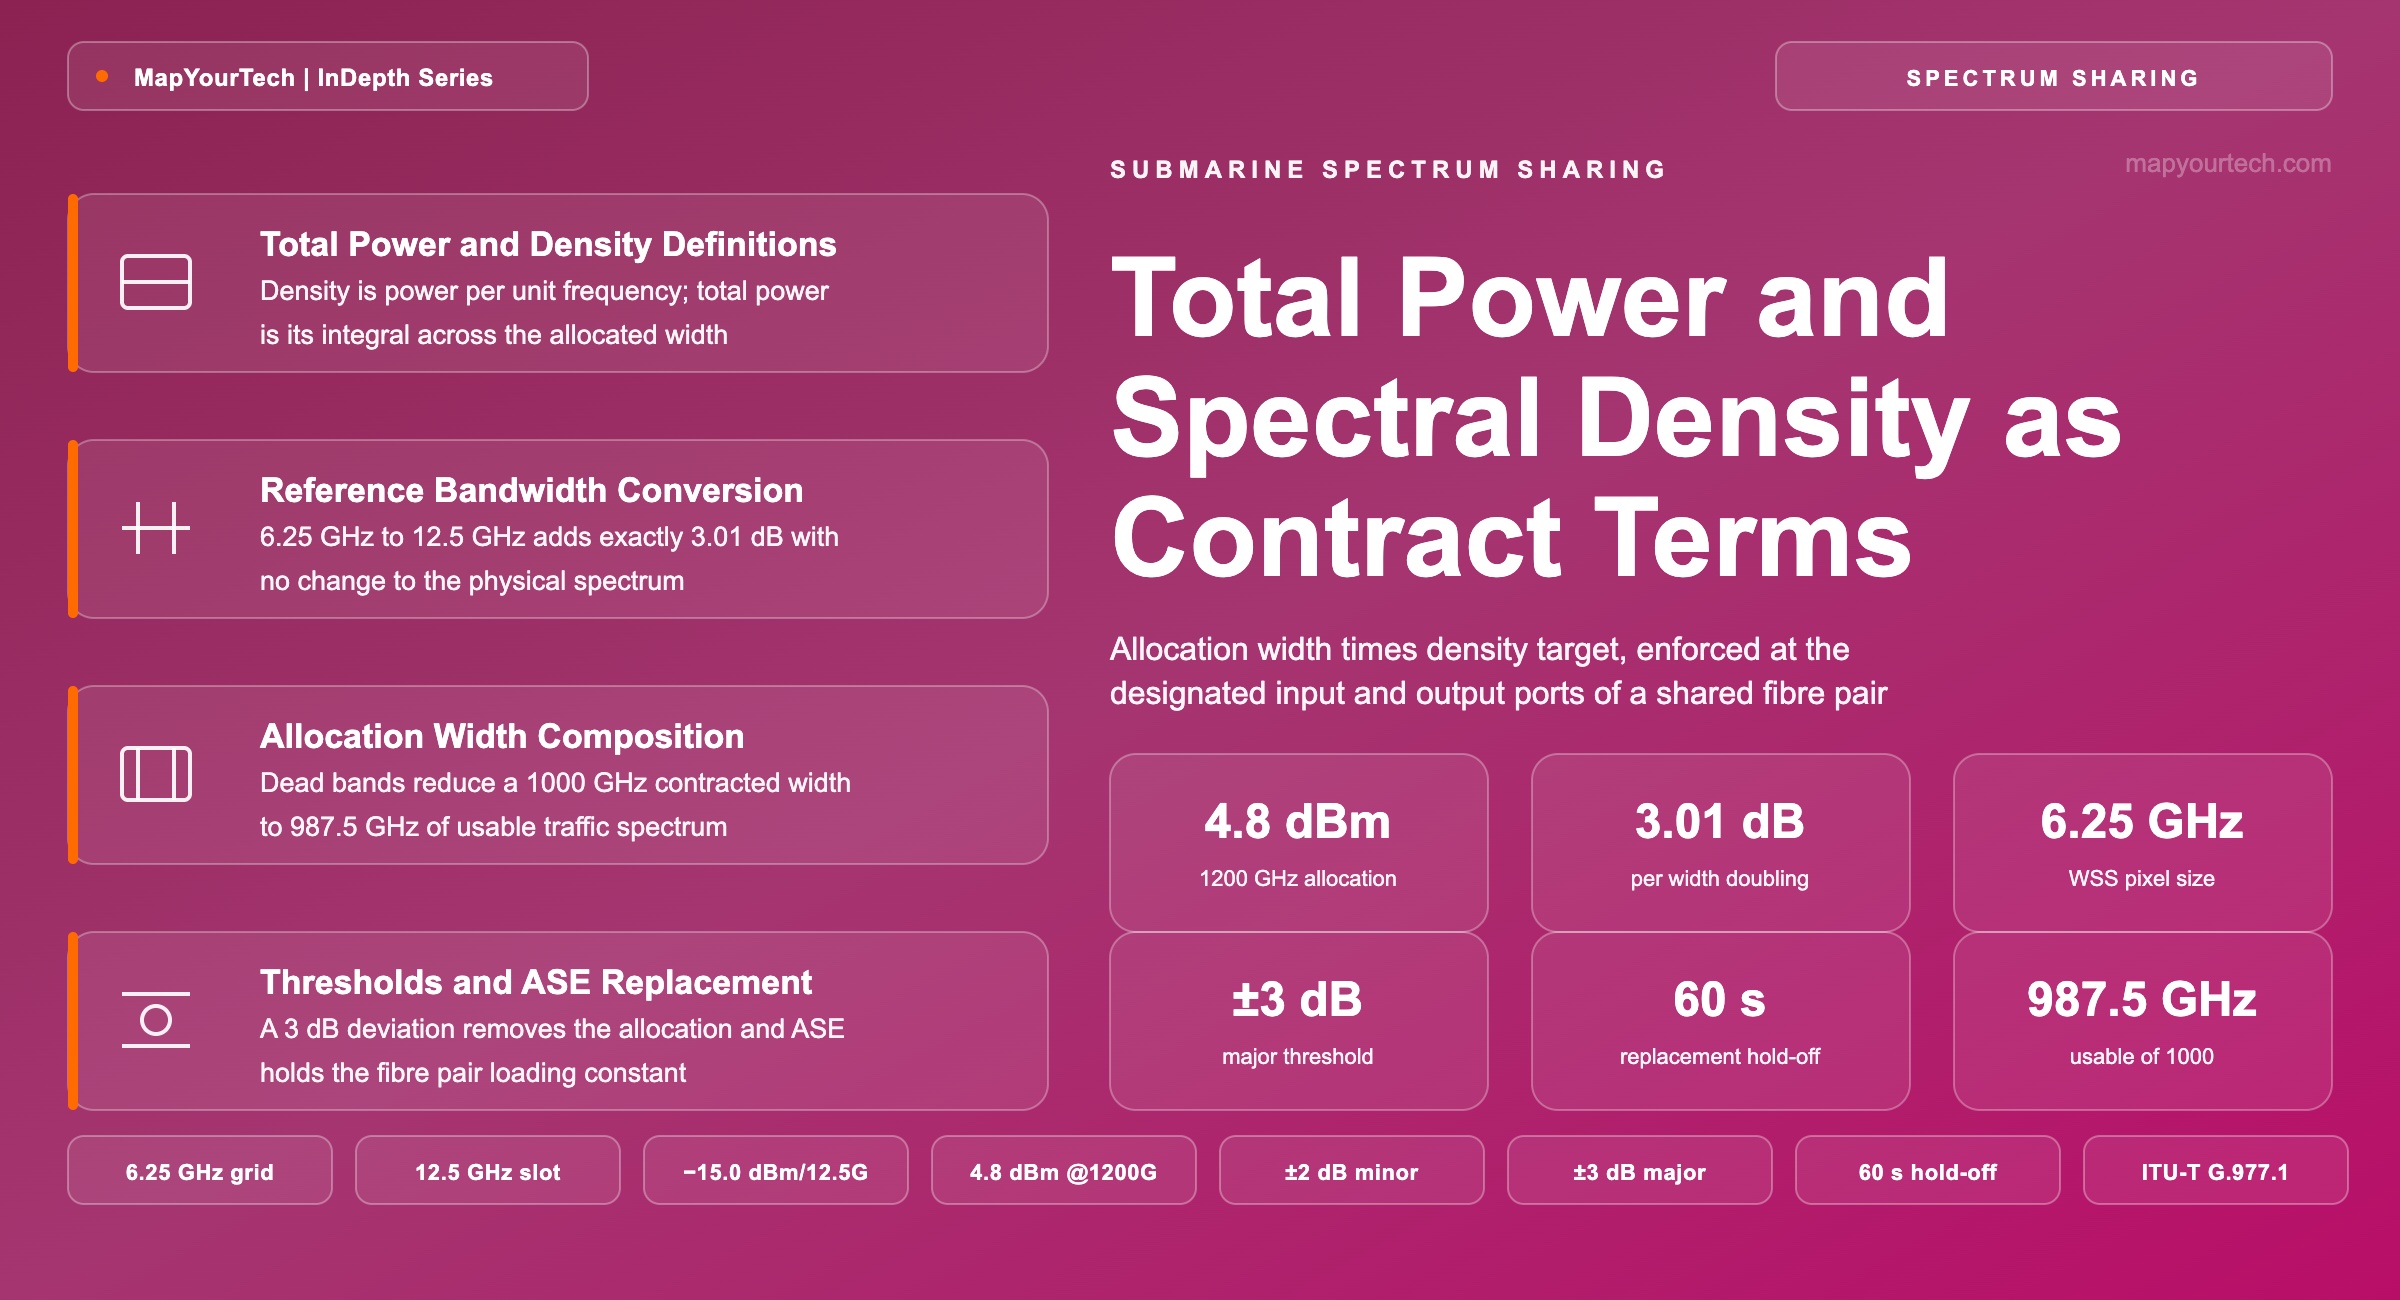
Total Power and Spectral Density as Spectrum Contract Terms
Total power and allocated spectral range at the designated input and output ports are the terms a spectrum sharing service enforces, and total input power follows from allocation width multiplied by the target spectral density.
A metric with no threshold is a number nobody acts on.
What You Will Learn
- Define power spectral density and total power as separate contract quantities, and state which of the two an optical power meter can read at a port.
- Compute total input power from allocation width and density target: −15.0 dBm/12.5 GHz across 1200 GHz gives 4.8 dBm, using the identity in Section 5.
- Convert a density figure between reference bandwidths, where 6.25 GHz to 12.5 GHz adds exactly 3.01 dB and a figure quoted without its reference is unusable.
- Audit a completed parameter set for internal consistency, recovering an implied 496 GHz allocation from a 19.0 dB gap between density and total power.
- Separate contracted width from usable width through the dead-band arithmetic of Section 7, where 6.25 GHz per side reduces 1000 GHz to 987.5 GHz.
- Explain why a half-filled allocation at the correct total power runs 3.01 dB above the density target and produces spectral hole burning.
- Place the ±2 dB minor and ±3 dB major threshold bands, the 60 s replacement hold-off and the 30 min reinstatement hold-off from Table 4.
- Run the seven-step acceptance handover of Section 11 and isolate a power or density fault with the signature matrix in Table 7.
1. Introduction
A spectrum sharing service sells a block of optical frequency on a submarine fibre pair, and the block is defined by four numbers: a start frequency, a stop frequency, a target power spectral density, and a total optical power. Two of those four are measured at a physical connector during acceptance and re-measured continuously in service. The total power and the allocated spectral range at the designated input and output ports are the terms both parties enforce, because they are the terms an optical channel monitor and a power meter can adjudicate without either party inspecting the other's traffic.
The commercial arrangement fits in one sentence and the physics behind it does not. A spectrum user buys what behaves like a virtual fibre pair between two cable landing stations, provisions its own submarine line terminal equipment (SLTE), chooses its own modulation formats and channel plan, and runs its own capacity upgrades on its own schedule. What the user does not get is isolation. Every user's power enters the same amplifier chain, and that chain runs in constant total output power mode, so a change in one user's spectrum redistributes gain across every other user's channels on the same fibre. Spectrum sharing works because the interface contract removes the user's ability to make that change accidentally.
Total input power is where the contract becomes arithmetic. A power spectral density target is a statement about power per unit bandwidth and requires an optical spectrum analyser to verify. A total power target is a single scalar that a handheld power meter or a tap coupler with a photodiode reads in seconds. The two are the same commitment expressed at two levels of resolution, and the total power figure is derived by multiplying the density target by the contracted allocation width. That derivation is what lets routine monitoring run on cheap instrumentation while the density target remains the physically meaningful constraint.
This article covers the parameter set that defines a spectrum service at its interface ports, the derivation connecting width and density to total power, the reference-bandwidth conventions that make a density figure interpretable, the threshold bands and amplified spontaneous emission (ASE) replacement behaviour that enforce the contract in service, and the acceptance sequence that proves compliance at turn-up. It does not cover the commercial valuation of one spectral region against another, nor the capacity a given allocation supports, which depends on the transponder technology the user selects. Adjacent treatments of demarcation and interference policing in spectrum services and of open submarine cable architecture carry those layers.
2. Total Power and Power Spectral Density Definitions
Power spectral density is the optical power carried per unit of optical frequency, quoted as an absolute power referenced to a stated bandwidth — for example −15.0 dBm per 12.5 GHz. Total power is the integral of that density across the whole allocated range, quoted as a single absolute power in dBm. Density describes the shape of the spectrum; total power describes its area. Both are measured at a named connector.
Read the Full Analysis with Premium
The remaining 88% of this article — the design numbers, trade-offs and field guidance — is part of MapYourTech Premium, along with the full premium library, courses and professional tools.
You May Also Like
-
Premium
-
August 22, 2026
-
Premium
-
August 21, 2026
-
Premium
-
August 21, 2026